| |||||||||||||||||||||||||||||||||||||||||||||||||||||||||||||
All 57 seats to Peterborough City Council 29 seats needed for a majority | |||||||||||||||||||||||||||||||||||||||||||||||||||||||||||||
---|---|---|---|---|---|---|---|---|---|---|---|---|---|---|---|---|---|---|---|---|---|---|---|---|---|---|---|---|---|---|---|---|---|---|---|---|---|---|---|---|---|---|---|---|---|---|---|---|---|---|---|---|---|---|---|---|---|---|---|---|---|
Turnout | 67.0% | ||||||||||||||||||||||||||||||||||||||||||||||||||||||||||||
| |||||||||||||||||||||||||||||||||||||||||||||||||||||||||||||
|
The 1997 Peterborough City Council election took place on 7 May 1997 to elect members of Peterborough City Council in England. [1] This was on the same day as the 1997 general election and other local elections.
The whole council was up for election on new ward boundaries and the number of seats increased by 8. Labour lost their majority on the council, which they had narrowly gained at the 1996 election. Despite this, Labour remained the largest party.
1997 Peterborough City Council election | ||||||||||
---|---|---|---|---|---|---|---|---|---|---|
Party | This election | Full council | This election | |||||||
Seats | Net | Seats % | Other | Total | Total % | Votes | Votes % | +/− | ||
Labour | 27 | 2 | 47.4 | 0 | 27 | 47.4 | 76,738 | 45.8 | -3.6 | |
Conservative | 24 | 11 | 42.1 | 0 | 24 | 42.1 | 71,278 | 42.5 | +9.1 | |
Liberal | 3 | 5.3 | 0 | 3 | 5.3 | 10,320 | 6.2 | +0.7 | ||
Liberal Democrats | 2 | 3.5 | 0 | 2 | 3.5 | 7,344 | 4.4 | -4.2 | ||
Independent Labour | 1 | 1 | 1.8 | 0 | 1 | 1.8 | 1,734 | 1.0 | N/A | |
Ind. Conservative | 0 | 0.0 | 0 | 0 | 0.0 | 266 | 0.2 | N/A | ||
Independent | 0 | 2 | 0.0 | 0 | 0 | 0.0 | N/A | N/A | N/A |
Party | Candidate | Votes | % | ±% | |
---|---|---|---|---|---|
Conservative | D. Over | 1,054 | 69.8 | +11.2 | |
Labour | J. Budding | 457 | 30.2 | +5.9 | |
Majority | 597 | 39.6 | +6.3 | ||
Turnout | 1,511 | 76.2 | +28.2 | ||
Registered electors | 1,983 | ||||
Conservative hold | Swing | 2.7 | |||
Party | Candidate | Votes | % | ||
---|---|---|---|---|---|
Labour | M. Choudhary | 2,199 | 62.1 | ||
Labour | R. Akhtar* | 2,074 | 58.6 | ||
Labour | N. Khan* | 1,962 | 55.4 | ||
Conservative | M. Hussain* | 1,338 | 37.8 | ||
Conservative | M. Hussain | 974 | 27.5 | ||
Conservative | B. Searle | 935 | 26.4 | ||
Turnout | 3,539 | 82.0 | |||
Registered electors | 4,316 | ||||
Labour hold | |||||
Labour hold | |||||
Labour hold |
Party | Candidate | Votes | % | ||
---|---|---|---|---|---|
Liberal | A. Miners* | 2,463 | 63.2 | ||
Liberal | K. Duell | 2,239 | 57.4 | ||
Liberal | R. Pobgee | 2,100 | 53.9 | ||
Labour | C. Fisher | 1,013 | 26.0 | ||
Labour | W. Houghton | 958 | 24.6 | ||
Labour | V. Stokes | 828 | 21.2 | ||
Conservative | S. Holmes | 422 | 10.8 | ||
Conservative | A. Stead | 411 | 10.5 | ||
Conservative | M. Wright | 332 | 8.5 | ||
Turnout | 3,898 | 71.9 | |||
Registered electors | 5,421 | ||||
Liberal hold | |||||
Liberal hold |
Party | Candidate | Votes | % | ||
---|---|---|---|---|---|
Labour | J. Farrell* | 1,917 | 60.8 | ||
Labour | C. Edwards | 1,699 | 53.9 | ||
Labour | M. Todd* | 1,497 | 47.5 | ||
Conservative | P. Grimwood | 1,233 | 39.1 | ||
Conservative | D. Hillson | 1,075 | 34.1 | ||
Conservative | M. Tahir | 1,016 | 32.2 | ||
Turnout | 3,151 | 53.3 | |||
Registered electors | 5,912 | ||||
Labour hold | |||||
Labour hold | |||||
Labour hold |
Party | Candidate | Votes | % | ||
---|---|---|---|---|---|
Conservative | J. Bartlett | 1,659 | 55.3 | ||
Conservative | D. Sanders | 1,337 | 44.6 | ||
Labour | B. Allway | 1,076 | 35.9 | ||
Labour | Z. Bishrey* | 955 | 31.8 | ||
Ind. Conservative | A. Semper | 266 | 8.9 | ||
Turnout | 3,001 | 74.2 | |||
Registered electors | 4,045 | ||||
Conservative win (new seat) | |||||
Conservative win (new seat) |
Party | Candidate | Votes | % | ||
---|---|---|---|---|---|
Labour | C. Gray* | 2,142 | 64.6 | ||
Labour | M. Farrell | 1,732 | 52.2 | ||
Labour | B. Payton | 1,495 | 45.1 | ||
Conservative | G. Casey | 1,177 | 35.5 | ||
Conservative | A. Vigar | 997 | 30.0 | ||
Conservative | B. Picton | 903 | 27.2 | ||
Turnout | 3,318 | 65.4 | |||
Registered electors | 5,073 | ||||
Labour hold | |||||
Labour hold | |||||
Labour hold |
Party | Candidate | Votes | % | ±% | |
---|---|---|---|---|---|
Conservative | J. Holdich* | 1,415 | 75.1 | +11.3 | |
Labour | S. Lawrence | 468 | 24.9 | +6.6 | |
Majority | 947 | 50.2 | +4.7 | ||
Turnout | 1,883 | 75.7 | +30.2 | ||
Registered electors | 2,487 | ||||
Conservative hold | Swing | 2.4 | |||
Party | Candidate | Votes | % | ±% | |
---|---|---|---|---|---|
Conservative | N. Sanders* | 905 | 68.4 | N/A | |
Labour | G. McClean | 418 | 31.6 | –5.6 | |
Majority | 487 | 36.8 | N/A | ||
Turnout | 1,323 | 93.6 | +52.9 | ||
Registered electors | 1,413 | ||||
Conservative gain from Independent |
Party | Candidate | Votes | % | ||
---|---|---|---|---|---|
Independent Labour | C. Swift* | 1,734 | 52.1 | ||
Labour | W. Burke* | 794 | 23.9 | ||
Labour | P. Baylis* | 706 | 21.2 | ||
Conservative | P. Gale | 544 | 16.3 | ||
Conservative | A. Paul | 294 | 8.8 | ||
Liberal Democrats | L. Martin | 256 | 7.7 | ||
Turnout | 3,329 | 70.9 | |||
Registered electors | 4,695 | ||||
Independent Labour hold | |||||
Labour hold |
Party | Candidate | Votes | % | ||
---|---|---|---|---|---|
Labour | D. Weston | 2,392 | 64.0 | ||
Labour | J. Johnson | 2,383 | 63.7 | ||
Labour | H. Lakhanpaul | 1,969 | 52.7 | ||
Conservative | M. Bye | 1,347 | 36.0 | ||
Conservative | B. Dunham | 1,248 | 33.4 | ||
Conservative | C. McKeown | 1,134 | 30.3 | ||
Turnout | 3,739 | 73.7 | |||
Registered electors | 5,073 | ||||
Labour win (new seat) | |||||
Labour win (new seat) |
Party | Candidate | Votes | % | ±% | |
---|---|---|---|---|---|
Conservative | B. Franklin* | 1,011 | 72.3 | +15.4 | |
Labour | S. Larder | 388 | 27.7 | –1.2 | |
Majority | 623 | 44.5 | +16.6 | ||
Turnout | 1,399 | 67.6 | +24.7 | ||
Registered electors | 2,070 | ||||
Conservative hold | Swing | 8.3 | |||
Party | Candidate | Votes | % | ||
---|---|---|---|---|---|
Labour | J. Owens* | 1,881 | 41.9 | ||
Labour | C. Weaver* | 1,797 | 40.1 | ||
Labour | M. Goffrey* | 1,674 | 37.3 | ||
Conservative | L. Hopkins | 1,385 | 30.9 | ||
Liberal Democrats | A. Ewing | 1,273 | 28.4 | ||
Conservative | L. Markwick | 1,257 | 28.0 | ||
Conservative | J. Staines | 1,163 | 25.9 | ||
Turnout | 4,486 | 62.0 | |||
Registered electors | 7,325 | ||||
Labour hold | |||||
Labour hold | |||||
Labour hold |
Party | Candidate | Votes | % | ||
---|---|---|---|---|---|
Conservative | M. Cereste* | 2,257 | 57.5 | ||
Conservative | A. Kempsell | 2,224 | 56.7 | ||
Conservative | M. D'Andrew | 2,010 | 51.2 | ||
Labour | K. Speirs | 1,669 | 42.5 | ||
Labour | A. Dale | 1,557 | 39.7 | ||
Labour | R. Strangward | 1,344 | 34.3 | ||
Turnout | 3,923 | 58.9 | |||
Registered electors | 6,660 | ||||
Conservative hold | |||||
Conservative win (new seat) | |||||
Conservative win (new seat) |
Party | Candidate | Votes | % | ||
---|---|---|---|---|---|
Conservative | Y. Lowndes* | 2,086 | 47.3 | ||
Conservative | J. Peach | 2,020 | 45.8 | ||
Conservative | P. Kreling* | 1,903 | 43.2 | ||
Labour | A. Brosnan | 1,577 | 35.8 | ||
Labour | C. Hubback | 1,355 | 30.7 | ||
Labour | M. Hussain | 1,242 | 28.2 | ||
Liberal | S. Goldspink | 743 | 16.9 | ||
Turnout | 4,408 | 66.3 | |||
Registered electors | 6,649 | ||||
Conservative hold | |||||
Conservative gain from Labour | |||||
Conservative hold |
Party | Candidate | Votes | % | ||
---|---|---|---|---|---|
Labour | S. Bradley* | 1,936 | 51.5 | ||
Labour | J. Bleakney | 1,773 | 47.2 | ||
Labour | P. Ward* | 1,379 | 36.7 | ||
Conservative | P. Lowndes | 1,015 | 27.0 | ||
Conservative | M. Kreling | 958 | 25.5 | ||
Conservative | M. Thompson | 866 | 23.0 | ||
Liberal Democrats | P. Turner | 808 | 21.5 | ||
Turnout | 3,758 | 83.8 | |||
Registered electors | 4,485 | ||||
Labour hold | |||||
Labour hold | |||||
Labour win (new seat) |
Party | Candidate | Votes | % | ||
---|---|---|---|---|---|
Labour | A. Cox* | 1,891 | 51.2 | ||
Labour | J. Ledgister* | 1,547 | 41.9 | ||
Labour | M. Rainey | 1,475 | 39.9 | ||
Liberal | C. Ash | 1,133 | 30.7 | ||
Liberal | S. McGee | 911 | 24.7 | ||
Liberal | D. Robson | 731 | 19.8 | ||
Conservative | A. Hopkins | 669 | 18.1 | ||
Conservative | R. Markwick | 572 | 15.5 | ||
Conservative | J. Smedley | 555 | 15.0 | ||
Turnout | 3,695 | 79.0 | |||
Registered electors | 4,675 | ||||
Labour hold | |||||
Labour hold | |||||
Labour hold |
Party | Candidate | Votes | % | ||
---|---|---|---|---|---|
Conservative | R. Crick | 749 | 50.8 | ||
Labour | M. Dale | 723 | 49.1 | ||
Conservative | G. Simons | 626 | 42.5 | ||
Labour | A. Pears | 607 | 41.2 | ||
Turnout | 1,473 | 66.2 | |||
Registered electors | 2,225 | ||||
Conservative win (new seat) | |||||
Labour win (new seat) |
Party | Candidate | Votes | % | ||
---|---|---|---|---|---|
Conservative | M. Burton | 1,445 | 50.9 | ||
Labour | A. Ellis | 1,393 | 49.1 | ||
Conservative | M. Storti | 1,251 | 44.1 | ||
Labour | D. Matthews | 1,232 | 43.4 | ||
Turnout | 2,837 | 67.7 | |||
Registered electors | 4,191 | ||||
Conservative win (new seat) | |||||
Labour win (new seat) |
Party | Candidate | Votes | % | ||
---|---|---|---|---|---|
Conservative | C. Sneesby | 1,619 | 44.0 | ||
Labour | R. Palmer | 1,598 | 43.5 | ||
Labour | P. Bonner* | 1,502 | 40.8 | ||
Labour | J. Reece* | 1,170 | 31.8 | ||
Conservative | J. Brett | 1,008 | 27.4 | ||
Conservative | P. Fierro | 915 | 24.9 | ||
Liberal Democrats | S. Crowe | 457 | 12.4 | ||
Turnout | 3,677 | 56.0 | |||
Registered electors | 6,566 | ||||
Conservative gain from Labour | |||||
Labour hold | |||||
Labour hold |
Party | Candidate | Votes | % | ||
---|---|---|---|---|---|
Liberal Democrats | M. Jackson* | 1,482 | 47.2 | ||
Liberal Democrats | N. Sandford* | 1,200 | 38.2 | ||
Conservative | J. Roberts* | 915 | 29.1 | ||
Labour | C. Cabom | 746 | 23.8 | ||
Conservative | R. Allen | 640 | 20.4 | ||
Labour | D. Tarren | 523 | 16.7 | ||
Turnout | 3,141 | 63.0 | |||
Registered electors | 4,985 | ||||
Liberal Democrats hold | |||||
Liberal Democrats hold |
Party | Candidate | Votes | % | ||
---|---|---|---|---|---|
Labour | P. Clements* | 1,703 | 42.7 | ||
Conservative | K. Jarvie | 1,490 | 37.3 | ||
Conservative | J. Goodfellow | 1,350 | 33.8 | ||
Conservative | M. Sims | 1,348 | 33.8 | ||
Labour | W. Easton | 1,213 | 30.4 | ||
Labour | J. Hall | 1,197 | 30.0 | ||
Liberal Democrats | C. Dacre | 797 | 20.0 | ||
Turnout | 3,990 | 71.8 | |||
Registered electors | 5,557 | ||||
Labour win (new seat) | |||||
Conservative win (new seat) | |||||
Conservative win (new seat) |
Party | Candidate | Votes | % | ||
---|---|---|---|---|---|
Conservative | R. Burke | 1,975 | 42.7 | ||
Conservative | D. Raines | 1,864 | 40.3 | ||
Conservative | J. Hunter | 1,628 | 35.2 | ||
Labour | N. Gregory | 1,578 | 34.1 | ||
Labour | D. McGeachie | 1,442 | 31.2 | ||
Liberal Democrats | K. Scott | 1,071 | 23.2 | ||
Turnout | 4,624 | 82.8 | |||
Registered electors | 5,584 | ||||
Conservative win (new seat) | |||||
Conservative win (new seat) |
Party | Candidate | Votes | % | ||
---|---|---|---|---|---|
Conservative | R. Perkins | 2,725 | 63.7 | ||
Conservative | G. Ridgway* | 2,693 | 62.9 | ||
Conservative | D. Thorpe | 2,486 | 58.1 | ||
Labour | A. Dowson | 1,551 | 36.3 | ||
Labour | F. Cooke | 1,345 | 31.4 | ||
Labour | M. Stonham | 1,248 | 29.2 | ||
Turnout | 4,278 | 42.9 | |||
Registered electors | 9,971 | ||||
Conservative gain from Labour | |||||
Conservative hold | |||||
Conservative hold |
Party | Candidate | Votes | % | ±% | |
---|---|---|---|---|---|
Conservative | J. Horrell | 850 | 70.9 | +19.5 | |
Labour | M. Beaver | 349 | 29.1 | +16.5 | |
Majority | 501 | 41.8 | +12.4 | ||
Turnout | 1,199 | 81.0 | +38.5 | ||
Registered electors | 1,481 | ||||
Conservative hold | Swing | 1.5 | |||
Peterborough, commonly known as the City of Peterborough, is a unitary authority district with city status in the ceremonial county of Cambridgeshire, England. The area is named after its largest settlement, Peterborough but also covers a wider area of outlying villages and hamlets.
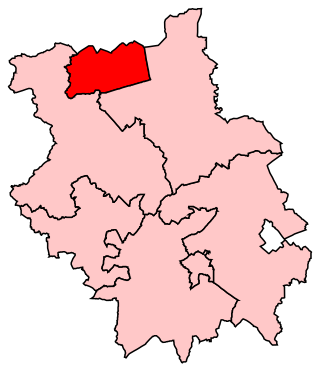
North West Cambridgeshire is a county constituency represented in the House of Commons of the Parliament of the United Kingdom since 2005 by Shailesh Vara of the Conservative Party. It elects one Member of Parliament (MP) by the first past the post system of election.
Peterborough is a borough constituency represented in the House of Commons of the Parliament of the United Kingdom since 2019 by Paul Bristow of the Conservative Party.
Cambridgeshire County Council is the county council of Cambridgeshire, England. The council consists of 61 councillors, representing 59 electoral divisions. The council is based at New Shire Hall in Alconbury Weald, near Huntingdon. It is part of the East of England Local Government Association and a constituent member of the Cambridgeshire and Peterborough Combined Authority.
The 1997 United Kingdom local elections took place on Thursday 1 May 1997 in England, and Thursday 21 May 1997 in Northern Ireland. Elections took place for all of the English country councils, some English unitary authorities and all of the Northern Ireland districts. The local elections were held on the same day as the 1997 general election.
The 2014 Peterborough City Council election took place on 22 May 2014 to elect members of Peterborough City Council in England. This was on the same day as other local elections.
Peterborough is a unitary authority in Cambridgeshire, England. Until 1 April 1998 it was a non-metropolitan district.
The inaugural Cambridgeshire and Peterborough mayoral election was held on 4 May 2017 to elect the Mayor of Cambridgeshire and Peterborough. The supplementary vote system was used to elect the mayor for a four-year term of office. Subsequent elections will be held in May 2021 and every four years after.
The 2012 Peterborough City Council election took place on 3 May 2012 to elect members of Peterborough City Council in England. The last time these seats were up for election was 2008. This was on the same day as other local elections.
A by-election took place in the Parliamentary constituency of Peterborough on 6 June 2019. It was won by Lisa Forbes of the Labour Party. Mike Greene of the Brexit Party took second place.
Elections to Peterborough City Council took place on 2 May 2019. 20 of the 60 seats were contested. This was on the same day as other local elections across the United Kingdom.
Lisa Jane Forbes is a British Labour Party politician who served as the Member of Parliament for Peterborough from a June 2019 by-election to the general election in December that year.
The 2021 Cambridgeshire and Peterborough mayoral election was held on 6 May 2021 to elect the mayor of Cambridgeshire and Peterborough.
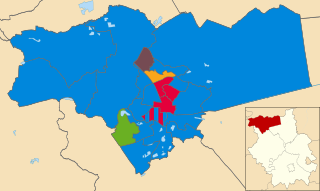
Elections to Peterborough City Council took place on 6 May 2021. 23 of the 60 seats were contested. The election was held alongside the elections for the Cambridgeshire Police and Crime Commissioner and Mayor of Cambridgeshire and Peterborough.
The 2021 Cambridgeshire County Council election took place on 6 May 2021 as part of the 2021 local elections in the United Kingdom. All 61 councillors were elected from 59 electoral divisions, which returned either one or two county councillors each by first-past-the-post voting for a four-year term of office. The election was held alongside a full election for Cambridge City Council, the Cambridgeshire Police and Crime Commissioner, Mayor of Cambridgeshire and Peterborough and one-third of Peterborough City Council.
Elections to Peterborough City Council took place on 5 May 2022. 19 of the 60 seats were contested. The election will took place alongside other local elections across the United Kingdom.
The 1999 Peterborough City Council election took place on 6 May 1999 to elect members of Peterborough City Council in England. This was on the same day as other local elections.
The 2007 Peterborough City Council election took place on 3 May 2007 to elect members of Peterborough City Council in England. This was on the same day as other local elections.
The 2008 Peterborough City Council election took place on 1 May 2008 to elect members of Peterborough City Council in England. This was on the same day as other local elections.
The 2011 Peterborough City Council election took place on 5 May 2011 to elect members of Peterborough City Council in England. This was on the same day as other local elections.