| ||||||||||
All 31 seats to Maldon District Council 16 seats needed for a majority | ||||||||||
---|---|---|---|---|---|---|---|---|---|---|
| ||||||||||
Map showing the results of the 2015 Maldon District Council election |
The 2015 Maldon District Council election took place on 7 May to elect all members of Maldon District Council in Essex, England, the same day as the other 2015 United Kingdom local elections and held simultaneously at the same polling places or via the optional combined return of two postal vote envelopes with the 2015 United Kingdom General Election. [1]
The governing group of Conservative councillors continued to have the same number of representatives with at least across all areas of the district - all bar two councillors are members of this political party as before the election. The Althorne and Southminster two-seat wards returned one other affiliated member each, the latter being a hold by an independent councillor and the former a gain by a member of UKIP (from a Conservative) both thus to co-represent the area in council meetings alongside a Conservative member. A Conservative gain of an independent affiliated seat in the district, one of those for Burnham on Crouch North completed the election in which 24 seats of 26 are held by members of the same governing party.
Party | Seats | Gains | Losses | Net gain/loss | Seats % | Votes % | Votes | +/− | |
---|---|---|---|---|---|---|---|---|---|
Conservative | 28 | 1 | 1 | 0 | 90.3 | 56.5 | 24,257 | +1.9 | |
Independent | 2 | 0 | 1 | 1 | 6.5 | 16.4 | 7,055 | -2.3 | |
UKIP | 1 | 1 | 0 | 1 | 3.2 | 8.1 | 3,477 | +7.0 | |
Labour | 0 | 0 | 0 | 0 | 0 | 10.2 | 4,393 | -4.8 | |
Green | 0 | 0 | 0 | 0 | 0 | 6.5 | 2,775 | -0.2 | |
BNP | 0 | 0 | 0 | 0 | 0 | 1.5 | 642 | -1.6 | |
Liberal Democrats | 0 | 0 | 0 | 0 | 0 | 0.8 | 331 | 0.0 | |
NB: The British National Party candidates stood under the description "Fighting Unsustainable Housing because we care" but were promoted as BNP candidates. [2]
Party | Candidate | Votes | % | ±% | |
---|---|---|---|---|---|
Conservative | Robert Boyce | 1,123 | |||
UKIP | Beverly Acenedo | 856 | |||
Conservative | Anthony Cassen | 754 | |||
Independent | Linda Haywood | 677 | |||
Majority | |||||
Turnout | |||||
Conservative hold | Swing | ||||
UKIP gain from Conservative | Swing | ||||
Party | Candidate | Votes | % | ±% | |
---|---|---|---|---|---|
Conservative | Ronald Pratt | 1,090 | 34.3 | +1.2 | |
Conservative | Peter Elliott | 1,007 | 31.7 | +5.4 | |
Green | Janet Dine | 569 | 17.9 | N/A | |
Labour | Leslie McDonald | 512 | 16.1 | +0.3 | |
Majority | |||||
Turnout | |||||
Conservative hold | Swing | ||||
Party | Candidate | Votes | % | ±% | |
---|---|---|---|---|---|
Conservative | Neil Pudney | 918 | 27.4 | +0.7 | |
Conservative | Helen Elliott | 750 | 22.4 | 0.0 | |
Independent | Wendy Stamp | 564 | 16.8 | N/A | |
Labour | Una Norman | 491 | 14.7 | N/A | |
Independent | Michael Wood | 415 | 12.4 | -21.9 | |
Green | Fiona Hearn | 213 | 6.4 | N/A | |
Majority | |||||
Turnout | |||||
Conservative gain from Independent | Swing | ||||
Conservative hold | Swing | ||||
Party | Candidate | Votes | % | ±% | |
---|---|---|---|---|---|
Conservative | John Keyes | 1,226 | 35.4 | -7.5 | |
Conservative | David Sismey | 932 | 26.9 | -5.6 | |
UKIP | Andrew North | 553 | 16.0 | N/A | |
UKIP | Stephen Cobb | 431 | 12.4 | N/A | |
Green | Robert Graves | 322 | 9.3 | -10.9 | |
Majority | |||||
Turnout | |||||
Conservative hold | Swing | ||||
Party | Candidate | Votes | % | ±% | |
---|---|---|---|---|---|
Conservative | Anne Beale | 1,116 | 31.1 | -16.6 | |
Conservative | Bryan Harker | 938 | 26.2 | -14.5 | |
UKIP | Alan Outlaw | 663 | 18.5 | N/A | |
Labour | Richard Wathen | 397 | 11.1 | N/A | |
Independent | Stephen Jennings | 235 | 6.6 | N/A | |
BNP | Mark Burmby | 235 | 6.6 | -4.8 | |
Majority | |||||
Turnout | |||||
Conservative hold | Swing | ||||
Party | Candidate | Votes | % | ±% | |
---|---|---|---|---|---|
Conservative | Stephen Savage | 534 | 59.0 | +11.3 | |
Labour | Ian Kidman | 371 | 41.0 | -11.0 | |
Majority | |||||
Turnout | |||||
Conservative hold | Swing | ||||
Party | Candidate | Votes | % | ±% | |
---|---|---|---|---|---|
Conservative | Anthony Shrimpton | 1,058 | 31.0 | 0.0 | |
Conservative | Michael Pearlman | 976 | 28.6 | +2.5 | |
Labour | John Sweeney | 504 | 14.8 | -7.4 | |
Green | Robert King | 463 | 13.6 | N/A | |
Labour | John Walker | 407 | 11.9 | N/A | |
Majority | |||||
Turnout | |||||
Conservative hold | Swing | ||||
Party | Candidate | Votes | % | ±% | |
---|---|---|---|---|---|
Conservative | Andrew Cain | 1,017 | 34.9 | -3.1 | |
Conservative | Branda Harker | 1,013 | 34.7 | -4.2 | |
Independent | Martyn Dickinson | 887 | 30.4 | N/A | |
Majority | |||||
Turnout | |||||
Conservative hold | Swing | ||||
Party | Candidate | Votes | % | ±% | |
---|---|---|---|---|---|
Independent | Mark Heard | 1,303 | 40.0 | +16.6 | |
Conservative | Charles Mackenzie | 767 | 23.5 | +0.6 | |
Conservative | Richard Miller | 692 | 21.2 | +2.5 | |
Green | Janet Carden | 498 | 15.3 | +7.8 | |
Majority | |||||
Turnout | |||||
Independent hold | Swing | ||||
Conservative hold | Swing | ||||
Party | Candidate | Votes | % | ±% | |
---|---|---|---|---|---|
Conservative | Penelope Channer | 1,365 | 40.6 | N/A | |
Conservative | Michael Helm | 1,080 | 32.1 | N/A | |
Independent | Jason Stammers | 896 | 26.7 | N/A | |
Majority | |||||
Turnout | |||||
Conservative hold | Swing | ||||
Party | Candidate | Votes | % | ±% | |
---|---|---|---|---|---|
Conservative | John Archer | uncontested | N/A | N/A | |
Conservative | Sue White | uncontested | N/A | N/A | |
Majority | |||||
Turnout | |||||
Conservative hold | Swing | ||||
Party | Candidate | Votes | % | ±% | |
---|---|---|---|---|---|
Conservative | Adrian Fluker | 956 | 33.1 | +5.7 | |
Independent | Brian Beale | 896 | 31.0 | -10.2 | |
Conservative | Auriel Owers | 450 | 15.6 | -3.6 | |
Green | Avril Howe | 306 | 10.7 | N/A | |
Labour | Madeline Diamond | 279 | 9.7 | -2.5 | |
Majority | |||||
Turnout | |||||
Conservative hold | Swing | ||||
Independent hold | Swing | ||||
Party | Candidate | Votes | % | ±% | |
---|---|---|---|---|---|
Conservative | Richard Dewick | 683 | 57.4 | -1.6 | |
UKIP | Timothy Drain | 343 | 28.9 | +3.7 | |
Labour | Norman Hunt | 163 | 13.7 | -2.1 | |
Majority | |||||
Turnout | |||||
Conservative hold | Swing | ||||
Party | Candidate | Votes | % | ±% | |
---|---|---|---|---|---|
Conservative | Andrew St. Joseph | 523 | 48.8 | +0.8 | |
Labour | Stevan Slodzik | 491 | 43.9 | +8.0 | |
Green | Stephen Watson | 104 | 9.3 | -6.8 | |
Majority | |||||
Turnout | |||||
Conservative hold | Swing | ||||
Party | Candidate | Votes | % | ±% | |
---|---|---|---|---|---|
Conservative | Elaine Bamford | 925 | 22.7 | -11.7 | |
Conservative | Madeline Thompson | 876 | 21.5 | -5.6 | |
Independent | Robert Long | 729 | 17.9 | +1.3 | |
UKIP | Gerald Munson | 631 | 15.5 | N/A | |
Liberal Democrats | Jonathan Fairhurst | 331 | 8.1 | N/A | |
Green | Jonathan King | 300 | 7.4 | -3.1 | |
Labour | Robert Jones | 282 | 6.9 | -3.6 | |
Majority | |||||
Turnout | |||||
Conservative hold | Swing | ||||
Party | Candidate | Votes | % | ±% | |
---|---|---|---|---|---|
Conservative | Elaine Bamford | 1,461 | 43.9 | +3.3 | |
Conservative | Madeline Thompson | 1,275 | 38.3 | +0.9 | |
Green | John Denis Le Seve | 595 | 17.9 | +4.6 | |
Majority | |||||
Turnout | |||||
Conservative hold | Swing | ||||
In the context of local authorities in the United Kingdom, no overall control is a situation in which no single political group achieves a majority of seats, analogous to a hung parliament. Of the 248 councils who had members up for election in the 2019 local elections, 73 resulted in a NOC administration. In the 2021 election, 14 resulted in no overall control. The term can still be used for several other countries, such as for two local councils of Malta and the General Assembly of Budapest in Hungary.
Elections to Slough Borough Council were held on 4 May 2006. One third of the council was up for election. This was the 121st Slough general local authority election since Slough became a local government unit in 1863.
Cornwall is administered as a county of South West England whose politics are influenced by a number of issues that make it distinct from the general political scene in the wider United Kingdom, and the political trends of neighbouring counties. Its position on the geographical periphery of the island of Great Britain is also a factor.
Elections to the Borough Council in Slough, England, were held on 3 May 2007. One third of the council was up for election. This was the 122nd Slough general local authority election since Slough became a local government unit in 1863.
The 1999 Craven District Council election took place on 6 May 1999 to elect members of Craven District Council in North Yorkshire, England. One third of the council was up for election and the Conservative Party gained overall control of the council from no overall control.
Elections to Suffolk County Council were held on 4 June 2009 as part of the 2009 United Kingdom local elections on the same day as the elections to the European Parliament. 75 councillors were elected from 63 electoral divisions, which returned either one or two county councillors each by first-past-the-post voting for a four-year term of office. The electoral divisions were the same as those used at the previous election in 2005.
Middlesex County Council under the Local Government Act 1888 had to be returned by local elections every three years. Its first election was in January 1889, the year the council first met. The last was in 1961 as the 1964 elections instead were – as to 83 of 87 divisions – for the larger, in-waiting Greater London Council – 4 divisions went into other counties, on abolition. Three intra-war elections were never announced and formally cancelled but otherwise expected in 1916, 1940 and 1943.
An election to Hampshire County Council took place on 2 May 2013 as part of the 2013 United Kingdom local elections. 78 councillors were elected from 75 electoral divisions, which returned either one or two county councillors each by first-past-the-post voting for a four-year term of office. The electoral divisions were the same as those of the previous election in 2009. No elections were held in Portsmouth and Southampton, which are unitary authorities outside the area covered by the County Council. The election saw the Conservative Party retain overall control of the council, with a reduced majority of five councillors.
Elections to Suffolk County Council took place on 2 May 2013 as part of the 2013 United Kingdom local elections. 75 councillors were elected from 63 electoral divisions, which returned either one or two county councillors each by first-past-the-post voting for a four-year term of office. The electoral divisions were the same as those used at the previous election in 2009.
The by-thirds 2015 Rotherham Metropolitan Borough Council election took place on Thursday 7 May 2015, to elect approximately one third of the members of the Rotherham Metropolitan Borough Council in England as part of the 2015 United Kingdom local elections held on the same day as the general election. All seats contested at this election were last contested in 2011, and of these, 20 were held by Labour Party councillors.
Elections to elect all members of the North West Leicestershire District Council took place on 7 May 2015, simultaneously with a general election, held as one of the English local elections of that year.
The 2015 Mid Suffolk District Council election took place on the 7 May 2015 to elect members of Mid Suffolk District Council in England. It was held on same day as many UK local elections and the general election.
The 2015 Harlow District Council election took place on 7 May 2015 to elect members of Harlow District Council in Essex, England. One third of the council was up for election and Labour Party councillors increased their control of the council as the governing group, gaining one councillor and suffering no losses.
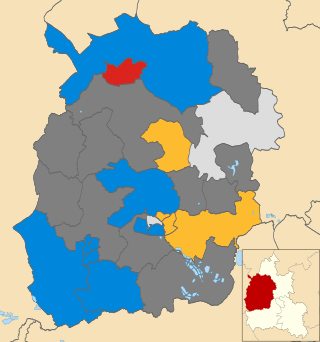
The 2003 West Oxfordshire District Council election took place on 1 May 2003 to elect members of West Oxfordshire District Council in Oxfordshire, England. One third of the council was up for election and the Conservative Party stayed in overall control of the council.
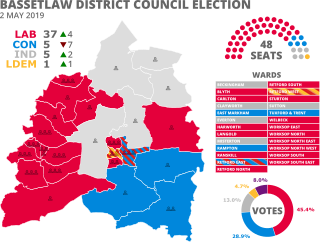
The 2019 Bassetlaw District Council election took place on 2 May 2019 to elect all 48 members of Bassetlaw District Council in England. This was on the same day as other local elections.
The 2022 United Kingdom local elections took place on Thursday 5 May 2022. These included elections for all London borough councils, for all local authorities in Wales and Scotland. Most seats in England were last up for election in 2018 and in Scotland and Wales in 2017. The elections coincided with the 2022 Northern Ireland Assembly election. In 91 cases, most of them in Wales, council seats were uncontested, each having only one candidate. Three seats in Scotland remained unfilled as no one nominated to fill them.
The 2022 Scottish local elections were held on 5 May 2022, as part of the 2022 United Kingdom local elections. All 1,227 seats across all 32 Scottish local authorities were up for election and voter turnout was 44.8%.
The 2022 Havering London Borough Council election was held on 5 May 2022 to elect all 55 members of Havering London Borough Council. The elections took place alongside local elections in the other London boroughs and elections to local authorities across the United Kingdom.
The 2022 Bury Metropolitan Borough Council election took place on 5 May 2022. Due to boundary changes, all 51 councillors were elected at the same time. The election took place alongside other local elections across the United Kingdom.
This is a list of elections in the United Kingdom scheduled to be held in 2022. Included are local elections, by-elections on any level, referendums and internal party elections.