| ||||||||||||||||||||||||||||||||||||||||||||||||||||||||||||||||||||||||||||||||||||||||||||||||
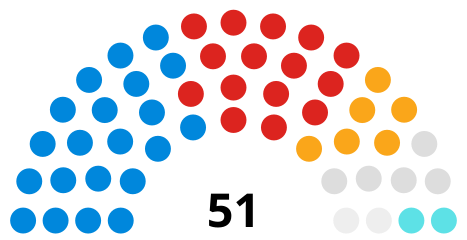
17 of the 51 seats to Southend-on-Sea City Council 26 seats needed for a majority | ||||||||||||||||||||||||||||||||||||||||||||||||||||||||||||||||||||||||||||||||||||||||||||||||
---|---|---|---|---|---|---|---|---|---|---|---|---|---|---|---|---|---|---|---|---|---|---|---|---|---|---|---|---|---|---|---|---|---|---|---|---|---|---|---|---|---|---|---|---|---|---|---|---|---|---|---|---|---|---|---|---|---|---|---|---|---|---|---|---|---|---|---|---|---|---|---|---|---|---|---|---|---|---|---|---|---|---|---|---|---|---|---|---|---|---|---|---|---|---|---|---|
| ||||||||||||||||||||||||||||||||||||||||||||||||||||||||||||||||||||||||||||||||||||||||||||||||
Winner of each seat at the 2023 Southend-on-Sea City Council election | ||||||||||||||||||||||||||||||||||||||||||||||||||||||||||||||||||||||||||||||||||||||||||||||||
|
The 2023 Southend-on-Sea City Council election was held on 4 May 2023 to elect members of Southend-on-Sea City Council in England. It coincided with local elections across the United Kingdom.
The council is elected by thirds, so a single member will be elected from all 17 wards to a term of four years. The seats elected at this election were last contested in 2019. [3]
Prior to the election the council was under no overall control, being run by a Labour, Liberal Democrat and independent coalition. Following the election the council remained under no overall control, but the Conservatives were able to form a minority administration with support from some of the independent councillors. [4]
In the 2022 election, the Conservative Party and the Independents lost seats while Labour and the Liberal Democrats gained seats. [5] While the Conservative were the largest party, the council was run by a Labour-led coalition along with the Liberal Democrats and Independents. Since then one Labour and one Independent councillor left their groups and formed a new group called Residents First. [6]
After 2022 election [7] | Before 2023 election [8] | ||||
---|---|---|---|---|---|
Party | Seats | Party | Seats | ||
Conservative | 21 | Conservative | 21 | ||
Labour | 16 | Labour [note 1] | 15 | ||
Liberal Democrats | 6 | Liberal Democrats | 6 | ||
Independent | 6 | Independent | 5 | ||
Non-aligned | 2 | Non-aligned | 2 | ||
Residents First | 2 |
2023 Southend-on-Sea City Council election | ||||||||||
---|---|---|---|---|---|---|---|---|---|---|
Party | This election | Full council | This election | |||||||
Seats | Net | Seats % | Other | Total | Total % | Votes | Votes % | +/− | ||
Conservative | 5 | 29.4 | 17 | 22 | 43.1 | 13,305 | 33.2 | –5.0 | ||
Labour | 7 | 2 | 41.2 | 10 | 17 | 33.3 | 11,487 | 28.7 | –1.7 | |
Independent | 3 | 1 | 17.6 | 4 | 7 | 13.7 | 4,928 | 12.3 | +3.9 | |
Liberal Democrats | 1 | 2 | 5.9 | 3 | 4 | 7.9 | 5,298 | 13.2 | ±0.0 | |
Green | 1 | 1 | 5.9 | 0 | 1 | 2.0 | 3,653 | 9.1 | +1.7 | |
Confelicity | 0 | 0.0 | 0 | 0 | 0.0 | 1,159 | 2.9 | +1.1 | ||
Heritage | 0 | 0.0 | 0 | 0 | 0.0 | 140 | 0.3 | N/A | ||
British Democratic | 0 | 0.0 | 0 | 0 | 0.0 | 42 | 0.1 | N/A | ||
Psychedelic Future | 0 | 0.0 | 0 | 0 | 0.0 | 13 | <0.1 | N/A | ||
Results of the City Council election were released by Southend-on-Sea City Council on 5th May 2023. [9]
Seat changes are compared to the 2019 election and do not take into account interim changes due to by-elections or defections.
Party | Candidate | Votes | % | ±% | |
---|---|---|---|---|---|
Independent | Stephen Aylen | 1,195 | 45.0 | +5.3 | |
Conservative | Lesley Salter* | 883 | 33.3 | –7.2 | |
Labour | Joe Cresswell | 293 | 11.0 | –0.3 | |
Green | Nathaniel Love | 147 | 5.5 | +1.9 | |
Liberal Democrats | Alan Crystall | 116 | 4.4 | –0.3 | |
Confelicity | Elizabeth Smith | 21 | 0.8 | +0.6 | |
Majority | 312 | 11.7 | N/A | ||
Turnout | 2,667 | 36.3 | |||
Registered electors | 7,353 | ||||
Independent gain from Conservative | Swing | 6.3 | |||
Party | Candidate | Votes | % | ±% | |
---|---|---|---|---|---|
Labour Co-op | Donna Richardson | 878 | 34.1 | –10.2 | |
Conservative | Bernard Arscott | 716 | 27.8 | –11.9 | |
Independent | Keith Evans* | 704 | 27.4 | N/A | |
Green | AJ Sutherland | 167 | 6.5 | +1.5 | |
Liberal Democrats | Joyce Onstad | 82 | 3.2 | –2.6 | |
Confelicity | Stan Evans-Jack | 26 | 1.0 | –0.1 | |
Majority | 162 | 6.3 | +1.7 | ||
Turnout | 2,583 | 31.9 | |||
Registered electors | 8,097 | ||||
Labour Co-op gain from Independent | Swing | 0.9 | |||
Party | Candidate | Votes | % | ±% | |
---|---|---|---|---|---|
Conservative | Stephen Habermel* | 1,147 | 47.5 | +2.7 | |
Labour | David Carrington | 762 | 31.6 | +1.9 | |
Green | James Vessey-Miller | 241 | 10.0 | +2.6 | |
Liberal Democrats | Christopher Hind | 189 | 7.8 | –4.3 | |
Confelicity | Linzi Arkus-Binder | 75 | 3.1 | +1.0 | |
Majority | 385 | 15.9 | +0.8 | ||
Turnout | 2,421 | 34.0 | |||
Registered electors | 7,131 | ||||
Conservative hold | Swing | 0.4 | |||
Party | Candidate | Votes | % | ±% | |
---|---|---|---|---|---|
Liberal Democrats | Paul Collins* | 1,786 | 67.7 | +21.7 | |
Conservative | Judith McMahon | 626 | 23.7 | –20.3 | |
Labour | Jennifer Lewis | 133 | 5.0 | –1.5 | |
Green | RJ Learmouth | 54 | 2.0 | ±0.0 | |
Confelicity | Simon Spooner | 40 | 1.5 | ±0.0 | |
Majority | 1,160 | 44.0 | +42.0 | ||
Turnout | 2,646 | 35.9 | |||
Registered electors | 7,371 | ||||
Liberal Democrats hold | Swing | 21.0 | |||
Party | Candidate | Votes | % | ±% | |
---|---|---|---|---|---|
Labour Co-op | Gabriel Leroy | 886 | 54.9 | –7.7 | |
Conservative | Andrew Brookes | 348 | 21.5 | –1.8 | |
Green | Thomas Love | 134 | 8.3 | +1.8 | |
Confelicity | Lee Clark | 90 | 5.6 | +1.6 | |
Liberal Democrats | Rory Windass | 80 | 5.0 | +1.4 | |
British Democratic | Stephen Smith | 42 | 2.6 | N/A | |
Heritage | Lara Hurley | 35 | 2.2 | N/A | |
Majority | 538 | 33.4 | –5.9 | ||
Turnout | 1,621 | 20.5 | |||
Registered electors | 7,907 | ||||
Labour Co-op hold | Swing | 3.0 | |||
Party | Candidate | Votes | % | ±% | |
---|---|---|---|---|---|
Green | Richard Longstaff | 1,042 | 39.1 | +17.6 | |
Liberal Democrats | Syrie Cox | 835 | 31.4 | –9.5 | |
Conservative | Craig Watts | 501 | 18.8 | –6.4 | |
Labour | Mick Ekers | 236 | 8.9 | –2.6 | |
Confelicity | James Miller | 36 | 1.4 | +0.5 | |
Psychedelic Future | Jason Pilley | 13 | 0.5 | N/A | |
Majority | 207 | 7.7 | N/A | ||
Turnout | 2,671 | 36.2 | |||
Registered electors | 7,379 | ||||
Green gain from Liberal Democrats | Swing | 13.6 | |||
Party | Candidate | Votes | % | ±% | |
---|---|---|---|---|---|
Labour | Cheryl Nevin | 1,137 | 51.1 | –2.9 | |
Conservative | Marco Mann | 538 | 24.2 | –4.0 | |
Green | Sarah-Ann Patel | 222 | 10.0 | ±0.0 | |
Liberal Democrats | Robert Howes | 143 | 6.4 | +1.4 | |
Heritage | Bianca Isherwood | 105 | 4.7 | N/A | |
Confelicity | Dee Curtis | 82 | 3.7 | +1.0 | |
Majority | 599 | 26.9 | +1.1 | ||
Turnout | 2,236 | 27.6 | |||
Registered electors | 8,104 | ||||
Labour hold | Swing | 0.6 | |||
Party | Candidate | Votes | % | ±% | |
---|---|---|---|---|---|
Conservative | Meg Davidson* | 1,161 | 43.6 | –10.6 | |
Labour Co-op | Shahid Nadeem | 998 | 37.5 | +13.2 | |
Liberal Democrats | David Webb | 251 | 9.4 | –2.8 | |
Green | Jon Mullett | 146 | 5.5 | –2.0 | |
Confelicity | Simon Jones | 107 | 4.0 | +2.1 | |
Majority | 163 | 6.1 | –23.8 | ||
Turnout | 2,671 | 34.3 | |||
Registered electors | 7,787 | ||||
Conservative hold | Swing | 11.9 | |||
Party | Candidate | Votes | % | ±% | |
---|---|---|---|---|---|
Independent | Steven Wakefield* | 885 | 38.7 | N/A | |
Conservative | Steve Harvey | 802 | 35.1 | –0.8 | |
Labour | Ian Pope | 376 | 16.5 | –1.1 | |
Green | Fiona Clapperton | 119 | 5.2 | +0.2 | |
Liberal Democrats | Granville Stride | 58 | 2.5 | +0.5 | |
Confelicity | Kayleigh Burgess | 45 | 2.0 | +0.5 | |
Majority | 83 | 3.6 | N/A | ||
Turnout | 2,292 | 26.7 | |||
Registered electors | 8,584 | ||||
Independent hold | Swing | N/A | |||
Party | Candidate | Votes | % | ±% | |
---|---|---|---|---|---|
Conservative | Colin Campbell | 1,138 | 51.8 | –10.3 | |
Independent | Maggie Kelly | 368 | 16.8 | N/A | |
Labour | Gray Sergeant | 353 | 16.1 | –3.1 | |
Green | Jo Bates | 154 | 7.0 | –1.6 | |
Confelicity | Dean Harris-Eckett | 93 | 4.2 | +1.3 | |
Liberal Democrats | Pamela Austin | 91 | 4.1 | –3.1 | |
Majority | 770 | 35.0 | –7.9 | ||
Turnout | 2,200 | 29.8 | |||
Registered electors | 7,382 | ||||
Conservative hold | Swing | N/A | |||
Party | Candidate | Votes | % | ±% | |
---|---|---|---|---|---|
Labour Co-op | Daniel Cowan* | 1,308 | 53.6 | +5.7 | |
Conservative | Cheryll Gardiner | 869 | 35.6 | –3.5 | |
Liberal Democrats | Dave Poulton | 125 | 5.1 | –2.5 | |
Green | Eli London | 87 | 3.6 | ±0.0 | |
Confelicity | Gail Robertson | 53 | 2.2 | +0.3 | |
Majority | 439 | 18.0 | +9.2 | ||
Turnout | 2,448 | 30.9 | |||
Registered electors | 7,922 | ||||
Labour Co-op hold | Swing | 4.6 | |||
Party | Candidate | Votes | % | ±% | |
---|---|---|---|---|---|
Labour | Martin Berry | 975 | 48.7 | +4.2 | |
Conservative | Tamkeen Shaikh | 438 | 21.9 | –6.2 | |
Independent | Brian Ayling | 231 | 11.5 | –1.5 | |
Green | Tilly Hogrebe | 179 | 8.9 | +2.2 | |
Confelicity | Jolene Hills | 102 | 5.1 | +2.2 | |
Liberal Democrats | Billy Boulton | 79 | 3.9 | +1.0 | |
Majority | 537 | 26.8 | +10.8 | ||
Turnout | 2,014 | 25.1 | |||
Registered electors | 8,014 | ||||
Labour gain from Independent | Swing | 5.2 | |||
Party | Candidate | Votes | % | ±% | |
---|---|---|---|---|---|
Independent | Ron Woodley* | 1,108 | 36.2 | N/A | |
Conservative | Ken Davidson | 867 | 28.3 | –11.3 | |
Independent | Andrew Hall | 437 | 14.3 | N/A | |
Labour | Sam Allen | 377 | 12.3 | +0.7 | |
Green | Julie Callow | 152 | 5.0 | –0.6 | |
Liberal Democrats | Katie Kurilecz | 62 | 2.0 | –0.1 | |
Confelicity | Melissa Aylott | 59 | 1.9 | +0.3 | |
Majority | 241 | 7.9 | N/A | ||
Turnout | 2,978 | 41.1 | |||
Registered electors | 7,246 | ||||
Independent hold | Swing | N/A | |||
Party | Candidate | Votes | % | ±% | |
---|---|---|---|---|---|
Labour | Mandy O'Connor | 1,067 | 59.6 | –0.6 | |
Conservative | Bob Carr | 349 | 19.5 | –2.9 | |
Green | Peter Walker | 175 | 9.8 | +0.1 | |
Liberal Democrats | Philip Edey | 116 | 6.5 | +1.0 | |
Confelicity | Jonathan Humphreys | 84 | 4.7 | +2.6 | |
Majority | 718 | 40.1 | N/A | ||
Turnout | 1,801 | 19.8 | |||
Registered electors | 9,096 | ||||
Labour hold | Swing | 1.2 | |||
Party | Candidate | Votes | % | ±% | |
---|---|---|---|---|---|
Conservative | Owen Cartey | 1,317 | 47.1 | –0.5 | |
Liberal Democrats | Stephen Cummins | 965 | 34.5 | –5.3 | |
Green | Stephanie Golder | 231 | 8.3 | +2.0 | |
Labour | Carrie Druce | 219 | 7.8 | +2.3 | |
Confelicity | Janes Wilkes | 64 | 2.3 | +1.5 | |
Majority | 352 | 12.6 | +4.8 | ||
Turnout | 2,804 | 39.2 | |||
Registered electors | 7,153 | ||||
Conservative gain from Liberal Democrats | Swing | 2.4 | |||
Party | Candidate | Votes | % | ±% | |
---|---|---|---|---|---|
Conservative | Tony Cox* | 1,268 | 58.3 | ±0.0 | |
Labour | Muhammad Ibrahim | 451 | 20.7 | –1.4 | |
Green | Lea Williams | 186 | 8.6 | +0.8 | |
Liberal Democrats | Richard Collins | 163 | 7.5 | +0.3 | |
Confelicity | Michael Arkus-Binder | 107 | 4.9 | +0.3 | |
Majority | 817 | 37.6 | +1.4 | ||
Turnout | 2,183 | 29.8 | |||
Registered electors | 7,326 | ||||
Conservative hold | Swing | 0.7 | |||
Party | Candidate | Votes | % | ±% | |
---|---|---|---|---|---|
Labour | Anne Jones | 1,038 | 56.9 | –5.3 | |
Conservative | Andy Wilkins | 337 | 18.5 | –0.5 | |
Green | Stephen Jordan | 217 | 11.9 | +3.7 | |
Liberal Democrats | Suzanna Edey | 157 | 8.6 | –0.7 | |
Confelicity | Connor Bines | 75 | 4.1 | +2.7 | |
Majority | 701 | 38.4 | –4.8 | ||
Turnout | 1,830 | 24.0 | |||
Registered electors | 7,625 | ||||
Labour hold | Swing | 2.4 | |||
Aberdeen City Council is the local government authority for the city of Aberdeen, Scotland. It was created in 1996, under the Local Government etc. (Scotland) Act 1994, though a sense of Aberdeen as a city, with its own city council, can be traced back to 1900, when the county of the city of Aberdeen was created.
The Metropolitan Borough of Wirral is a metropolitan borough of Merseyside, in North West England. It has a population of 320,600 (2021), and encompasses 62.1 square miles (160.9 km2) of the northern part of the Wirral Peninsula. Major settlements include Birkenhead, Wallasey, Bebington, Heswall, Hoylake and West Kirby. The city of Liverpool faces the northeastern side of Wirral over the Mersey.
Stockport Metropolitan Borough Council (SMBC) is the local authority for the Metropolitan Borough of Stockport, Greater Manchester, England. The council is currently run by a Liberal Democrat minority administration. At the 2023 local elections, the Liberal Democrats gained two more seats, increasing their lead over the Labour Party to six seats, and retaining minority control. This lead is now five seats after one of the Liberal Democrats’ councillors resigned the whip, days after being re-elected. The Liberal Democrats currently have 29 seats, Labour 24, and the Heald Green Ratepayers, Greens and the Edgeley Community Association each holding 3. There is 1 independent.
The 1999 Southend-on-Sea Council election took place on 6 May 1999 to elect members of Southend-on-Sea Unitary Council in Essex, England. One third of the council was up for election and the council stayed under no overall control.
The 2000 Southend-on-Sea Council election took place on 4 May 2000 to elect members of Southend-on-Sea Unitary Council in Essex, England. One third of the council was up for election and the Conservative party gained overall control of the council from no overall control.
The 2004 Southend-on-Sea Council election took place on 10 June 2004 to elect members of Southend-on-Sea Unitary Council in Essex, England. One third of the council was up for election and the Conservative party stayed in overall control of the council.
The 2006 Southend-on-Sea Council election took place on 4 May 2006 to elect members of Southend-on-Sea Unitary Council in Essex, England. One third of the council was up for election and the Conservative party stayed in overall control of the council.
The 2007 Southend-on-Sea Council election took place on 3 May 2007 to elect members of Southend-on-Sea Unitary Council in Essex, England. One third of the council was up for election and the Conservative party stayed in overall control of the council.
The 2008 Southend-on-Sea Council election took place on 1 May 2008 to elect members of Southend-on-Sea Unitary Council in Essex, England. One third of the council was up for election and the Conservative party stayed in overall control of the council.
The 2007 Sunderland Council election took place on 3 May 2007 to elect members of Sunderland Metropolitan Borough Council in Tyne and Wear, England. One third of the council was up for election and the Labour Party stayed in overall control of the council.
The 2010 Sunderland Council election took place on 6 May 2010 to elect members of Sunderland Metropolitan Borough Council in Tyne and Wear, England. One third of the council was up for election and the Labour Party stayed in overall control of the council. The election took place on the same day as the 2010 General Election.
The 2007 Redcar and Cleveland Borough Council election took place on 3 May 2007 to elect members of Redcar and Cleveland Unitary Council in England. The whole council was up for election and the council stayed under no overall control.
Southend-on-Sea City Council is the local authority of the Southend-on-Sea district in Essex, England. It is a unitary authority, having the powers of a non-metropolitan county and district council combined. It is a member of the East of England Local Government Association. It is based at Southend Civic Centre in Southend-on-Sea.
An election to Essex County Council took place on 2 May 2013 as part of the 2013 United Kingdom local elections. 75 councillors were elected from 70 electoral divisions, which returned either one or two county councillors each by first-past-the-post voting for a four-year term of office. The electoral divisions were the same as those used at the previous election in 2009. No elections were held in Thurrock or Southend-on-Sea, which are unitary authorities outside the area covered by the County Council.
The 2021 Oxfordshire County Council election took place on 6 May 2021 alongside the other local elections. All 63 seats of the Oxfordshire County Council were contested. The council is composed of 61 divisions, each electing either one or two councillors, all elected by FPTP.
Elections to the City of Edinburgh Council took place on 5 May 2022 on the same day as the 31 other Scottish local government elections. As with other Scottish council elections, it was held using single transferable vote (STV) – a form of proportional representation – in which multiple candidates are elected in each ward and voters rank candidates in order of preference.
Elections to Aberdeen City Council took place on 5 May 2022 on the same day as the 31 other Scottish local government elections. As with other Scottish council elections, it was held using single transferable vote (STV) – a form of proportional representation – in which multiple candidates are elected in each ward and voters rank candidates in order of preference.
The 2023 Bournemouth, Christchurch and Poole Council election took place on 4 May, 2023, to elect all 76 members of Bournemouth, Christchurch and Poole Council in Dorset, England.
The 2023 Colchester City Council election took place on 4 May 2023 to elect members of Colchester City Council in Essex, England. This was on the same day as other local elections across England. There were 17 of the 51 seats on the council up for election, being the usual third of the council, with one seat available for each ward. This set of seats were last contested at the 2019 election.