| ||||||||||||||||||||||||||||||||||||||||||||||||||||||||||||||||||||
All 34 seats to Derbyshire Dales District Council 18 seats needed for a majority | ||||||||||||||||||||||||||||||||||||||||||||||||||||||||||||||||||||
---|---|---|---|---|---|---|---|---|---|---|---|---|---|---|---|---|---|---|---|---|---|---|---|---|---|---|---|---|---|---|---|---|---|---|---|---|---|---|---|---|---|---|---|---|---|---|---|---|---|---|---|---|---|---|---|---|---|---|---|---|---|---|---|---|---|---|---|---|
| ||||||||||||||||||||||||||||||||||||||||||||||||||||||||||||||||||||
Map showing the composition of Derbyshire Dales District Council following the election. Striped wards have mixed representation. | ||||||||||||||||||||||||||||||||||||||||||||||||||||||||||||||||||||
|
The 2023 Derbyshire Dales District Council election was held on 4 May 2023 to elect all 34 councillors for Derbyshire Dales District Council. This was on the same day as other local elections.
For the first time since 1995, the Conservative Party failed to win a majority of seats. Instead, the Liberal Democrats won the largest number of seats, beating the Conservatives by one seat, the same margin as in 1995, but again failing to win a majority of their own. [2]
This was the first election to the Derbyshire Dales District Council to be held under the current ward boundaries. The total number of councillors was reduced from 39 to 34, and the total number of wards was reduced from 25 to 21. Consequently, the boundaries of most of the wards were different compared to those which had been in use since the 2003 election. The arrangements for each new ward are described below. [3]
Prior to the election the council was under no overall control, with the majority held by the Conservatives following the 2019 election having been lost through defections and resignations. Less than two months before the election the Conservative leader, Garry Purdy, who had led the council since 2019, was suspended and then resigned over private promises made to a local tourist attraction. Susan Hobson took over as Conservative leader and became acting leader of the council, with formal appointment of a new leader of the council deferred until after the election. [4] Immediately before the election the council was being run by a coalition comprising the Conservatives, the SDP councillor and three of the independent councillors. [5]
A "progressive alliance" coalition of the Liberal Democrats, Labour and Greens subsequently formed to take control of the council, with Liberal Democrat group leader Steve Flitter being appointed leader of the council at the annual council meeting on 25 May 2023. [6] [7]
In the instance in which the boundaries of a ward are identical to those in the 2019 election, the percentage changes have been calculated relative to the results in that ward from 2019. In the instance in which a ward is broadly coterminous with a previous ward or has only been slightly expanded, the percentage change is calculated in the same way from the corresponding ward in 2019, but in these instances this value is only indicative and some changes to party political support will be a result of the boundary changes. The results in each ward were as follows: [8] [9]
Ashbourne North was still represented by two councillors and was slightly expanded.
Party | Candidate | Votes | % | ±% | |
---|---|---|---|---|---|
Liberal Democrats | Peter Dobbs | 653 | 46.9 | 16.6 | |
Conservative | Stuart Lees | 575 | 41.3 | 6.8 | |
Conservative | Sue Bull | 561 | 40.3 | 8.2 | |
Liberal Democrats | Monty Stuart-Monteith | 528 | 37.9 | 13.3 | |
Labour | Eileen Ashley | 246 | 17.7 | 0.8 | |
Majority | 14 | 0.5 | |||
Turnout | 1,393 | 41 | |||
Liberal Democrats gain from Conservative | Swing | 12.0 | |||
Conservative hold | Swing | ||||
Ashbourne South was now represented by three councillors instead of two and was expanded.
Party | Candidate | Votes | % | ±% | |
---|---|---|---|---|---|
Liberal Democrats | Rob Archer | 1,101 | 52.5 | 13.5 | |
Liberal Democrats | Nick Wilton | 884 | 42.1 | New | |
Conservative | Anthony Bates | 857 | 40.8 | 2.5 | |
Conservative | Tom Donnelly | 820 | 39.1 | 1.7 | |
Liberal Democrats | Robin Shirtcliffe | 794 | 37.8 | 5.4 | |
Conservative | Matthew Taylor | 697 | 33.2 | New | |
Labour | Matt Ginnis | 453 | 21.6 | 9.9 | |
Majority | 37 | 0.7 | |||
Turnout | 2,099 | 39 | |||
Liberal Democrats hold | Swing | 6.2 | |||
Liberal Democrats gain from Conservative | Swing | ||||
Conservative win |
Bakewell was now represented by two councillors instead of three but remained geographically the same.
Party | Candidate | Votes | % | ±% | |
---|---|---|---|---|---|
Conservative | Mark Wakeman | 1,011 | 61.2 | 5.8 | |
Conservative | Gareth Gee | 581 | 35.2 | 31.2 | |
Labour | Ben Carter | 526 | 31.9 | 1.5 | |
Green | Nicola Peltell | 307 | 18.6 | New | |
Liberal Democrats | Robert Court | 178 | 10.8 | New | |
Independent | Rachel Elnaugh-Love | 175 | 10.6 | New | |
Liberal Democrats | Patricia Wildgoose | 166 | 10.1 | New | |
Majority | 55 | 1.9 | |||
Turnout | 1,651 | 47 | |||
Conservative hold | Swing | 9.2 | |||
Conservative hold | Swing | ||||
Bonsall and Winster was a new ward which was to be represented by one councillor. It was broadly coterminous with the old ward of Winster and South Darley, which was also represented by one councillor.
Party | Candidate | Votes | % | ±% | |
---|---|---|---|---|---|
Green | Matthew Buckler | 578 | 69.4 | New | |
Conservative | Chris Stait | 255 | 30.6 | New | |
Majority | 323 | 38.8 | |||
Turnout | 833 | 44 | |||
Green gain from Independent | Swing | 83.3 | |||
Bradwell was still represented by one councillor and was slightly expanded.
Party | Candidate | Votes | % | ±% | |
---|---|---|---|---|---|
Labour | Andy Nash | 506 | 73.8 | 31.2 | |
Conservative | Chloe Sinker | 180 | 26.2 | 31.2 | |
Majority | 326 | 47.5 | |||
Turnout | 686 | 44 | |||
Labour gain from Conservative | Swing | 31.2 | |||
Brailsford was still represented by one councillor and was geographically the same.
Party | Candidate | Votes | % | ±% | |
---|---|---|---|---|---|
Conservative | Geoff Bond | 379 | 57.3 | 22.6 | |
Green | Morgan Bryan | 117 | 17.7 | New | |
Labour | Fraser McGuire | 100 | 15.1 | 5.0 | |
Liberal Democrats | Midge Dobbs | 66 | 10.0 | New | |
Majority | 262 | 39.6 | |||
Turnout | 662 | 39 | |||
Conservative hold | Swing | 20.2 | |||
Calver and Longstone was a new ward which is to be represented by one councillor. It was predominantly formed of parishes from the old wards of Calver, and Litton and Longstone.
Party | Candidate | Votes | % | ±% | |
---|---|---|---|---|---|
Green | Kelda Boothroyd | 441 | 54.6 | ||
Conservative | Helen Froggatt | 367 | 45.4 | ||
Majority | 74 | 9.2 | |||
Turnout | 808 | 45 | |||
Green win |
Chatsworth was still represented by one councillor and was slightly expanded.
Party | Candidate | Votes | % | ±% | |
---|---|---|---|---|---|
Conservative | Susan Hobson | 458 | 62.0 | 12.0 | |
Liberal Democrats | Claire Cadogan | 170 | 23.0 | 6.8 | |
Green | John Ward | 111 | 15.0 | New | |
Majority | 288 | 39.0 | |||
Turnout | 739 | 43 | |||
Conservative hold | Swing | 9.4 | |||
Cromford and Matlock Bath was a new ward which is to be represented by one councillor. It was predominantly formed of parishes from the old ward of Masson.
Party | Candidate | Votes | % | ±% | |
---|---|---|---|---|---|
Labour | Nick Whitehead | 448 | 68.8 | ||
Conservative | Joseph Pearce | 203 | 31.2 | ||
Majority | 245 | 37.6 | |||
Turnout | 651 | 39 | |||
Labour win |
Darley Dale was still represented by three councillors and was slightly expanded.
Party | Candidate | Votes | % | ±% | |
---|---|---|---|---|---|
Liberal Democrats | David Burton | 1,104 | 54.7 | 29.9 | |
Liberal Democrats | Marilyn Franks | 917 | 45.4 | 23.8 | |
Liberal Democrats | Rodger Shelley | 761 | 37.7 | 23.8 | |
Conservative | Ann Elliott | 642 | 31.8 | 11.7 | |
Conservative | Dave Oakley | 609 | 30.1 | 9.4 | |
Labour | Sarah Halliwell | 555 | 27.5 | 8.8 | |
Conservative | Richard Walsh | 461 | 22.8 | 14.8 | |
Independent | Andrew Statham | 291 | 14.4 | New | |
Majority | 119 | 2.2 | |||
Turnout | 2,020 | 42 | |||
Liberal Democrats gain from Conservative | Swing | 21.3 | |||
Liberal Democrats gain from Conservative | Swing | ||||
Dovedale, Parwich and Brassington was a new ward which was to be represented by one councillor. It was broadly coterminous with the old ward of Dovedale and Parwich, which was also represented by one councillor.
Party | Candidate | Votes | % | ±% | |
---|---|---|---|---|---|
Conservative | Nigel Walker | 464 | 57.8 | 15.9 | |
Labour | Kevin Welsh | 120 | 14.9 | 2.2 | |
Green | Richard Rowlatt | 119 | 14.8 | New | |
Liberal Democrats | Henry Jebb | 100 | 12.5 | 1.1 | |
Majority | 344 | 42.8 | |||
Turnout | 803 | 44 | |||
Conservative hold | Swing | 9.1 | |||
Doveridge and Sudbury was still represented by one councillor and was geographically the same.
Party | Candidate | Votes | % | ±% | |
---|---|---|---|---|---|
Conservative | John Bointon | 458 | 58.0 | 20.7 | |
Independent | Jacqueline Allison | 331 | 42.0 | 11.8 | |
Majority | |||||
Turnout | 789 | 44 | |||
Conservative gain from Independent | Swing | 16.3 | |||
Hartington and Taddington was still represented by one councillor and was slightly expanded.
Party | Candidate | Votes | % | ±% | |
---|---|---|---|---|---|
Conservative | David Chapman | 391 | 62.7 | 2.9 | |
Liberal Democrats | Eleanor Nancolas | 117 | 18.8 | 6.2 | |
Green | Catherine Handy | 116 | 18.6 | 1.6 | |
Majority | 274 | 43.9 | |||
Turnout | 624 | 37 | |||
Conservative hold | Swing | 1.7 | |||
Hathersage was a new ward which was to be represented by two councillors. It is broadly coterminous with the old ward of Hathersage and Eyam, which was also represented by two councillors.
Party | Candidate | Votes | % | ±% | |
---|---|---|---|---|---|
Independent | Peter O'Brien | 1,387 | 76.0 | 34.7 | |
Labour | Simon Ripton | 1,092 | 59.8 | 20.9 | |
Conservative | Jason Atkin | 420 | 23.0 | 15.6 | |
Conservative | Steve Bull | 335 | 18.4 | 15.4 | |
Majority | 672 | 20.8 | |||
Turnout | 1,825 | 53 | |||
Independent gain from Labour | Swing | 26.6 | |||
Labour hold | Swing | ||||
Hulland was still represented by one councillor and was slightly redrawn.
Party | Candidate | Votes | % | ±% | |
---|---|---|---|---|---|
Conservative | Dermot Murphy | 395 | 51.4 | 28.8 | |
Labour | Diane Fletcher | 148 | 19.3 | 0.5 | |
SDP | Richard Bright | 145 | 18.9 | New | |
Liberal Democrats | Barbara Bowman | 80 | 10.4 | New | |
Majority | 247 | 32.1 | |||
Turnout | 768 | 44 | |||
Conservative hold | Swing | 14.2 | |||
Matlock East and Tansley was a new ward which was to be represented by three councillors. It was broadly coterminous with the old ward of Matlock St. Giles, which was also represented by three councillors.
Party | Candidate | Votes | % | ±% | |
---|---|---|---|---|---|
Liberal Democrats | Stephen Flitter | 1,215 | 67.7 | 14.7 | |
Liberal Democrats | Joanne Linthwaite | 1,083 | 60.4 | 16.2 | |
Liberal Democrats | David Hughes | 1,074 | 59.9 | 19.9 | |
Labour | Suqie Banwait | 477 | 26.6 | 5.3 | |
Conservative | Danny Hopkinson | 476 | 26.5 | 1.6 | |
Majority | 597 | 13.8 | |||
Turnout | 1,794 | 39 | |||
Liberal Democrats hold | Swing | 20.0 | |||
Liberal Democrats hold | Swing | ||||
Matlock West was a new ward which was to be represented by three councillors. It was broadly coterminous with the old ward of Matlock All Saints, which was also represented by three councillors.
Party | Candidate | Votes | % | ±% | |
---|---|---|---|---|---|
Liberal Democrats | Sue Burfoot | 1,665 | 78.6 | 9.9 | |
Liberal Democrats | Martin Burfoot | 1,526 | 72.0 | 10.0 | |
Liberal Democrats | Steve Wain | 1,471 | 69.5 | 14.0 | |
Labour | John Weir | 422 | 19.9 | 1.7 | |
Conservative | Rosemary Oakley | 323 | 15.3 | 10.5 | |
Conservative | Thomas Pearce | 263 | 12.4 | 3.5 | |
Conservative | Harvey Griffin | 258 | 12.2 | New | |
Majority | 1,049 | 17.7 | |||
Turnout | 2,118 | 46 | |||
Liberal Democrats hold | Swing | 4.6 | |||
Liberal Democrats hold | Swing | ||||
Norbury was still represented by one councillor and was slightly expanded.
Party | Candidate | Votes | % | ±% | |
---|---|---|---|---|---|
Conservative | Tony Morley | 492 | 67.3 | 15.6 | |
Labour | David Walker | 123 | 16.8 | 0.3 | |
Green | John Hill | 116 | 15.9 | New | |
Majority | 369 | 50.5 | |||
Turnout | 731 | 40 | |||
Conservative hold | Swing | 7.7 | |||
Tideswell was still represented by one councillor and was slightly expanded.
Party | Candidate | Votes | % | ±% | |
---|---|---|---|---|---|
Green | Neil Buttle | 514 | 66.5 | 24.4 | |
Conservative | Harry Shirt | 259 | 33.5 | 1.0 | |
Majority | 255 | 33.0 | |||
Turnout | 773 | 42 | |||
Green hold | Swing | 12.7 | |||
Wirksworth was still represented by three councillors and was slightly expanded.
Party | Candidate | Votes | % | ±% | |
---|---|---|---|---|---|
Labour | Pete Slack | 1,491 | 69.9 | 13.8 | |
Labour | Dawn Greatorex | 1,454 | 68.2 | 8.6 | |
Labour | Lucy Peacock | 1,375 | 64.5 | 10.4 | |
Conservative | Steven Kennel | 567 | 26.6 | 2.7 | |
Conservative | Paul Williamson | 559 | 26.2 | 2.3 | |
Conservative | Tony Britner | 554 | 26.0 | New | |
Majority | 808 | 13.5 | |||
Turnout | 2,132 | 44 | |||
Labour hold | Swing | 0.5 | |||
Labour hold | Swing | ||||
Youlgrave was a new ward which was to be represented by one councillor. It was broadly coterminous with the old ward of Lathkill and Bradford, which was also represented by one councillor.
Party | Candidate | Votes | % | ±% | |
---|---|---|---|---|---|
Green | Laura Mellstrom | 390 | 43.5 | New | |
Independent | Thomas Elliott | 307 | 34.2 | 51.8 | |
Conservative | John Pearce | 200 | 22.3 | New | |
Majority | 83 | 9.3 | |||
Turnout | 897 | 50 | |||
Green gain from Independent | Swing | 47.7 | |||
Party | Candidate | Votes | % | ±% | |
---|---|---|---|---|---|
Labour | Bob Butcher | 467 | 37.7 | +13.7 | |
Conservative | Richard Walsh | 452 | 36.5 | -9.5 | |
Liberal Democrats | Claire Cadogan | 161 | 13.0 | +4.9 | |
Green | Nicola Peltell | 73 | 5.9 | -8.1 | |
Reform UK | Lesley Crosby | 50 | 4.0 | New | |
Independent | Rachel Elnaugh-Love | 36 | 2.9 | -5.1 | |
Majority | 15 | 1.2 | |||
Turnout | 1,239 | 35 | -12 | ||
Labour gain from Conservative | Swing | ||||
Party | Candidate | Votes | % | ±% | |
---|---|---|---|---|---|
Conservative | Sue Bull | 317 | 63.1 | -4.2 | |
Labour | Bob Allen | 75 | 14.9 | -1.9 | |
Green | John Hill | 65 | 12.9 | -2.9 | |
Liberal Democrats | Robin Shirtcliffe | 45 | 9.0 | New | |
Majority | 242 | 48.2 | |||
Turnout | 502 | 27 | -13 | ||
Conservative hold | Swing | ||||
Derbyshire is a ceremonial county in the East Midlands of England. It borders Greater Manchester, West Yorkshire, and South Yorkshire to the north, Nottinghamshire to the east, Leicestershire to the south-east, Staffordshire to the south and west, and Cheshire to the west. Derby is the largest settlement, and Matlock is the county town.
Aberdeen City Council is the local government authority for the city of Aberdeen, Scotland. It was created in 1996, under the Local Government etc. (Scotland) Act 1994, though a sense of Aberdeen as a city, with its own city council, can be traced back to 1900, when the county of the city of Aberdeen was created.
Matlock is the county town of Derbyshire, England. It is in the south-eastern part of the Peak District, with the National Park directly to the west. The spa resort of Matlock Bath is immediately south of the town as well as Cromford lying further south still. The civil parish of Matlock Town had a population in the 2021 UK census of 10,000.
Derbyshire Dales is a local government district in Derbyshire, England. The district was created in 1974 as West Derbyshire; the name was changed to Derbyshire Dales in 1987. The council is based in the town of Matlock, and the district also includes the towns of Ashbourne, Bakewell, Darley Dale and Wirksworth, as well as numerous villages and extensive rural areas. Much of the district is within the Peak District National Park.
North East Derbyshire is a local government district in Derbyshire, England. The council is based in the large village of Wingerworth. The district also includes the towns of Dronfield and Clay Cross as well as numerous villages and surrounding rural areas.
The Limestone Way is a waymarked long-distance footpath in Derbyshire, England. It runs for 46 miles (74 km) through the White Peak of the Peak District National Park, from Castleton south to Rocester over the county boundary into Staffordshire. The trail is named for the limestone scenery along its route. It was devised by Brian Spencer of Matlock Rotary Club and developed and opened in 1986 by the West Derbyshire District Council. It originally ran to Matlock, but was extended to its current, longer route in 1992 to join up with the Staffordshire Way.
Derbyshire Dales is a constituency that has been represented in the House of Commons of the UK Parliament since 2019 by Sarah Dines of the Conservative Party. The constituency was created for the 2010 general election.
Mid Derbyshire is a constituency represented in the House of Commons of the UK Parliament since its 2010 creation by Pauline Latham, a Conservative.
Derbyshire County Council is the upper-tier local authority for the non-metropolitan county of Derbyshire in England. The council is based at County Hall in Matlock. Since 2017 the council has been under Conservative majority control.
An election to Slough Borough Council was held on 10 June 2004. The whole council was up for election. This was the 120th Slough general local authority election, since Slough became a local government unit in 1863, including both whole Council elections and elections by thirds.
The politics of the Highland council area in Scotland are evident in the deliberations and decisions of the Highland Council, in elections to the council, and in elections to the House of Commons of the Parliament of the United Kingdom (Westminster) and the Scottish Parliament (Holyrood). In the European Parliament the area was within the Scotland constituency, which covers all of the 32 council areas of Scotland.
North West Leicestershire District Council elections are held every four years. North West Leicestershire District Council is the local authority for the non-metropolitan district of North West Leicestershire in Leicestershire, England. Since the last boundary changes in 2015, 38 councillors are elected from 38 wards.
The 2003 Derbyshire Dales District Council election took place on 1 May 2003 to elect members of Derbyshire Dales District Council in Derbyshire, England. The whole council was up for election with boundary changes since the last election in 1999. The Conservative Party stayed in overall control of the council.
The 2007 Derbyshire Dales District Council election took place on 3 May 2007 to elect members of Derbyshire Dales District Council in Derbyshire, England. The whole council was up for election and the Conservative Party stayed in overall control of the council.
The 2011 Derbyshire Dales District Council election took place on 5 May 2011 to elect members of Derbyshire Dales District Council in Derbyshire, England. The whole council was up for election and the Conservative Party stayed in overall control of the council.
Sir Richard Ranulph FitzHerbert, 9th Baronet, is a British landowner and holds the FitzHerbert baronetcy, which he inherited in 1989 along with the family home, Tissington Hall, on the death of his uncle, Sir John FitzHerbert. At the time of his inheritance, he was working as a wine merchant.
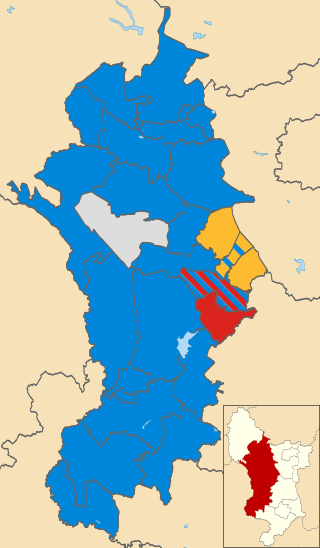
The 2019 Derbyshire Dales District Council election was held on 2 May 2019 to elect all 39 councillors for Derbyshire Dales District Council. This was on the same day as other local elections.
The 2022 Manchester City Council election took place on 5 May 2022. One third of councillors on Manchester City Council were elected. This election was a part of the other local elections across the United Kingdom.