| |||||||||||||||||||||||||||||||||||||||||||||||||||||||||||||||||
11 out of 35 seats to Worcester City Council 18 seats needed for a majority | |||||||||||||||||||||||||||||||||||||||||||||||||||||||||||||||||
---|---|---|---|---|---|---|---|---|---|---|---|---|---|---|---|---|---|---|---|---|---|---|---|---|---|---|---|---|---|---|---|---|---|---|---|---|---|---|---|---|---|---|---|---|---|---|---|---|---|---|---|---|---|---|---|---|---|---|---|---|---|---|---|---|---|
| |||||||||||||||||||||||||||||||||||||||||||||||||||||||||||||||||
Winner of each seat at the 2023 Worcester City Council election | |||||||||||||||||||||||||||||||||||||||||||||||||||||||||||||||||
|
The 2023 Worcester City Council election took place on 4 May 2023 to elect members of Worcester City Council in Worcestershire, England. [2] This was on the same day as other local elections in England.
Prior to the election the council had been under no overall control. The Conservatives were the largest party and their group leader, Chris Mitchell, was the leader of the council. The council remained under no overall control after the election, but the Conservatives went from being the largest party to being the third largest party, not winning any of the seats available at this election. Conservative leader Chris Mitchell was one of those who lost his seat. Labour were the largest party after the election, for the first time since 2000, and the Greens made the most gains, gaining four new seats and winning the popular vote for the first time. [3]
The Labour group leader, Lynn Denham, and the Green group leader, Marjory Bisset, were appointed joint leaders of the council at the subsequent annual council meeting on 16 May 2023. [4]
2023 Worcester City Council election | ||||||||||
---|---|---|---|---|---|---|---|---|---|---|
Party | This election | Full council | This election | |||||||
Seats | Net | Seats % | Other | Total | Total % | Votes | Votes % | +/− | ||
Green | 5 | 4 | 45.5 | 5 | 10 | 28.6 | 6,161 | 28.4 | +10.3 | |
Labour | 4 | 1 | 36.4 | 9 | 13 | 37.1 | 6,052 | 28.0 | –4.2 | |
Liberal Democrats | 2 | 2 | 18.2 | 2 | 4 | 11.4 | 3,523 | 16.3 | +1.5 | |
Conservative | 0 | 7 | 0.0 | 8 | 8 | 22.9 | 5,488 | 25.4 | –6.1 | |
Independent | 0 | 0.0 | 0 | 0 | 0.0 | 108 | 0.5 | N/A | ||
TUSC | 0 | 0.0 | 0 | 0 | 0.0 | 103 | 0.5 | +0.1 | ||
Reform UK | 0 | 0.0 | 0 | 0 | 0.0 | 39 | 0.2 | ±0.0 | ||
The Statement of Persons Nominated, which details the candidates standing in each ward, was released by Worcester City Council following the close of nominations on 5 April 2023. [5]
Party | Candidate | Votes | % | ±% | |
---|---|---|---|---|---|
Green | Hannah Cooper | 1,134 | 61.0 | +35.6 | |
Labour Co-op | Jenny Barnes | 505 | 27.2 | -11.2 | |
Conservative | Anja Potze | 152 | 8.2 | -14.4 | |
Liberal Democrats | Jon Taylor | 59 | 3.2 | -4.1 | |
Majority | 629 | ||||
Turnout | 1860 | 39.3 | +2.3 | ||
Registered electors | 4732 | ||||
Green gain from Labour Co-op | Swing | 23.4 | |||
Party | Candidate | Votes | % | ±% | |
---|---|---|---|---|---|
Labour | Sue Smith | 993 | 43.8 | +22.0 | |
Conservative | Adele Rimell | 847 | 37.4 | -7.9 | |
Green | Phil Gilfillan | 221 | 9.8 | -0.4 | |
Liberal Democrats | John Ondreasz | 183 | 8.8 | -0.2 | |
TUSC | Eloise Davies | 19 | 0.8 | New | |
Majority | 146 | ||||
Turnout | 2,265 | 33.4 | -0.3 | ||
Registered electors | 6,791 | ||||
Labour gain from Conservative | Swing | 15.0 | |||
Party | Candidate | Votes | % | ±% | |
---|---|---|---|---|---|
Labour | Atif Sadiq | 1,238 | 45.0 | +10.0 | |
Conservative | Haris Saleem | 806 | 29.3 | -8.0 | |
Green | Jon Bodenham | 420 | 15.3 | +2.6 | |
Liberal Democrats | Mark Fenton | 199 | 7.2 | -0.9 | |
TUSC | Archie Harrison | 54 | 2.0 | New | |
Majority | 432 | ||||
Turnout | 2,753 | 32.8 | -4.1 | ||
Registered electors | 8,403 | ||||
Labour gain from Conservative | Swing | 9.0 | |||
Party | Candidate | Votes | % | ±% | |
---|---|---|---|---|---|
Liberal Democrats | Jessie Venegas | 1,641 | 63.8 | +24.4 | |
Conservative | Angela Stanley | 483 | 18.8 | -23.8 | |
Labour | Tom Henri | 227 | 8.8 | +3.9 | |
Green | Alex Mace | 205 | 8.0 | -0.3 | |
Majority | 1158 | ||||
Turnout | 2571 | 39.9 | -5.6 | ||
Registered electors | 6451 | ||||
Liberal Democrats gain from Conservative | Swing | 24.1 | |||
Party | Candidate | Votes | % | ±% | |
---|---|---|---|---|---|
Labour | Simon Cronin | 1,018 | 47.6 | +4.5 | |
Conservative | Allah Ditta | 688 | 32.2 | +3.4 | |
Green | Jacek Zmarzlik | 182 | 8.5 | -6.8 | |
Liberal Democrats | Scott Butler | 134 | 6.3 | New | |
Independent | David Carney | 108 | 5.0 | New | |
Majority | 330 | ||||
Turnout | 2139 | 32.3 | +4.2 | ||
Registered electors | 6627 | ||||
Labour hold | Swing | +0.6 | |||
Party | Candidate | Votes | % | ±% | |
---|---|---|---|---|---|
Green | Tor Pingree | 703 | 43.2 | +28.6 | |
Conservative | Christopher Mitchell | 615 | 37.8 | -7.5 | |
Labour Co-op | Aaron Daniels | 217 | 13.3 | -15.4 | |
Liberal Democrats | Steve Mather | 58 | 3.6 | New | |
Majority | 88 | ||||
Turnout | 1629 | 38.3 | +4.5 | ||
Registered electors | 4253 | ||||
Green gain from Conservative | Swing | 18.1 | |||
Party | Candidate | Votes | % | ±% | |
---|---|---|---|---|---|
Labour | Richard Udall | 1,199 | 70.5 | +13.6 | |
Conservative | Bertie Ballinger | 249 | 14.6 | -3.1 | |
Green | Susan Avery | 135 | 7.9 | -3.3 | |
Liberal Democrats | Peter Jackson | 68 | 4.0 | New | |
TUSC | Mark Davies | 30 | 1.8 | New | |
Majority | 950 | ||||
Turnout | 1700 | 26.6 | -0.5 | ||
Registered electors | 6379 | ||||
Labour hold | Swing | +8.4 | |||
Party | Candidate | Votes | % | ±% | |
---|---|---|---|---|---|
Green | Elena Round | 817 | 44.9 | 27.9 | |
Conservative | James Woolgar | 523 | 28.8 | -25.9 | |
Liberal Democrats | Robert Renshaw | 305 | 16.8 | New | |
Labour | Chris Giles | 124 | 6.8 | -11.3 | |
Reform UK | Paul Hickling | 39 | 2.1 | New | |
Majority | 294 | ||||
Turnout | 1819 | 40.9 | +5.1 | ||
Registered electors | 4448 | ||||
Green gain from Conservative | Swing | 26.8 | |||
Party | Candidate | Votes | % | ±% | |
---|---|---|---|---|---|
Green | Marjory Bisset | 1,058 | 66.3 | +8.4 | |
Conservative | Tom Wisniewski | 309 | 19.4 | -8.3 | |
Labour | Ruth Coates | 180 | 11.3 | +5.1 | |
Liberal Democrats | Alison Morgan | 39 | 2.4 | +0.7 | |
Majority | 749 | ||||
Turnout | 1595 | 36.8 | -5.1 | ||
Registered electors | 4329 | ||||
Green hold | Swing | +8.4 | |||
Party | Candidate | Votes | % | ±% | |
---|---|---|---|---|---|
Liberal Democrats | Sarah Murray | 795 | 54.9 | +47.3 | |
Conservative | Chris Rimell | 402 | 27.8 | -16.5 | |
Labour | Michelle Hughes | 168 | 11.6 | -19.3 | |
Green | Alaric Stephen | 80 | 5.5 | -4.2 | |
Majority | 393 | ||||
Turnout | 1448 | 36.2 | -0.3 | ||
Registered electors | 3999 | ||||
Liberal Democrats gain from Conservative | Swing | 31.9 | |||
Party | Candidate | Votes | % | ±% | |
---|---|---|---|---|---|
Green | Andrew Cross | 1,206 | 65.3 | +30.7 | |
Conservative | Lucy Hodgson | 414 | 22.4 | -14.4 | |
Labour | Graham Taylor | 183 | 9.9 | -6.1 | |
Liberal Democrats | John Rudge | 42 | 2.3 | -2.9 | |
Majority | 792 | ||||
Turnout | 1847 | 40.2 | +5.9 | ||
Registered electors | 4590 | ||||
Green gain from Conservative | Swing | 22.6 | |||
Party | Candidate | Votes | % | ±% | |
---|---|---|---|---|---|
Labour | Elaine Willmore | 1,048 | 59.7 | +12.1 | |
Conservative | Allah Ditta | 518 | 29.5 | –2.7 | |
Liberal Democrats | Scott Butler | 102 | 5.8 | –0.5 | |
Independent | David Carney | 88 | 5.0 | ±0.0 | |
Majority | 530 | 30.2 | |||
Turnout | 1,759 | 26.5 | |||
Registered electors | 6,644 | ||||
Labour hold | Swing | ||||
Party | Candidate | Votes | % | ±% | |
---|---|---|---|---|---|
Green | Katie Collier | 733 | 53.5 | –11.8 | |
Conservative | Janet Lippett | 340 | 24.8 | +2.4 | |
Labour | Sunil Desayrah | 171 | 12.5 | +2.6 | |
Liberal Democrats | Paul Jagger | 92 | 6.7 | +4.4 | |
Reform UK | Paul Hickling | 29 | 2.1 | N/A | |
Majority | 393 | 28.7 | |||
Turnout | 1,369 | 30.0 | -10.2 | ||
Registered electors | 4,564 | ||||
Green gain from Conservative | Swing | 7.1 | |||
In the context of local authorities in the United Kingdom, no overall control is a situation in which no single political group achieves a majority of seats, analogous to a hung parliament. Of the 248 councils who had members up for election in the 2019 local elections, 73 resulted in a NOC administration. In the 2021 election, 14 resulted in no overall control. The term can still be used for several other countries, such as for two local councils of Malta and the General Assembly of Budapest in Hungary.
The 2000 Worcester City Council election took place on 4 May 2000 to elect members of Worcester City Council in Worcestershire, England. One third of the council was up for election and the Labour Party lost overall control of the council to no overall control.
The 2002 Worcester City Council election took place on 2 May 2002 to elect members of Worcester City Council in Worcestershire, England. One third of the council was up for election and the council stayed under no overall control.
The 2006 Worcester City Council election took place on 4 May 2006 to elect members of Worcester City Council in Worcestershire, England. One third of the council was up for election and the Conservative Party stayed in overall control of the council.
Worcester City Council is the local authority for Worcester, a non-metropolitan district with city status in Worcestershire, England. The council consists of 35 councillors, elected from 15 wards.
The 2000 Solihull Metropolitan Borough Council election took place on 4 May 2000 to elect members of Solihull Metropolitan Borough Council in the West Midlands, England. One third of the council was up for election and the Conservative party gained overall control of the council from no overall control.
The 2010 Carlisle City Council election took place on 6 May 2010 to elect members of Carlisle District Council in Cumbria, England. One third of the council was up for election and the council stayed under no overall control.
An election to Cambridgeshire County Council took place on 2 May 2013 as part of the 2013 United Kingdom local elections. 69 councillors were elected from 60 electoral divisions, which returned either one or two county councillors each by first-past-the-post voting for a four-year term of office. The electoral divisions were the same as those used at the previous election in 2009. No elections were held in Peterborough, which is a unitary authority outside the area covered by the County Council. The election saw the Conservative Party lose overall control of the council.
The Yorkshire Party is a regionalist political party in Yorkshire, a historic county of England. The party, which was founded in 2014, campaigns for the establishment of a devolved Yorkshire Parliament within the United Kingdom, with powers over education, environment, transportation and housing.
The 2012 Carlisle City Council election took place on 3 May 2012 to elect members of Carlisle District Council in Cumbria, England. One third of the council was up for election and the Labour Party gained overall control of the council from no overall control.
The 1999 Wychavon District Council election took place on 6 May 1999 to elect members of Wychavon District Council in Worcestershire, England. The whole council was up for election and the Conservative Party gained overall control of the council from no overall control.
The 2011 Wychavon District Council election took place on 5 May 2011 to elect members of Wychavon District Council in Worcestershire, England. The whole council was up for election and the Conservative Party stayed in overall control of the council.
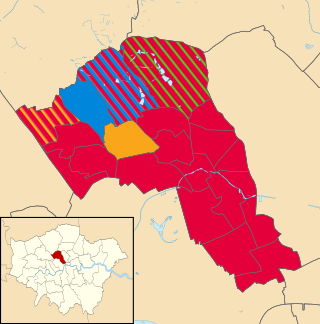
The 2022 Camden London Borough Council election took place on 5 May 2022. All 55 members of Camden London Borough Council were elected. The elections took place alongside local elections in the other London boroughs and elections to local authorities across the United Kingdom.
A by-thirds Hyndburn Borough Council local election, was held on Thursday 5 May 2022. Approximately one third of the local council's 35 seats fell up for election on that day.
The 2022 Bolton Metropolitan Borough Council election took place on 5 May 2022. One third of councillors—20 out of 60—were to be elected. The election took place alongside other local elections across the United Kingdom.
Elections to Colchester Borough Council took place on 5 May 2022. Eighteen members of the council were elected: one from 16 of the 17 wards, and two councillors from New Town & Christ Church ward, following the death of incumbent councillor Nick Cope, elected in 2019 and due to serve until 2023.
The 2023 United Kingdom local elections were held on Thursday, 4 May 2023 in England and on Thursday 18 May 2023 in Northern Ireland. These included district councils, unitary authorities, and directly elected mayors in England, and included all local councils in Northern Ireland. Notably, these elections were the first to be held under the Elections Act 2022, a new voter identification law that is controversial, meaning voters were required to show photo ID when attending a polling station.
The 2023 Colchester City Council election took place on 4 May 2023 to elect members of Colchester City Council in Essex, England. This was on the same day as other local elections across England. There were 17 of the 51 seats on the council up for election, being the usual third of the council, with one seat available for each ward. This set of seats were last contested at the 2019 election.
The 2023 Plymouth City Council election was held on 4 May 2023 to elect members of Plymouth City Council in England. It coincided with local elections across the United Kingdom.
The 2023 Canterbury City Council election took place on 4 May 2023 to elect members of Canterbury City Council in Kent, England. This was on the same day as other local elections in England.