| |||||||||||||||||||||||||||||||||||||||||||||||||||||||||||||||||||||
All 33 seats to Wyre Forest District Council 17 seats needed for a majority | |||||||||||||||||||||||||||||||||||||||||||||||||||||||||||||||||||||
---|---|---|---|---|---|---|---|---|---|---|---|---|---|---|---|---|---|---|---|---|---|---|---|---|---|---|---|---|---|---|---|---|---|---|---|---|---|---|---|---|---|---|---|---|---|---|---|---|---|---|---|---|---|---|---|---|---|---|---|---|---|---|---|---|---|---|---|---|---|
| |||||||||||||||||||||||||||||||||||||||||||||||||||||||||||||||||||||
|
The 2019 Wyre Forest District Council election took place on 2 May 2019 to elect members of Wyre Forest District Council in Worcestershire, England. [1] They were held on the same day as other local elections.
At the previous election, the Conservative Party had control with 21 councillors with the closest party being the Labour Party who had 4 councillors. [2]
2019 Wyre Forest District Council election | ||||||||||
---|---|---|---|---|---|---|---|---|---|---|
Party | Candidates | Seats | Gains | Losses | Net gain/loss | Seats % | Votes % | Votes | +/− | |
Conservative | 27 | 14 | 1 | 10 | 9 | 42.4 | 31.6 | 17,827 | –9.6 | |
Health Concern | 14 | 8 | 7 | 1 | 6 | 24.2 | 17.3 | 9,763 | +4.4 | |
Independent | 5 | 5 | 2 | 0 | 2 | 15.2 | 10.6 | 5,983 | +5.5 | |
Liberal Democrats | 14 | 3 | 3 | 0 | 3 | 9.1 | 10.5 | 5,919 | +1.9 | |
Labour | 21 | 2 | 2 | 4 | 2 | 6.1 | 16.1 | 9,053 | –10.4 | |
Green | 11 | 1 | 1 | 0 | 1 | 3.0 | 7.7 | 4,325 | +3.8 | |
UKIP | 10 | 0 | 0 | 1 | 1 | 0.0 | 6.2 | 3,491 | +4.4 |
The Conservatives lost their majority by losing 7 councillors taking their number to 14, while Health Concern and independent councillors made substantial gains while Labour halved their number of councillors from 4 to 2. Vicky Caulfield was the only Green Party Councillor to be elected in the district.
Following the elections, a coalition was formed between the Independent Health Concern, Independents, Liberal Democrats, Labour and Green councillors.
21 | 4 | 3 | 3 | 2 |
Conservatives | Labour | Liberal Democrats | Independent | Independent Community and Health Concern |
14 | 8 | 5 | 3 | 2 | 1 |
Conservatives | Independent Community and Health Concern | Independent | Liberal Democrats | Labour | Green |
Party | Candidate | Votes | % | ±% | |
---|---|---|---|---|---|
Independent | Helen Elizabeth Dyke* | 1,583 | 67.5 | ||
Independent | Peter Dyke* | 1,455 | 62.0 | ||
Independent | John Cedric Aston* | 1,277 | 54.5 | ||
Conservative | Tony Andrew Muir | 476 | 20.3 | ||
Health Concern | Keith Roderick Robertson | 398 | 17.0 | ||
Green | Maxine Elizabeth Watkins | 322 | 13.7 | ||
Labour | George Price | 262 | 11.2 | ||
UKIP | Warren Gregory Rogers | 256 | 10.9 | ||
Turnout | 2,345 | 36.14 | |||
Independent hold | Swing | ||||
Helen Elizabeth Dyke, Peter Dyke and John Cedric Aston were elected. [3]
Party | Candidate | Votes | % | ±% | |
---|---|---|---|---|---|
Health Concern | Claire June Barnett | 724 | 37.7 | ||
Health Concern | John William Roland Thomas | 724 | 37.7 | ||
Conservative | Ken Henderson* | 608 | 31.7 | ||
Conservative | Lin Henderson* | 564 | 29.4 | ||
Conservative | Gary Martyn Talbot | 507 | 26.4 | ||
Labour | Vi Higgs | 473 | 24.6 | ||
Labour | Cliff Brewer | 398 | 20.7 | ||
Labour | Rob Lloyd | 395 | 20.6 | ||
UKIP | Nick Jolly | 328 | 17.1 | ||
Green | Luke Thomas Clasper | 300 | 15.6 | ||
Liberal Democrats | Anita Ellen Beavis | 99 | 5.2 | ||
Turnout | 1,920 | 30.22 | |||
Health Concern gain from Conservative | Swing | ||||
Health Concern gain from Labour | Swing | ||||
Conservative hold | Swing | ||||
Claire June Barnett, John William Roland Thomas and Ken Henderson were elected. [4]
Party | Candidate | Votes | % | ±% | |
---|---|---|---|---|---|
Conservative | Anna Coleman | 969 | 39.8 | ||
Independent | Calne Elaine Edinton-White | 947 | 38.9 | ||
Conservative | Roger Hugh Coleman | 866 | 35.6 | ||
Conservative | Becky Vale | 852 | 35.0 | ||
Labour | Rod Stanczyszyn | 821 | 33.7 | ||
UKIP | Paul Stephen Rogers | 428 | 17.6 | ||
Turnout | 2,436 | 35.78 | |||
Conservative hold | Swing | ||||
Independent gain from Conservative | Swing | ||||
Conservative hold | Swing | ||||
Anna Coleman, Calne Elaine Edinton-White and Roger Hugh Coleman were elected. [5]
Party | Candidate | Votes | % | ±% | |
---|---|---|---|---|---|
Conservative | Tracey Onslow | 752 | 39.9 | ||
Green | Vicky Caulfield | 645 | 34.2 | ||
Labour | Leigh Andrew John Robert Whitehouse | 636 | 33.7 | ||
Conservative | Juliet Denise Smith* | 599 | 31.8 | ||
Conservative | John Arthur Hart | 577 | 30.6 | ||
Liberal Democrats | David Eric Hollyoak | 497 | 26.4 | ||
UKIP | George Anthony Connolly | 393 | 20.8 | ||
Turnout | 1,885 | 28.29 | |||
Conservative hold | Swing | ||||
Green gain from Conservative | Swing | ||||
Labour gain from Conservative | Swing | ||||
Tracey Onslow, Vicky Caulfield and Leigh Andrew John Robert Whitehouse. [6]
Party | Candidate | Votes | % | ±% | |
---|---|---|---|---|---|
Independent | Mary Alice Rayner* | 721 | 40.3 | ||
Health Concern | Peter Winston Montgomery Young | 682 | 38.1 | ||
Labour | Sarah Elizabeth Nicole Rook | 481 | 26.9 | ||
Labour | Gareth David Webster | 461 | 25.8 | ||
Liberal Democrats | Abdur Rizan Razzak | 375 | 21.0 | ||
UKIP | Bill Hopkins | 370 | 20.7 | ||
Conservative | Steve Walker | 365 | 20.4 | ||
Green | Anita Ostrowski | 332 | 18.6 | ||
Liberal Democrats | Clare Ramona Cassidy | 304 | 17.0 | ||
Liberal Democrats | Simon Ford | 227 | 12.7 | ||
Turnout | 1,788 | 27.21 | |||
Independent gain from Conservative | Swing | ||||
Health Concern hold | Swing | ||||
Labour gain from UKIP | Swing | ||||
Mary Alice Rayner, Peter Winston Montgomery Young and Sarah Elizabeth Nicole Rook were elected. [7]
Party | Candidate | Votes | % | ±% | |
---|---|---|---|---|---|
Conservative | Nathan John Desmond* | 788 | 40.9 | ||
Conservative | Sally Jane Chambers* | 728 | 37.8 | ||
Conservative | Nicky Gale | 647 | 33.6 | ||
Health Concern | Sue Meekings | 625 | 32.4 | ||
Green | Dave Finch | 404 | 21.0 | ||
UKIP | Craig Ashley Leonard | 375 | 19.5 | ||
Labour | John Beckingham | 328 | 17.0 | ||
Labour | Gerald Crumpton | 299 | 15.5 | ||
Liberal Democrats | Adrian Stanley Beavis | 288 | 14.9 | ||
Liberal Democrats | Leia Rachel Devon Beavis | 235 | 12.2 | ||
Liberal Democrats | Heidi Ruth Worth | 226 | 11.7 | ||
Turnout | 1,928 | 26.30 | |||
Conservative hold | Swing | ||||
Conservative gain from Labour | Swing | ||||
Nathan John Desmond, Sally Jane Chambers and Nicky Gale were elected. [8]
Party | Candidate | Votes | % | ±% | |
---|---|---|---|---|---|
Health Concern | Susie Griffiths | 956 | 42.6 | ||
Health Concern | Graham William Ballinger | 890 | 39.7 | ||
Health Concern | Anna Louise L'Huillier | 651 | 29.0 | ||
Labour | Nigel Knowles* | 628 | 28.0 | ||
Conservative | Mike Cheeseman | 628 | 28.0 | ||
Conservative | David Richard Ross | 536 | 23.9 | ||
Labour | Mary Clive McDonnell | 502 | 22.4 | ||
UKIP | Tony Whitmore | 338 | 15.1 | ||
Green | Brett Raymond Caulfield | 318 | 14.2 | ||
Liberal Democrats | Oliver Yasha Walker | 311 | 13.9 | ||
Turnout | 2,243 | 29.81 | |||
Health Concern gain from Conservative | Swing | ||||
Health Concern gain from Labour | Swing | ||||
Susie Griffiths, Graham William Ballinger and Anna Louise L'Huillier were elected. [9]
Party | Candidate | Votes | % | ±% | |
---|---|---|---|---|---|
Health Concern | Dixon Raymond Sheppard | 263 | 37.2 | ||
Conservative | David Little* | 241 | 34.1 | ||
Labour | Carol Gwyneth Warren | 109 | 15.4 | ||
Liberal Democrats | Chris Pratt | 63 | 8.9 | ||
Green | Nick Atkinson | 31 | 4.4 | ||
Turnout | 707 | 33.21 | |||
Health Concern gain from Conservative | Swing | ||||
Dixon Raynong Sheppard was elected. [10]
Party | Candidate | Votes | % | ±% | |
---|---|---|---|---|---|
Health Concern | Nicky Martin | 1,013 | 52.8 | ||
Conservative | Chris Rogers* | 662 | 34.5 | ||
Conservative | Berenice Susan Dawes | 647 | 33.7 | ||
Conservative | Howard Stuart Williams | 514 | 26.8 | ||
Green | Phil Oliver | 426 | 22.2 | ||
Labour | Jackie Griffiths | 411 | 21.4 | ||
Labour | Jill Hawes | 399 | 20.8 | ||
Labour | Daniel Colin Rees | 365 | 19.0 | ||
Liberal Democrats | Rachel Louise Akathiotis | 225 | 11.7 | ||
Turnout | 1,920 | 26.65 | |||
Health Concern gain from Conservative | Swing | ||||
Conservative hold | Swing | ||||
Nicky Martin, Chris Rogers and Berenice Susan Dawes were elected. [11]
Party | Candidate | Votes | % | ±% | |
---|---|---|---|---|---|
Liberal Democrats | Frances Mary Oborski* | 1,183 | 56.6 | ||
Liberal Democrats | Shazu Miah | 960 | 45.9 | ||
Liberal Democrats | Alan John Totty | 926 | 44.3 | ||
UKIP | Dave Field | 482 | 23.1 | ||
Conservative | Kevin George Gale | 429 | 20.5 | ||
Labour | Nick Savage | 394 | 18.9 | ||
Conservative | Matthew Francis Viner | 384 | 18.4 | ||
Turnout | 2,090 | 28.67 | |||
Liberal Democrats gain from Liberal | Swing | ||||
Liberal Democrats gain from Conservative | Swing | ||||
Liberal Democrats gain from Health Concern | Swing | ||||
Frances Mary Oborski, Shazu Miah and Alan John Totty were elected. [12]
Party | Candidate | Votes | % | ±% | |
---|---|---|---|---|---|
Conservative | Paul Harrison | 648 | 42.0 | ||
Conservative | John Frederick Byng | 631 | 40.9 | ||
Health Concern | Liz Davies | 561 | 36.3 | ||
Green | Megan Jane Williams | 397 | 25.7 | ||
Labour | Dan Crampton | 392 | 25.4 | ||
UKIP | Christopher Robert Wood | 205 | 13.3 | ||
Turnout | 1,544 | 36.14 | |||
Conservative hold | Swing | ||||
Paul Harrison and John Frederick Byng were elected. [13]
Party | Candidate | Votes | % | ±% | |
---|---|---|---|---|---|
Conservative | Ian David Hardiman* | 1,136 | 42.1 | ||
Conservative | Marcus John Hart* | 1,115 | 41.3 | ||
Conservative | Lisa Joan Jones | 958 | 35.5 | ||
Health Concern | Adrian Mark Carlos | 881 | 32.7 | ||
Health Concern | Vince Smith MBE | 777 | 28.8 | ||
Health Concern | Harry Kenelm Dakeyne Grove | 618 | 22.9 | ||
Labour | Chris Nicholls | 520 | 19.3 | ||
Labour | David Paul Jones | 484 | 17.9 | ||
Green | Kate Spohrer | 423 | 15.7 | ||
UKIP | Steven Harrington | 316 | 11.7 | ||
Labour | Barry Mcfarland | 295 | 10.9 | ||
Turnout | 2,698 | 37.76 | |||
Conservative hold | Swing | ||||
Ian David Hardiman, Marcus John Hart and Lisa Joan Jones were elected. [14]
Party | Candidate | Votes | % | ±% | |
---|---|---|---|---|---|
Conservative | David Ross | 564 | 40.9 | +21.1 | |
Labour | Nigel Knowles | 372 | 27.0 | +7.2 | |
Liberal Democrats | Oliver Walker | 245 | 17.8 | +8.0 | |
Independent | Doug Hine | 198 | 14.4 | +14.4 | |
Majority | 192 | 13.9 | N/A | ||
Turnout | 1,379 | ||||
Conservative gain from Health Concern | Swing | ||||
David Ross was elected
Party | Candidate | Votes | % | ±% | |
---|---|---|---|---|---|
Conservative | Ben Brookes | 826 | 45.2 | ||
Labour | Kate Sewell | 656 | 35.9 | ||
Liberal Democrats | Oliver Walker | 347 | 19.0 | ||
Majority | 170 | 9.3 | N/A | ||
Turnout | 1,835 | 24.51 | |||
Conservative gain from Health Concern | Swing | ||||
Ben Brookes was elected
Lancaster City Council elections are held every four years. Lancaster City Council is the local authority for the non-metropolitan district of Lancaster in Lancashire, England. Since the last boundary changes in 2023, 61 councillors have been elected from 27 wards.
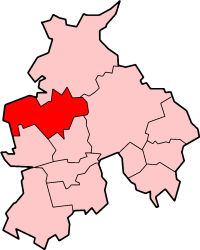
Wyre Borough Council elections are held every four years. Wyre Borough Council is the local authority for the non-metropolitan district of Wyre in Lancashire, England. Since the last boundary changes in 2015, 50 councillors have been elected from 24 wards.
Forest Heath District Council in Suffolk, England was elected every four years. between the last boundary changes in 2003 and the final elections in 2015, 27 councillors were elected from 14 wards. The council was abolished in 2019, with the area becoming part of West Suffolk.
Wyre Forest is a local government district in Worcestershire, England. It is named after the ancient woodland of Wyre Forest. The largest town is Kidderminster, where the council is based. The district also includes the towns of Stourport-on-Severn and Bewdley, along with several villages and surrounding rural areas.
Forest of Dean District Council is the local authority for the Forest of Dean in Gloucestershire, England. The council is elected every four years. Since the last boundary changes in 2019, 38 councillors are elected from 21 wards.
Norfolk County Council in England is elected every four years. Since the last boundary changes in 2005, 84 councillors have been elected from 84 wards.
North Norfolk District Council in Norfolk, England is elected every four years.
One-third of Runnymede Borough Council in Surrey, England, is elected each year, followed by one year where there is an election to Surrey County Council instead. The council is divided up into 14 wards, electing 41 councillors, since the last boundary changes in 2019.
North Yorkshire Council elections are generally held every four years. From 1974 until 2023 the council was called North Yorkshire County Council and it was an upper tier county council, with district-level functions being provided by the area's district councils. The districts were all abolished with effect from 1 April 2023, at which point the county council became a unitary authority, taking on the functions of the abolished district councils. The county council changed its name to North Yorkshire Council to coincide with the change in its powers.
Thanet District Council elections are held every four years to elect Thanet District Council in Kent, England. Since the last boundary changes in 2003 the council has comprised 56 councillors representing 23 wards.
The 2000 Wyre Forest District Council election took place on 4 May 2000 to elect members of Wyre Forest District Council in Worcestershire, England. One third of the council was up for election and the council stayed under no overall control.
The 2002 Wyre Forest District Council election took place on 2 May 2002 to elect members of Wyre Forest District Council in Worcestershire, England. One third of the council was up for election and the Independent Kidderminster Hospital and Health Concern party gained overall control of the council from no overall control.
The 2003 Wyre Forest District Council election took place on 1 May 2003 to elect members of Wyre Forest District Council in Worcestershire, England. One third of the council was up for election and the council stayed under no overall control.
The 2004 Wyre Forest District Council election took place on 10 June 2004 to elect members of Wyre Forest District Council in Worcestershire, England. The whole council was up for election with boundary changes since the last election in 2003. The council stayed under no overall control, but with the Conservatives taking over as the largest party on the council from the Health Concern party.
The 2007 Wyre Forest District Council election took place on 3 May 2007 to elect members of Wyre Forest District Council in Worcestershire, England. One third of the council was up for election and the council stayed under no overall control.
The 2008 Wyre Forest District Council election took place on 1 May 2008 to elect members of Wyre Forest District Council in Worcestershire, England. One third of the council was up for election and the Conservative Party gained overall control of the council from no overall control.
The 2014 Wyre Forest District Council election took place on 22 May 2014 to elect members of Wyre Forest District Council in Worcestershire, England. One third of the council was up for election and the council stayed under no overall control.
The 2015 Wyre Forest District Council election took place on 7 May 2015 to elect members of Wyre Forest District Council in Worcestershire, England. The whole council was up for election after boundary changes reduced the number of seats by nine. The Conservative Party gained overall control of the council from no overall control.
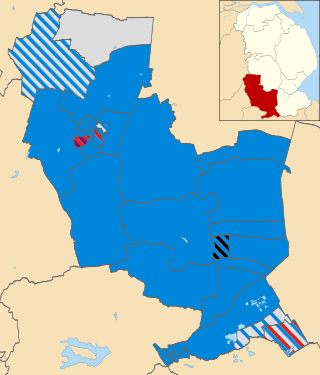
The 2015 South Kesteven District Council election took place on 7 May 2015 to elect members of South Kesteven District Council in Lincolnshire, England. The whole council was up for election after boundary changes reduced the number of seats by two. The Conservative party stayed in overall control of the council.
The 2018 Wyre Forest District Council election took place on 3 May 2018 to elect members of the Wyre Forest District Council in Worcestershire, England. They were held on the same day as other local elections.