![]() | |||||||||||||||||||||||||||||
| |||||||||||||||||||||||||||||
All 43 seats to West Berkshire Council 22 seats needed for a majority | |||||||||||||||||||||||||||||
---|---|---|---|---|---|---|---|---|---|---|---|---|---|---|---|---|---|---|---|---|---|---|---|---|---|---|---|---|---|
| |||||||||||||||||||||||||||||
![]() Winner of each seat at the 2019 West Berkshire Council election | |||||||||||||||||||||||||||||
|
The 2019 West Berkshire Council election took place on 2 May 2019 to elect members of West Berkshire Council in England. This was on the same day as other local elections. The whole council was up for election and the Conservative Party retained overall control of the council, despite significant gains by the Liberal Democrats and the election of the first Green Party councillors in West Berkshire. [1]
At the last election in 2015, the Conservatives won a majority of seats, with 48 councillors, compared to 4 for the Liberal Democrats. No other parties had representation on the council. [2]
There were boundary changes between the 2015 and 2019 elections, reducing the total number of seats from 52 to 43, and the number of wards from 30 to 24. The new wards elected between one and three district councillors depending on their population. [3]
2019 West Berkshire Council election [4] | ||||||||||
---|---|---|---|---|---|---|---|---|---|---|
Party | Candidates | Seats | Gains | Losses | Net gain/loss | Seats % | Votes % | Votes | +/− | |
Conservative | 43 | 24 | N/A | N/A | ![]() | 55.8 | 37.4 | 18,258 | ||
Liberal Democrats | 36 | 16 | N/A | N/A | ![]() | 37.2 | 31.9 | 15,657 | ||
Green | 16 | 3 | N/A | N/A | ![]() | 7.0 | 19.3 | 9,497 | ||
Labour | 43 | 0 | N/A | N/A | ![]() | 0.0 | 9.7 | 4,767 | ||
UKIP | 4 | 0 | N/A | N/A | ![]() | 0.0 | 1.7 | 816 |
Winning candidates are highlighted in bold.
Party | Candidate | Votes | % | |
---|---|---|---|---|
Conservative | Dominic Kevin Boeck | 529 | 55.1 | |
Liberal Democrats | Warren Fox | 318 | 33.1 | |
Labour | Steve Sutton | 113 | 11.8 | |
Majority | 211 | 22.0 | ||
Turnout | 983 | 33% | ||
Conservative win (new seat) |
Party | Candidate | Votes | % | |
---|---|---|---|---|
Conservative | Alan Law | 595 | 55.6 | |
Liberal Democrats | Laura Coyle | 256 | 23.9 | |
Green | Alex Carter | 156 | 14.6 | |
Labour | Jonathan Ashley | 64 | 6.0 | |
Majority | 339 | 31.7 | ||
Turnout | 1,087 | 38% | ||
Conservative win (new seat) |
Party | Candidate | Votes | % | |
---|---|---|---|---|
Conservative | Ross MacKinnon | 543 | 62.3 | |
Liberal Democrats | Ian Park | 237 | 27.2 | |
Labour | Ian McKay | 92 | 10.6 | |
Majority | 306 | 35.1 | ||
Turnout | 947 | 33% | ||
Conservative win (new seat) |
Party | Candidate | Votes | % | |
---|---|---|---|---|
Conservative | Graham Pask | 745 | 62.5 | |
Liberal Democrats | Mike Cole | 235 | 19.7 | |
Green | Jacqueline Paynter | 164 | 13.8 | |
Labour | Frank Greenwood | 48 | 4.0 | |
Majority | 510 | 42.8 | ||
Turnout | 1,212 | 43% | ||
Conservative win (new seat) |
Party | Candidate | Votes | % | |
---|---|---|---|---|
Liberal Democrats | Royce Longton | 1,293 | 45.1 | |
Liberal Democrats | Geoffrey Mayes | 1,173 | 40.9 | |
Conservative | Graham Bridgman | 1,148 | 40.0 | |
Conservative | Carol Jackson-Doerge | 1,126 | 39.2 | |
Conservative | Ian Morrin | 1,028 | 35.8 | |
Green | Alison May | 880 | 30.7 | |
Labour | John Hannawin | 556 | 19.4 | |
Labour | Janet Bishop | 315 | 11.0 | |
Labour | Graham Hudson | 206 | 7.2 | |
Majority | 22 | 0.8 | ||
Turnout | 2,908 | 36% | ||
Liberal Democrats win (new seat) | ||||
Conservative win (new seat) |
Party | Candidate | Votes | % | |
---|---|---|---|---|
Conservative | Hilary Cole | 1,073 | 52.8 | |
Conservative | Garth Simpson | 1,000 | 49.2 | |
Green | Jill Hoblin | 572 | 28.1 | |
Liberal Democrats | David Lister | 530 | 26.1 | |
Green | James Thomas | 377 | 18.5 | |
Labour | Marc Charon | 103 | 5.1 | |
Labour | Chris Evans | 93 | 4.6 | |
Majority | 428 | 21.1 | ||
Turnout | 2,073 | 38% | ||
Conservative win (new seat) | ||||
Conservative win (new seat) |
Party | Candidate | Votes | % | |
---|---|---|---|---|
Conservative | Clive Hooker | 716 | 62.2 | |
Liberal Democrats | Martin Colston | 320 | 27.8 | |
Labour | Grahame Murphy | 115 | 10.0 | |
Majority | 396 | 34.4 | ||
Turnout | 1,168 | 39% | ||
Conservative win (new seat) |
Party | Candidate | Votes | % | |
---|---|---|---|---|
Conservative | Dennis Benneyworth | 1,772 | 48.5 | |
Conservative | James Cole | 1,669 | 45.7 | |
Conservative | Claire Rowles | 1,605 | 44.0 | |
Liberal Democrats | Denise Gaines | 1,446 | 39.6 | |
Liberal Democrats | Rob Chicken | 1,359 | 37.2 | |
Liberal Democrats | Shaun Wood | 1,085 | 29.7 | |
Green | Tim Davis | 763 | 20.9 | |
Labour | Paul Pugh | 154 | 4.2 | |
Labour | Ron Blindell | 153 | 4.2 | |
Labour | Matt Wilson | 146 | 4.0 | |
Majority | 159 | 4.4 | ||
Turnout | 3,695 | 41% | ||
Conservative win (new seat) | ||||
Conservative win (new seat) |
Party | Candidate | Votes | % | |
---|---|---|---|---|
Conservative | Howard Woollaston | 667 | 63.1 | |
Liberal Democrats | Charlie Christopher | 254 | 24.0 | |
Labour | Moz Reynolds | 136 | 12.9 | |
Majority | 413 | 39.1 | ||
Turnout | 1,077 | 33% | ||
Conservative win (new seat) |
Party | Candidate | Votes | % | |
---|---|---|---|---|
Liberal Democrats | Martha Vickers | 979 | 48.6 | |
Liberal Democrats | Andy Moore | 957 | 47.5 | |
Conservative | Anthony Stretton | 562 | 27.9 | |
Conservative | Joseph Clarke | 535 | 26.6 | |
Green | Susan Millington | 450 | 22.3 | |
Labour | Mark Beach | 196 | 9.7 | |
Labour | Caroline Blake | 178 | 8.8 | |
Majority | 395 | 19.6 | ||
Turnout | 2,040 | 37% | ||
Liberal Democrats win (new seat) | ||||
Liberal Democrats win (new seat) |
Party | Candidate | Votes | % | |
---|---|---|---|---|
Conservative | Jeff Beck | 632 | 43.7 | |
Conservative | Jeff Cant | 532 | 36.8 | |
Liberal Democrats | Pam Taylor | 519 | 35.9 | |
Liberal Democrats | Simon Pike | 354 | 24.5 | |
Green | Danielle Bryan | 316 | 21.9 | |
Labour | Gemma Lowe | 211 | 14.6 | |
Labour | Lee McDougall | 163 | 11.3 | |
Majority | 13 | 0.9 | ||
Turnout | 2,727 | 27% | ||
Conservative win (new seat) | ||||
Conservative win (new seat) |
Party | Candidate | Votes | % | |
---|---|---|---|---|
Liberal Democrats | Billy Drummond | 1,375 | 49.8 | |
Liberal Democrats | Phil Barnett | 1,337 | 48.5 | |
Liberal Democrats | Erik Pattenden | 1,151 | 41.7 | |
Conservative | Sarah Greenall | 752 | 27.3 | |
Conservative | Miles Evans | 751 | 27.2 | |
Conservative | Mark Jones | 694 | 25.2 | |
Green | Matthew Lowe | 567 | 20.6 | |
Labour | Christine Copeland | 273 | 9.9 | |
Labour | Gary Puffett | 263 | 9.5 | |
UKIP | Malik Azam | 245 | 8.9 | |
Labour | Michael Wakelyn-Green | 183 | 6.6 | |
Majority | 399 | 14.4 | ||
Turnout | 2,782 | 32% | ||
Liberal Democrats win (new seat) | ||||
Liberal Democrats win (new seat) |
Party | Candidate | Votes | % | |
---|---|---|---|---|
Green | Steve Masters | 1,324 | 56.7 | |
Conservative | Lynne Doherty | 827 | 35.4 | |
Conservative | Jeanette Clifford | 812 | 34.8 | |
Liberal Democrats | Tony Harris | 777 | 33.3 | |
Labour | Robert Chapman | 177 | 7.6 | |
Labour | Bert Clough | 145 | 6.2 | |
Majority | 15 | 0.6 | ||
Turnout | 2,352 | 41% | ||
Green win (new seat) | ||||
Conservative win (new seat) |
Party | Candidate | Votes | % | |
---|---|---|---|---|
Liberal Democrats | Adrian Abbs | 1,830 | 54.5 | |
Liberal Democrats | Tony Vickers | 1,829 | 54.5 | |
Green | David Marsh | 1,794 | 53.5 | |
Conservative | Adrian Edwards | 1,118 | 33.3 | |
Conservative | Anthony Pick | 916 | 27.3 | |
Conservative | Stuart Davenport | 842 | 25.1 | |
Labour | Julie Wintrup | 253 | 7.5 | |
Labour | Andrew Wallace | 168 | 5.0 | |
Labour | Peter Tullett | 167 | 5.0 | |
Majority | 676 | 20.2 | ||
Turnout | 3,389 | 47% | ||
Liberal Democrats win (new seat) | ||||
Green win (new seat) |
Party | Candidate | Votes | % | |
---|---|---|---|---|
Conservative | Gareth Hurley | 593 | 51.7 | |
Liberal Democrats | Matthew Shakespeare | 350 | 30.5 | |
Labour | Suzie Ferguson | 205 | 17.9 | |
Majority | 243 | 21.2 | ||
Turnout | 1,117 | 39% | ||
Conservative win (new seat) |
Party | Candidate | Votes | % | |
---|---|---|---|---|
Green | Carolyne Culver | 917 | 61.9 | |
Conservative | Virginia Celsing | 458 | 30.9 | |
UKIP | Michael Palmer | 73 | 4.9 | |
Labour | Charlotte Blackman | 33 | 2.2 | |
Majority | 459 | 31.0 | ||
Turnout | 1,483 | 47% | ||
Green win (new seat) |
Party | Candidate | Votes | % | |
---|---|---|---|---|
Liberal Democrats | Owen Jeffrey | 907 | 47.2 | |
Liberal Democrats | Nasser Kessell | 766 | 39.9 | |
Conservative | Richard Crumly | 603 | 31.4 | |
Conservative | Marigold Jacques | 516 | 26.8 | |
Green | Paul Field | 289 | 15.0 | |
UKIP | David McMahon | 242 | 12.6 | |
Labour | Dave Burns | 129 | 6.7 | |
Labour | Gary Huntley | 121 | 6.3 | |
Majority | 395 | 19.6 | ||
Turnout | 1,934 | 35 | ||
Liberal Democrats win (new seat) | ||||
Liberal Democrats win (new seat) |
Party | Candidate | Votes | % | |
---|---|---|---|---|
Conservative | Steve Ardagh-Walter | 480 | 49.8 | |
Liberal Democrats | John Boyd | 409 | 42.4 | |
Labour | James Wilder | 75 | 7.8 | |
Majority | 71 | 7.4 | ||
Turnout | 986 | 37% | ||
Conservative win (new seat) |
Party | Candidate | Votes | % | |
---|---|---|---|---|
Liberal Democrats | Lee Dillon | 1,088 | 55.3 | |
Liberal Democrats | Jeremy Cottam | 1,054 | 53.5 | |
Conservative | Jason Collis | 706 | 35.9 | |
Conservative | Robert Denton-Powell | 622 | 31.6 | |
Labour | Neale Hall | 167 | 8.5 | |
Labour | Teresa McDowell | 156 | 7.9 | |
Majority | 348 | 17.6 | ||
Turnout | 2,007 | 33% | ||
Liberal Democrats win (new seat) | ||||
Liberal Democrats win (new seat) |
Party | Candidate | Votes | % | |
---|---|---|---|---|
Liberal Democrats | Jeff Brooks | 885 | 49.9 | |
Liberal Democrats | Keith Woodhams | 809 | 45.6 | |
Conservative | Ellen Crumly | 472 | 26.6 | |
Conservative | Helen Pciken | 419 | 23.6 | |
UKIP | Gary Johnson | 256 | 14.4 | |
Green | Jane Livermore | 255 | 14.4 | |
Labour | Sarah Berrington | 109 | 6.1 | |
Labour | Susan Turauskis | 82 | 4.6 | |
Majority | 337 | 19.0 | ||
Turnout | 1,792 | 33% | ||
Liberal Democrats win (new seat) | ||||
Liberal Democrats win (new seat) |
Party | Candidate | Votes | % | |
---|---|---|---|---|
Liberal Democrats | Alan Macro | 601 | 67.6 | |
Conservative | Alex Traves | 203 | 22.8 | |
Labour | Chris Ryder | 85 | 9.6 | |
Majority | 398 | 44.8 | ||
Turnout | 920 | 39% | ||
Liberal Democrats win (new seat) |
Party | Candidate | Votes | % | |
---|---|---|---|---|
Conservative | Richard Jones | 1,419 | 52.6 | |
Conservative | Andrew Williamson | 1,375 | 51.0 | |
Conservative | Thomas Marino | 1,318 | 48.9 | |
Green | Steve Young | 701 | 26.0 | |
Labour | Elizabeth Bell | 666 | 24.7 | |
Labour | Ben Rayner | 650 | 24.1 | |
Liberal Democrats | Steve Bown | 547 | 20.3 | |
Labour | Stuart Lythgoe | 471 | 17.5 | |
Majority | 617 | 22.9 | ||
Turnout | 2,736 | 33% | ||
Conservative win (new seat) | ||||
Conservative win (new seat) |
Party | Candidate | Votes | % | |
---|---|---|---|---|
Conservative | Joanne Stewart | 835 | 48.8 | |
Conservative | Anthony Linden | 829 | 48.5 | |
Labour | Clive Taylor | 412 | 24.1 | |
Labour | Lousie Coulson | 385 | 22.5 | |
Green | Gary Brampton | 349 | 20.4 | |
Liberal Democrats | Elizabeth O'Keefe | 235 | 13.7 | |
Liberal Democrats | Gary Norman | 198 | 11.6 | |
Majority | 417 | 24.4 | ||
Turnout | 1,741 | 28% | ||
Conservative win (new seat) | ||||
Conservative win (new seat) |
Party | Candidate | Votes | % | |
---|---|---|---|---|
Conservative | Richard Somner | 910 | 58.2 | |
Conservative | Peter Argyle | 865 | 55.3 | |
Labour | Charles Croal | 395 | 25.3 | |
Labour | Emma Gillespie | 367 | 23.5 | |
Liberal Democrats | Sarah Lowes | 266 | 17.0 | |
Liberal Democrats | Vaughan Miller | 206 | 13.2 | |
Majority | 470 | 30.0 | ||
Turnout | 1,596 | 28% | ||
Conservative win (new seat) | ||||
Conservative win (new seat) |
Party | Candidate | Votes | % | ±% | |
---|---|---|---|---|---|
Conservative | Akinbiyi Oloko | 548 | 42.3 | -15.6 | |
Labour | Charles Croal | 387 | 29.9 | +4.8 | |
Liberal Democrats | Steve Bown | 359 | 27.7 | +10.8 | |
Majority | 161 | 12.4 | |||
Turnout | 1,302 | 23.0 | |||
Conservative hold | Swing | ![]() | |||
Newbury is a constituency represented in the House of Commons of the UK Parliament from 2019 by Laura Farris, a Conservative. It was created by the Redistribution of Seats Act 1885 and has been in continual existence since then.
Wokingham is a constituency in Berkshire represented in the House of Commons of the Parliament of the United Kingdom since 1987 by John Redwood, a Conservative.
Guildford Borough Council in Surrey, England is elected every four years.
Lewes District Council in East Sussex, England is elected every four years. Since the last boundary changes in 2019, 41 councillors are elected from 21 wards.
Bath and North East Somerset Council is the local council for the district of Bath and North East Somerset in Somerset, England.
West Berkshire Council is the local authority of West Berkshire in Berkshire, England. It is a unitary authority, having the powers of a non-metropolitan county and district council combined. West Berkshire is divided into 24 wards, electing 43 councillors. The council was created in 1974 as the Newbury District Council. On 1 April 1998 it was renamed West Berkshire Council and since then has been a unitary authority, assuming the powers and functions of the abolished Berkshire County Council within the district. In the 2023 election the Liberal Democrats won 29 out of 43 seats.
The 2003 Windsor and Maidenhead Borough Council election took place on 1 May 2003 to elect members of Windsor and Maidenhead Unitary Council in Berkshire, England. The whole council was up for election with boundary changes since the last election in 2000 reducing the number of seats by 1. The Liberal Democrats gained overall control of the council from no overall control.
The 2003 West Berkshire Council election took place on 1 May 2003 to elect members of West Berkshire Council in Berkshire, England. The whole council was up for election with boundary changes since the last election in 2000 reducing the number of seats by two. The Liberal Democrats lost overall control of the council to no overall control.
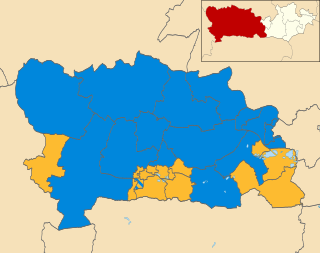
The 2011 West Berkshire Council election took place on 5 May 2011 to elect members of West Berkshire Council in Berkshire, England. The whole council was up for election and the Conservative Party stayed in overall control of the council.
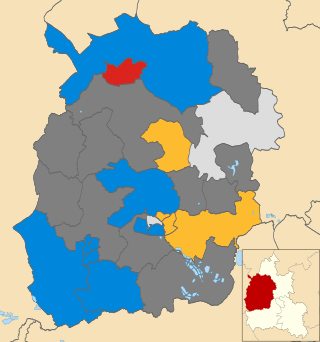
The 2002 West Oxfordshire District Council election took place on 2 May 2002 to elect members of West Oxfordshire District Council in Oxfordshire, England. The whole council was up for election with boundary changes since the last election in 2000. The Conservative Party stayed in overall control of the council.
The 2003 West Oxfordshire District Council election took place on 1 May 2003 to elect members of West Oxfordshire District Council in Oxfordshire, England. One third of the council was up for election and the Conservative Party stayed in overall control of the council.
Elections to Colchester Borough Council took place on 5 May 2016. Colchester Borough Council normally elects one third of its councillors each year, however, due to boundary changes, the whole council is up for election.
The 2016 Exeter City Council election took place on 5 May 2016, to elect members of Exeter City Council in England. Following boundary changes, the entire council was up for election, and all 13 wards were contested, each electing three councillors. The election was held concurrently with other local elections held in England on the 5 May.
The 2019 Bath and North East Somerset Council election was held on 2 May 2019 to elect members of Bath and North East Somerset Council in England.
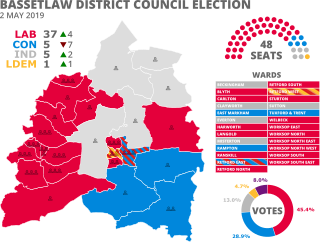
The 2019 Bassetlaw District Council election took place on 2 May 2019 to elect all 48 members of Bassetlaw District Council in England. This was on the same day as other local elections.
The 2019 North Somerset Council election took place on 2 May 2019 to elect members of North Somerset Council in England.
The 2022 Camden London Borough Council election took place on 5 May 2022. All 55 members of Camden London Borough Council were elected. The elections took place alongside local elections in the other London boroughs and elections to local authorities across the United Kingdom.
Elections for the London Borough of Merton were held on 5 May 2022 to elect all 57 members of Merton London Borough Council in England. The elections took place alongside local elections in the other London boroughs and elections to local authorities across the United Kingdom.
The 2023 Guildford Borough Council election was held on 4 May 2023, to elect all 48 seats to the Guildford Borough Council in Surrey, England as part of the 2023 local elections. The results saw the Liberal Democrat take overall control of Guildford Borough Council.