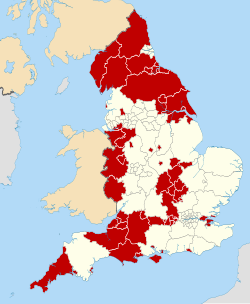
Slough Borough Council is the local authority for Slough, a unitary authority in Berkshire, England.
Year | Conservative | Labour | Liberal Democrats [a] | UKIP | Independents & Others | Council control after election | ||
---|---|---|---|---|---|---|---|---|
Local government reorganisation; council established (40 seats) | ||||||||
1973 | 2 | 34 | 4 | – | 0 | Labour | ||
1976 | 27 | 11 | 2 | – | 0 | Conservative | ||
1979 [2] | 21 | 14 | 5 | – | 0 | Conservative | ||
New ward boundaries (39 seats) [3] | ||||||||
1983 | 15 | 21 | 3 | – | 0 | Labour | ||
1984 | 15 | 21 | 3 | – | 0 | Labour | ||
1986 | 12 | 24 | 3 | – | 0 | Labour | ||
1987 | 11 | 24 | 3 | – | 0 | Labour | ||
1988 | 8 | 26 | 5 | – | 0 | Labour | ||
1990 | 6 | 28 | 5 | – | 0 | Labour | ||
1991 [4] | 4 | 30 | 5 | – | 0 | Labour | ||
1992 | 5 | 29 | 5 | – | 0 | Labour | ||
1994 | 4 | 28 | 0 | 0 | 7 | Labour | ||
1995 [5] | 3 | 30 | 1 | 0 | 6 | Labour | ||
1996 | 0 | 36 | 3 | 0 | 1 | Labour | ||
Slough becomes a unitary authority; new ward boundaries (41 seats) | ||||||||
1997 | 4 | 34 | 3 | 0 | 0 | Labour | ||
1999 | 6 | 32 | 0 | 0 | 3 | Labour | ||
2000 | 7 | 27 | 1 | 0 | 6 | Labour | ||
2001 | 8 | 26 | 1 | 0 | 6 | Labour | ||
2002 | 6 | 27 | 2 | 0 | 6 | Labour | ||
2003 | 6 | 26 | 2 | 0 | 7 | Labour | ||
New ward boundaries (41 seats) [6] | ||||||||
2004 | 9 | 15 | 6 | 0 | 11 [b] | No overall control | ||
2006 | 6 | 18 | 5 | 0 | 11 [b] | No overall control | ||
2007 | 7 | 19 | 4 | 0 | 11 [b] | No overall control | ||
2008 | 6 | 23 | 3 | 0 | 9 [b] | No overall control | ||
2010 | 8 | 24 | 3 | 0 | 6 [c] | Labour | ||
2011 | 9 | 27 | 2 | 0 | 3 [d] | Labour | ||
2012 | 5 | 35 | 1 | 0 | 0 | Labour | ||
New ward boundaries (42 seats) [7] | ||||||||
2014 | 8 | 33 | 0 | 1 | 0 | Labour | ||
2015 | 9 | 32 | 0 | 0 | 1 | Labour | ||
2016 | 8 | 33 | 0 | 0 | 1 | Labour | ||
2018 | 6 | 35 | 0 | 0 | 1 | Labour | ||
2019 | 4 | 37 | 0 | 0 | 0 | Labour | ||
2021 | 5 | 34 | 0 | 0 | 3 | Labour | ||
2022 | 6 | 33 | 0 | 0 | 3 | Labour | ||
New ward boundaries (42 seats) [8] [e] | ||||||||
2023 | 21 | 18 | 3 | 0 | 0 | No overall control | ||
Party | Candidate | Votes | % | ±% | |
---|---|---|---|---|---|
Labour | D.A. Hewitt | 442 | 60.22 | N/A | |
Conservative | Mrs M.E. Collins | 206 | 28.07 | N/A | |
Liberal Democrats | P.L. Bayliss | 86 | 11.72 | N/A | |
Majority | 236 | 32.15 | N/A | ||
Turnout | 4,858 | 15.11 | N/A | ||
Labour hold | Swing | N/A |
Resignation of Mrs B. L. Lopez (Labour).
Party | Candidate | Votes | % | ±% | |
---|---|---|---|---|---|
Conservative | Mrs J.T. Long | 799 | 59.85 | N/A | |
Labour | B.B. Mittal | 352 | 26.37 | N/A | |
Liberal Democrats | Mrs S.A. Jenkins | 68 | 5.09 | N/A | |
P.P. Whitmore | 60 | 4.49 | N/A | ||
Independent Labour | D.A.J. Alford | 36 | 2.70 | N/A | |
Liberal | P.E. Bradshaw | 20 | 1.50 | N/A | |
Majority | 447 | 33.48 | N/A | ||
Turnout | 4,931 | 27.07 | N/A | ||
Conservative hold | Swing | N/A |
Death of M. G. Long (Conservative).
Party | Candidate | Votes | % | ±% | |
---|---|---|---|---|---|
Britwellian | Patrick Shine | 488 | 53.80 | N/A | |
Labour | Ms May Dodds | 262 | 28.89 | N/A | |
Britwellian | O. Isemia | 157 | 24.92 | N/A | |
Majority | 226 | 32.15 | N/A | ||
Turnout | 6,376 | 14.26 | N/A | ||
Britwellian gain from Britwellian | Swing | N/A |
Death of Mrs Mavis L. Gallick (Britwellian).
Party | Candidate | Votes | % | ±% | |
---|---|---|---|---|---|
Britwellian | Paul Janik | 539 | 63.49 | +9.69 | |
Labour | Ms J.R. Rock | 310 | 36.51 | +7.62 | |
Majority | 229 | 26.97 | −5.18 | ||
Turnout | 6,319 | 13.50 | −0.76 | ||
Britwellian gain from Labour | Swing | N/A |
Death of Dennis McCarthy (Labour).
Party | Candidate | Votes | % | ±% | |
---|---|---|---|---|---|
Conservative | Diana Victoria Coad | 805 | 50.50 | +13.79 | |
Labour | Sharanjeet Kaur Sandhu | 682 | 42.79 | +6.42 | |
Independent | Dominic James Ashford | 107 | 6.71 | +0.72 | |
Majority | 123 | 7.72 | +7.37 | ||
Turnout | ... | 29.97 | −8.49 | ||
Conservative gain from Ind. Langley Res. | Swing | N/A |
Resignation of Mrs P. F. Key (Independent Langley Residents).
Party | Candidate | Votes | % | ±% | |
---|---|---|---|---|---|
Labour | Mohammed Nazir | 1,300 | 59.0 | −21.4 | |
Independent | Pervez Choudhury | 764 | 34.7 | +34.7 | |
UKIP | Allan Deverill | 72 | 3.3 | +3.3 | |
Independent | Ivan Dukes | 68 | 3.1 | +3.1 | |
Majority | 536 | 24.3 | |||
Turnout | 2,204 | ||||
Labour hold | Swing |
Disqualification of Azhar Qureshi (Labour) for non-attendance.
Party | Candidate | Votes | % | ±% | |
---|---|---|---|---|---|
Conservative | Paul Kelly | 1,036 | 49.0 | +3.6 | |
Labour | Jemma Davis | 899 | 42.5 | +4.7 | |
Liberal Democrats | Gary Griffin | 129 | 6.1 | +6.1 | |
Independent | Paul Janik | 52 | 2.5 | +2.5 | |
Majority | 137 | 6.5 | |||
Turnout | 2,116 | ||||
Conservative hold | Swing |
Death of Darren Morris (Conservative ).