Results maps
 2003 results map
 2007 results map
 2011 results map
 2015 results map
 2019 results map
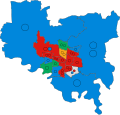 2023 results map
Darlington Borough Council elections are held every four years. Darlington Borough Council is the local authority for the unitary authority of Darlington in County Durham, England. Until 1 April 1997 it was a non-metropolitan district.
| Labour | Conservatives | Liberal Democrats | Greens | Independent | Total | |
|---|---|---|---|---|---|---|
| 1973 [1] | 28 | 8 | 8 | 0 | 5 | 49 |
| 1976 [2] | 15 | 30 | 0 | 0 | 5 | 50 |
| 1979 [3] | 29 | 14 | 1 | 0 | 8 | 52 |
| 1983 [4] | 27 | 20 | 2 | 0 | 3 | 52 |
| 1987 [5] | 24 | 24 | 0 | 0 | 4 | 52 |
| 1991 [6] | 29 | 19 | 2 | 0 | 2 | 52 |
| 1995 [7] | 35 | 14 | 2 | 0 | 1 | 52 |
| 1996 [8] | 36 | 13 | 2 | 0 | 1 | 52 |
| 1999 [9] | 35 | 15 | 2 | 0 | 0 | 52 |
| 2003 [10] | 35 | 15 | 2 | 0 | 0 | 52 |
| 2007 [11] | 29 | 18 | 6 | 0 | 0 | 53 |
| 2011 [12] | 34 | 14 | 5 | 0 | 0 | 53 |
| 2015 [13] | 29 | 17 | 3 | 0 | 1 | 50 |
| 2019 [14] | 20 | 22 | 3 | 2 | 3 | 50 |
| 2023 [15] | 25 | 14 | 3 | 7 | 1 | 50 |
From 1915 to 1974, Darlington was a county borough, independent of any county council. [16] Under the Local Government Act 1972 it had its territory enlarged and became a non-metropolitan district, with Durham County Council providing county-level services. [17] [18] [19] The first election to the reconstituted borough council was held in 1973, initially operating as a shadow authority before coming into its revised powers on 1 April 1974. On 1 April 1997 the district became a unitary authority, regaining its independence from Durham County Council. Political control of the council since 1973 has been held by the following parties: [20]
Non-metropolitan district
| Party in control | Years | |
|---|---|---|
| Labour | 1973–1976 | |
| Conservative | 1976–1979 | |
| Labour | 1979–1987 | |
| No overall control | 1987–1991 | |
| Labour | 1991–1997 | |
Unitary authority
| Party in control | Years | |
|---|---|---|
| Labour | 1997–2019 | |
| No overall control | 2019–present | |
The leaders of the council since 1991 have been: [21]
| Councillor | Party | From | To | |
|---|---|---|---|---|
| John Williams [22] | Labour | 1991 | 8 May 2011 | |
| Bill Dixon | Labour | 19 May 2011 | 19 Jul 2018 | |
| Steve Harker | Labour | 19 Jul 2018 | 23 May 2019 | |
| Heather Scott | Conservative | 23 May 2019 | 19 May 2022 | |
| Jonathan Dulston | Conservative | 19 May 2022 | 4 May 2023 | |
| Steve Harker | Labour | 4 May 2023 | ||


| Party | Candidate | Votes | % | ±% | |
|---|---|---|---|---|---|
| Labour | 1,844 | 74.0 | −7.4 | ||
| Conservative | 648 | 26.0 | +7.4 | ||
| Majority | 1,196 | 48.0 | |||
| Turnout | 2,492 | ||||
| Labour hold | Swing | ||||
| Party | Candidate | Votes | % | ±% | |
|---|---|---|---|---|---|
| Labour | 836 | 72.6 | |||
| Conservative | 315 | 27.4 | |||
| Majority | 521 | 45.2 | |||
| Turnout | 1,151 | ||||
| Labour hold | Swing | ||||
| Party | Candidate | Votes | % | ±% | |
|---|---|---|---|---|---|
| Liberal Democrats | 471 | 53.6 | −4.4 | ||
| Labour | 326 | 37.1 | −4.9 | ||
| Conservative | 81 | 9.2 | +9.2 | ||
| Majority | 145 | 16.5 | |||
| Turnout | 878 | ||||
| Liberal Democrats hold | Swing | ||||
| Party | Candidate | Votes | % | ±% | |
|---|---|---|---|---|---|
| Labour | 365 | 38.3 | −24.8 | ||
| Conservative | 331 | 34.7 | +11.3 | ||
| Liberal Democrats | 245 | 19.5 | +19.5 | ||
| BNP | 44 | 4.6 | +4.6 | ||
| Independent | 28 | 2.9 | −10.5 | ||
| Majority | 34 | 3.6 | |||
| Turnout | 1,013 | ||||
| Labour hold | Swing | ||||
| Party | Candidate | Votes | % | ±% | |
|---|---|---|---|---|---|
| Liberal Democrats | Frederick Lawton | 789 | 48.5 | +3.6 | |
| Labour | Jenny Chapman | 571 | 35.1 | −3.0 | |
| Conservative | Ian Galletley | 119 | 7.3 | −2.5 | |
| BNP | Nigel Nevison | 87 | 5.3 | −1.9 | |
| UKIP | Edward Davies | 61 | 3.7 | +3.7 | |
| Majority | 218 | 13.4 | |||
| Turnout | 1,627 | 38.8 | |||
| Liberal Democrats hold | Swing | ||||
| Party | Candidate | Votes | % | ±% | |
|---|---|---|---|---|---|
| Liberal Democrats | Martin Swainston | 527 | 42.2 | +42.2 | |
| Conservative | George Lawman | 379 | 30.4 | −48.0 | |
| Independent | Julie Jones | 297 | 23.8 | +23.8 | |
| Labour | Amanda McEwan | 45 | 3.6 | −7.2 | |
| Majority | 148 | 2.2 | |||
| Turnout | 1,248 | 44.2 | |||
| Liberal Democrats gain from Conservative | Swing | ||||
| Party | Candidate | Votes | % | ±% | |
|---|---|---|---|---|---|
| Conservative | Ian Galletley | 624 | 47.6 | −9.7 | |
| Liberal Democrats | Garry Hinton | 511 | 39.0 | +17.8 | |
| Labour | Elaine Hope | 175 | 13.4 | −8.1 | |
| Majority | 113 | 8.6 | |||
| Turnout | 1,310 | 42.8 | |||
| Conservative hold | Swing | ||||
| Party | Candidate | Votes | % | ±% | |
|---|---|---|---|---|---|
| Liberal Democrats | Anne-Marie Curry | 561 | 50.8 | −4.1 | |
| Labour | John Vasey | 262 | 23.7 | +0.0 | |
| Conservative | George Jenkinson | 115 | 10.4 | −1.0 | |
| BNP | John Hoodless | 106 | 9.6 | −0.3 | |
| Independent | Stephen Jones | 60 | 5.4 | +5.4 | |
| Majority | 299 | 27.1 | |||
| Turnout | 1,104 | 24.2 | |||
| Liberal Democrats hold | Swing | ||||
| Party | Candidate | Votes | % | ±% | |
|---|---|---|---|---|---|
| Labour | Jan Cossins | 388 | 45.1 | +4.0 | |
| Liberal Democrats | Brian Jefferson | 347 | 40.3 | +19.4 | |
| Conservative | David Davies | 84 | 9.8 | −14.8 | |
| BNP | Paul Thompson | 41 | 4.8 | −8.6 | |
| Majority | 41 | 4.8 | |||
| Turnout | 860 | 29.3 | |||
| Labour hold | Swing | ||||
| Party | Candidate | Votes | % | ±% | |
|---|---|---|---|---|---|
| Conservative | Gillian Cartwright | 694 | 43.8 | +3.2 | |
| Labour | Helen Crumbie | 607 | 38.3 | −21.1 | |
| Liberal Democrats | Hilary Allen | 142 | 9.0 | +9.0 | |
| UKIP | Daniel Phillip Fairclough | 95 | 6.0 | +6.0 | |
| England First | Paul Thompson | 47 | 3.0 | +3.0 | |
| Majority | 87 | 5.5 | |||
| Turnout | 1,585 | 33.8 | |||
| Conservative gain from Labour | Swing | ||||
| Party | Candidate | Votes | % | ±% | |
|---|---|---|---|---|---|
| Liberal Democrats | Martin Swainson | 474 | 43.7 | −12.9 | |
| Conservative | Christopher Brownbridge | 436 | 40.2 | +7.9 | |
| Labour | Stephen Rose | 144 | 13.3 | +2.1 | |
| UKIP | David Davies | 31 | 2.9 | +2.9 | |
| Majority | 38 | 3.5 | |||
| Turnout | 1,085 | 36.5 | |||
| Liberal Democrats hold | Swing | ||||
| Party | Candidate | Votes | % | ±% | |
|---|---|---|---|---|---|
| Labour | Helen Crumbie | 426 | 63.4 | −5.0 | |
| Liberal Democrats | Howard Jones | 129 | 19.2 | +19.2 | |
| Conservative | Lewis Cairns | 117 | 17.4 | −14.2 | |
| Majority | 297 | 44.2 | |||
| Turnout | 672 | 22.6 | |||
| Labour hold | Swing | ||||
| Party | Candidate | Votes | % | ±% | |
|---|---|---|---|---|---|
| Conservative | Pauline Culley | 647 | 40.7 | −28.1 | |
| Labour | Jackie Saint | 614 | 38.6 | +7.5 | |
| UKIP | Charlotte Bull | 235 | 14.8 | +14.8 | |
| Liberal Democrats | Hilary Allen | 93 | 5.9 | +5.9 | |
| Majority | 33 | 2.1 | |||
| Turnout | 1,589 | 51.8 | |||
| Conservative hold | Swing | ||||
| Party | Candidate | Votes | % | ±% | |
|---|---|---|---|---|---|
| Conservative | Alan Marshall | 652 | 60.7 | +14.4 | |
| Labour | Edwin Heslop | 285 | 26.5 | −5.0 | |
| Liberal Democrats | Sarah Jordan | 111 | 10.3 | n/a | |
| Green | Kathryn Barley | 26 | 2.4 | −4.9 | |
| Majority | 367 | 34.2 | |||
| Turnout | 1,074 | 33.7 | |||
| Conservative hold | Swing | ||||
| Party | Candidate | Votes | % | ±% | |
|---|---|---|---|---|---|
| Labour | Sharifah Rahman | 249 | 44.8 | −1.9 | |
| Conservative | Jonathan Dulston | 230 | 41.4 | +12.4 | |
| Independent | Kevin Brack | 46 | 8.3 | n/a | |
| Green | Michael McTimoney | 20 | 3.6 | −8.9 | |
| Liberal Democrats | Harry Longmoor | 11 | 2.0 | −9.9 | |
| Majority | 19 | 3.4 | |||
| Turnout | 556 | 19.5 | |||
| Labour hold | Swing | ||||
| Party | Candidate | Votes | % | ±% | |
|---|---|---|---|---|---|
| Labour | Edwin Heslop | 555 | 51.0 | +7.9 | |
| Conservative | Scott Durham | 239 | 22.0 | −2.8 | |
| Liberal Democrats | Charlotte Curry | 104 | 9.6 | −5.5 | |
| Independent | Joel Wilks | 93 | 8.5 | n/a | |
| For Britain | Kevin Brack | 63 | 5.8 | n/a | |
| Green | Terri Hankinson | 34 | 3.1 | −14.0 | |
| Majority | 316 | 29.0 | |||
| Turnout | 1,088 | 23.0 | |||
| Labour hold | Swing | ||||
| Party | Candidate | Votes | % | ±% | |
|---|---|---|---|---|---|
| Conservative | Jack Sowerby | 971 | 49.9 | +4.7 | |
| Green | Thomas Robinson | 809 | 41.6 | +24.4 | |
| Labour | John Sloss | 120 | 6.2 | −5.7 | |
| Liberal Democrats | Vicky Atkinson | 32 | 1.6 | +1.6 | |
| For Britain | Monty Brack | 14 | 0.7 | +0.7 | |
| Majority | 162 | 8.3 | |||
| Turnout | 1,946 | ||||
| Conservative hold | Swing | ||||
| Party | Candidate | Votes | % | ±% | |
|---|---|---|---|---|---|
| Conservative | David Willis | 466 | 42.2 | +10.4 | |
| Labour | Mandy Porter | 360 | 32.6 | −13.6 | |
| Independent | Cheryl Pattison | 201 | 18.2 | +18.2 | |
| Green | Mike McTimoney | 38 | 3.4 | −18.6 | |
| Liberal Democrats | Scott Wood | 27 | 2.4 | +2.4 | |
| For Britain | Janys Gandy | 11 | 1.0 | +1.0 | |
| Majority | 106 | 9.6 | |||
| Turnout | 1,103 | ||||
| Conservative gain from Labour | Swing | ||||
| Party | Candidate | Votes | % | ±% | |
|---|---|---|---|---|---|
| Reform | Michael Walker | 341 | 37.7 | ||
| Conservative | Kyle Bartch | 157 | 17.3 | ||
| Liberal Democrats | Simon Thorley | 157 | 17.3 | ||
| Labour | Jonnie Vasey | 152 | 16.8 | ||
| Green | Louise Maddison | 89 | 9.8 | ||
| Independent | Monty Brack | 9 | 1.0 | ||
| Majority | 184 | 20.3 | |||
| Turnout | 905 | ||||
| Reform gain from Labour | Swing | ||||
{{cite web}}: Missing or empty |title= (help){{cite web}}: Missing or empty |title= (help){{cite web}}: Missing or empty |title= (help){{cite web}}: Missing or empty |title= (help){{cite web}}: Missing or empty |title= (help){{cite web}}: Missing or empty |title= (help){{cite web}}: Missing or empty |title= (help){{cite web}}: Missing or empty |title= (help){{cite web}}: Missing or empty |title= (help){{cite web}}: Missing or empty |title= (help){{cite web}}: Missing or empty |title= (help){{cite web}}: Missing or empty |title= (help)