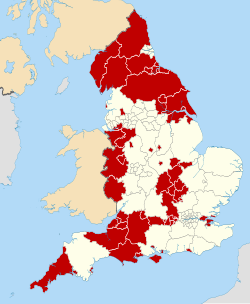
Results maps
 2008 results map
 2011 results map
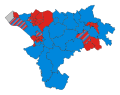 2015 results map
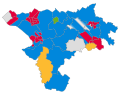 2019 results map
 2023 results map
Cheshire West and Chester Council elections are held every four years. Cheshire West and Chester Council is the local authority for the unitary authority of Cheshire West and Chester in Cheshire, England. Since the last boundary changes in 2019, 70 councillors have been elected from 45 wards. [1]
| Election | Conservative | Independent | Green | Labour | Liberal Democrats | Unaligned Independent | Winsford Salt of the Earth | Total | |||||||
|---|---|---|---|---|---|---|---|---|---|---|---|---|---|---|---|
| 2008 | 55 | 0 | 0 | 13 | 4 | 0 | 0 | 72 | |||||||
| 2011 | 42 | 0 | 0 | 32 | 1 | 0 | 0 | 75 | |||||||
| 2015 | 36 | 1 | 0 | 38 | 0 | 0 | 0 | 75 | |||||||
| 2019 | 28 | 4 | 1 | 35 | 2 | 0 | 0 | 70 | |||||||
| 2023 | 23 | 5 | 2 | 39 | 1 | 0 | 0 | 70 | |||||||
| Current | 23 | 2 | 2 | 37 | 1 | 3 | 2 | 70 | |||||||


| Party | Candidate | Votes | % | ±% | |
|---|---|---|---|---|---|
| Labour | Lynn Clare | 686 | 71.6 | − | |
| Conservative | Graham Pritchard | 102 | 10.6 | ||
| Socialist Labour | Kenny Spain | 65 | 6.8 | ||
| UKIP | Andrew Roberts | 64 | 6.8 | ||
| Liberal Democrats | Hilary Chrusciezl | 41 | 4.3 | ||
| Majority | 584 | 61.0 | |||
| Turnout | 958 | 15.3 | |||
| Labour hold | Swing | ||||
| Party | Candidate | Votes | % | ±% | |
|---|---|---|---|---|---|
| Labour | Martyn Delaney | 614 | 44.8 | −7.3% | |
| Conservative | Kate Vaughan | 469 | 34.2 | −6.2% | |
| UKIP | Charles Dodman | 131 | 9.6 | +9.6% | |
| Green | John McNamara | 86 | 6.3 | +6.3% | |
| Liberal Democrats | Mark Gant | 70 | 5.1 | −2.4% | |
| Majority | 145 | 10.6 | |||
| Turnout | 1,370 | ||||
| Labour hold | Swing | ||||
| Party | Candidate | Votes | % | ±% | |
|---|---|---|---|---|---|
| Labour | Sam Naylor | 525 | 39.5 | ||
| Conservative | Jim Sinar | 418 | 31.4 | ||
| UKIP | Amos Wright | 307 | 23.1 | ||
| Liberal Democrats | Alice Chapman | 80 | 6.0 | ||
| Majority | 107 | 8.0 | |||
| Turnout | 1,330 | ||||
| Labour hold | Swing | ||||
| Party | Candidate | Votes | % | ±% | |
|---|---|---|---|---|---|
| Labour | Ben Powell | 1,556 | 59.1 | 0% | |
| Conservative | Jack Jackson | 574 | 21.8 | +4% | |
| Independent | Steve Ingram | 434 | 16.5 | +16.5% | |
| Liberal Democrats | Lizzie Jewkes | 70 | 2.7 | +2.7% | |
| Majority | 982 | 37.3 | |||
| Turnout | 2,634 | 25.4 | −35.8% | ||
| Labour hold | Swing | ||||
| Party | Candidate | Votes | % | ±% | |
|---|---|---|---|---|---|
| Labour | Edwardson, Mike | 1,447 | 82.9 | ||
| Conservative | Griffiths, Robert Douglas | 239 | 13.7 | ||
| Green | Roberts, Matthew Joseph | 60 | 3.4 | ||
| Majority | 1208 | 69.2 | |||
| Turnout | 1746 | 24.51 | |||
| Labour hold | Swing | ||||
| Party | Candidate | Votes | % | ±% | |
|---|---|---|---|---|---|
| Conservative | Christopher Basey | 1,481 | 44.4 | −3.2 | |
| Labour | Michael Garvey | 1,296 | 38.8 | +13.9 | |
| Liberal Democrats | Patrick Eakin | 384 | 11.5 | +5.2 | |
| Green | Sian Day | 176 | 5.3 | −4.0 | |
| Majority | 185 | 5.5 | |||
| Turnout | 3,337 | ||||
| Conservative hold | Swing | ||||
| Party | Candidate | Votes | % | ±% | |
|---|---|---|---|---|---|
| Labour | Keith Millar | 875 | 57.0 | −5.2 | |
| Conservative | Steve Wastell | 579 | 37.7 | −0.1 | |
| Liberal Democrats | John Edwards | 80 | 5.2 | +5.2 | |
| Majority | 296 | 19.3 | |||
| Turnout | 1,534 | ||||
| Labour hold | Swing | ||||
| Party | Candidate | Votes | % | ±% | |
|---|---|---|---|---|---|
| Labour | John Stockton | 576 | 70.2 | −9.5 | |
| Green | Katie Grannell | 73 | 8.9 | +8.9 | |
| Independent | Jonathan Starkey | 64 | 7.8 | +7.8 | |
| Party of Women | Sally James | 42 | 5.1 | +5.1 | |
| Liberal Democrats | Elizabeth Jewkes | 35 | 4.3 | −4.7 | |
| Conservative | Luke Sharples | 31 | 3.8 | −7.5 | |
| Majority | 503 | 61.3 | |||
| Turnout | 821 | ||||
| Labour hold | Swing | ||||
| Party | Candidate | Votes | % | ±% | |
|---|---|---|---|---|---|
| Labour | Rachel Waterman | 978 | 48.4 | −10.8 | |
| Reform UK | Emma Guy | 366 | 18.1 | +12.6 | |
| Conservative | Penny Hitch | 363 | 18.0 | −11.9 | |
| Liberal Democrats | John Harding | 163 | 8.1 | +2.7 | |
| Green | Jonathan Stutfield | 151 | 7.5 | +7.5 | |
| Majority | 612 | 30.3 | |||
| Turnout | 2,021 | ||||
| Labour hold | Swing | ||||
| Party | Candidate | Votes | % | ±% | |
|---|---|---|---|---|---|
| Labour | Kris Fisher | 602 | 35.8 | −32.8 | |
| Reform UK | Jason Moorcroft | 539 | 32.0 | +32.0 | |
| Independent | Ray McHale | 231 | 13.7 | +13.7 | |
| Conservative | Nicholas Hebson | 132 | 7.8 | −16.8 | |
| Liberal Democrats | Lizzie Jewkes | 121 | 7.2 | +0.5 | |
| Green | Paul Bowers | 58 | 3.4 | +3.4 | |
| Majority | 63 | 3.7 | |||
| Turnout | 1,638 | ||||
| Labour hold | Swing | ||||