This article needs additional citations for verification .(June 2018) |
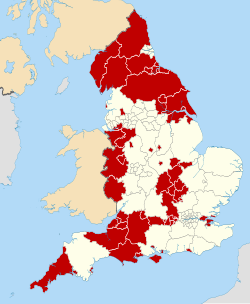
Northumberland County Council elections are held every four years. Northumberland County Council is the local authority for the unitary authority of Northumberland in England. Since the last boundary changes in 2013, 67 councillors have been elected from 66 wards. [1]
Year | Conservative | Labour | Liberal Democrats | Liberal | Green | Independent | Control |
---|---|---|---|---|---|---|---|
1973 | 10 | 28 | - | 3 | - | 21 | No overall control |
1977 | 20 | 21 | - | 0 | - | 21 [a] | No overall control |
1981 | 14 | 34 | - | 15 | - | 3 | Labour |
1985 | 12 | 30 | - | 20 | - | 4 [b] | No overall control |
1989 | 17 | 38 | 8 | - | - | 3 | Labour |
1993 | 13 | 39 | 11 | - | 0 | 5 | Labour |
1997 | 13 | 43 | 8 | - | 0 | 2 | Labour |
2001 | 17 | 38 | 9 | - | 0 | 3 | Labour |
2005 | 14 | 35 | 14 | - | 0 | 4 | Labour |
2008 | 17 | 17 | 26 | - | 0 | 7 | No overall control |
2013 | 21 | 32 | 11 | - | 0 | 3 | No overall control |
2017 | 33 | 24 | 3 | - | 0 | 7 [c] | No overall control |
2021 | 34 | 21 | 3 | - | 2 | 7 | Conservative |
Party | Candidate | Votes | % | ±% | |
---|---|---|---|---|---|
Conservative | 546 | 35.8 | +0.5 | ||
Liberal Democrats | 420 | 27.5 | −9.6 | ||
Labour | 307 | 20.1 | −7.5 | ||
Independent | 253 | 16.8 | +16.8 | ||
Majority | 126 | 8.3 | |||
Turnout | 1,526 | ||||
Conservative gain from Liberal Democrats | Swing |
Party | Candidate | Votes | % | ±% | |
---|---|---|---|---|---|
Liberal Democrats | 720 | 58.7 | +58.7 | ||
Labour | 483 | 39.4 | −39.8 | ||
Conservative | 23 | 1.9 | −18.9 | ||
Majority | 237 | 19.3 | |||
Turnout | 1,226 | ||||
Liberal Democrats gain from Labour | Swing |
Party | Candidate | Votes | % | ±% | |
---|---|---|---|---|---|
Labour | 574 | 58.0 | −21.3 | ||
Liberal Democrats | 391 | 39.5 | +18.8 | ||
Conservative | 24 | 2.4 | +2.4 | ||
Majority | 183 | 18.5 | |||
Turnout | 989 | 30.0 | |||
Labour hold | Swing |
Party | Candidate | Votes | % | ±% | |
---|---|---|---|---|---|
Liberal Democrats | Leslie Cassie | 473 | 40.7 | +0.3 | |
Conservative | David Bawn | 304 | 26.2 | +3.8 | |
Green | Nicholas Best | 154 | 13.3 | −3.0 | |
Labour | Ian Fleming | 144 | 12.4 | −8.5 | |
Independent | John Beynon | 87 | 7.5 | +7.5 | |
Majority | 169 | 14.5 | −3.5 | ||
Turnout | 1,162 | 33.9 | −34.0 | ||
Liberal Democrats hold | Swing |
Party | Candidate | Votes | % | ±% | |
---|---|---|---|---|---|
Labour | 841 | 67.2 | +3.0 | ||
Liberal Democrats | 411 | 32.8 | +6.3 | ||
Majority | 430 | 34.4 | |||
Turnout | 1,252 | ||||
Labour hold | Swing |
Party | Candidate | Votes | % | ±% | |
---|---|---|---|---|---|
Conservative | Eileen Armstrong | 843 | 62.6 | +2.0 | |
Liberal Democrats | Andrew Duffield | 403 | 29.9 | +1.6 | |
Labour | Andrew Avery | 100 | 7.4 | +2.9 | |
Majority | 440 | 32.7 | |||
Turnout | 1,346 | ||||
Conservative hold | Swing |
Party | Candidate | Votes | % | ±% | |
---|---|---|---|---|---|
Liberal Democrats | Kate Cairns | 742 | 49.6 | +49.6 | |
Conservative | John Hope | 352 | 23.5 | +0.7 | |
Independent | Wendy Pattison | 208 | 13.9 | +13.9 | |
UKIP | Michael Weatheritt | 146 | 9.8 | −3.1 | |
Labour | Nicola Morrison | 48 | 3.2 | +3.2 | |
Majority | 390 | 26.1 | |||
Turnout | 1,496 | ||||
Liberal Democrats gain from Independent | Swing |
Party | Candidate | Votes | % | ±% | |
---|---|---|---|---|---|
Labour | Mark Purvis | 508 | 69.5 | −21.2 | |
UKIP | Peter Curtis | 102 | 14.0 | +14.0 | |
Liberal Democrats | Andy McGregor | 82 | 11.2 | +11.2 | |
Conservative | Chris Galley | 39 | 5.3 | −4.0 | |
Majority | 406 | 55.5 | |||
Turnout | 731 | ||||
Labour hold | Swing |
Party | Candidate | Votes | % | ±% | |
---|---|---|---|---|---|
Independent | Derek Kennedy | 501 | 36.6 | +36.6 | |
Conservative | Tom Gillanders | 454 | 33.2 | −15.1 | |
Labour | Nuala Rose | 200 | 14.6 | −0.3 | |
Independent | Anne Pickering | 125 | 9.1 | +9.1 | |
Green | Lee Williscroft-Ferris | 89 | 6.5 | +6.5 | |
Majority | 47 | 3.4 | |||
Turnout | 1,369 | ||||
Independent gain from Conservative | Swing |
Party | Candidate | Votes | % | ±% | |
---|---|---|---|---|---|
Labour | Leslie Bowman | 916 | 57.6 | +7.4 | |
Conservative | Maureen Levy | 510 | 32.1 | −7.2 | |
Liberal Democrats | Anita Romer | 164 | 10.3 | +10.3 | |
Majority | 406 | 25.5 | |||
Turnout | 1,590 | ||||
Labour hold | Swing |
Party | Candidate | Votes | % | ±% | |
---|---|---|---|---|---|
Liberal Democrats | Suzanne Fairless-Aitken | 584 | 47.3 | +11.8 | |
Conservative | Stephen Ball | 370 | 30.0 | −13.8 | |
Labour | Jonathan Wheeler | 154 | 12.5 | −8.1 | |
Independent | Lee Williscroft-Ferris | 127 | 10.3 | +10.3 | |
Majority | 214 | 17.3 | |||
Turnout | 1,235 | ||||
Liberal Democrats gain from Conservative | Swing |
Party | Candidate | Votes | % | ±% | |
---|---|---|---|---|---|
Conservative | Eve Chicken | 702 | 55.6 | +1.1 | |
Labour | Christine Savage | 511 | 40.5 | −5.0 | |
Green | Clive Robson | 29 | 2.3 | +2.3 | |
Liberal Democrats | Alisdair Gibbs-Barton | 21 | 1.7 | +1.7 | |
Majority | 191 | 15.1 | |||
Turnout | 1,263 | ||||
Conservative hold | Swing |
Party | Candidate | Votes | % | ±% | |
---|---|---|---|---|---|
Conservative | Alan Smith | 513 | 43.5 | −15.6 | |
Labour | James Gillooly | 371 | 31.5 | +1.4 | |
Reform UK | Mark Owen | 177 | 15.0 | +15.0 | |
Independent | Libby Cripps | 67 | 5.7 | +5.7 | |
Liberal Democrats | Andy McGregor | 23 | 2.0 | +2.0 | |
Green | Paul Evans | 22 | 1.9 | +1.9 | |
Independent | Dawn Furness | 6 | 0.5 | +0.5 | |
Majority | 142 | 12.0 | |||
Turnout | 1,179 | ||||
Conservative hold | Swing |
Herefordshire Council elections are held every four years. Herefordshire Council is the local authority for the unitary authority and ceremonial county of Herefordshire in England. Since the last boundary changes in 2015, 53 councillors have been elected from 53 wards.
Cornwall Council in England, UK, was established in 2009 and is elected every four years. From 1973 to 2005 elections were for Cornwall County Council, with the first election for the new unitary Cornwall Council held in June 2009. This election saw 123 members elected, replacing the previous 82 councillors on Cornwall County Council and the 249 on the six district and borough councils. In June 2013 the Local Government Boundary Commission for England announced a public consultation on its proposal that Cornwall Council should have 87 councillors in future.
Broxtowe Borough Council elections are held every four years. Broxtowe Borough Council is the local authority for the non-metropolitan district of Borough of Broxtowe in Nottinghamshire, England. Since the full review of boundaries in 2015, 44 councillors are elected from 20 wards.
Chichester District Council in West Sussex, England is elected every four years. Since the last boundary changes in 2019, 36 councillors have been elected from 21 wards.
Fenland District Council in Cambridgeshire, England is elected every four years. Since the last boundary changes in 2023, the council has comprised 43 councillors representing 18 wards, with each ward electing one, two or three councillors.
Dartford Borough Council is the local authority for the Borough of Dartford in Kent, England. The council is elected every four years.
Durham County Council elections are held every four years. Durham County Council is the local authority for the unitary authority of County Durham. Since becoming a unitary authority, 126 councillors have been elected from 63 wards.
West Berkshire Council is the local authority for West Berkshire, a unitary authority in Berkshire, England. Until 1 April 1998 it was a non-metropolitan district called Newbury.
East Hertfordshire District Council is elected every four years.
Surrey County Council is elected every four years and was made in 1889 under the Local Government Act 1888. Since 1965 this council has had one of two statuses as to its body of councillors: no overall political control, or overall Conservative party control.
South Cambridgeshire District Council was created as part of the 1972 local government reforms. The first elections to the new authority were held in the year 1973. From 1978 until 2016, one third of the council were elected each year, followed by one year without a poll. Since 2018, all members of the council are elected at once in a so-called 'all-out' election, after a decision made in 2015.
Waltham Forest London Borough Council in London is elected every four years. Since the last boundary changes in 2022, 60 councillors have been elected from 22 wards, with 2 or 3 councillors per ward.
Shropshire Council elections are held every four years, and since 2009 74 councillors have been elected from 63 electoral divisions.
South Gloucestershire Council is the local authority for the a unitary authority of South Gloucestershire, England. It was created on 1 April 1996, covering the area of the abolished Kingswood and Northavon districts, and also taking on the services previously provided by the former Avon County Council in the area.
East Cambridgeshire District Council is a non-metropolitan district council in the county of Cambridgeshire in the United Kingdom. Elections are held every four years.
Luton Borough Council is the local authority for the unitary authority of Luton in Bedfordshire, England. Until 1 April 1997 it was a non-metropolitan district.
Nottingham City Council elections are held every four years. Nottingham City Council is the local authority for the unitary authority of Nottingham in Nottinghamshire, England. Until 1 April 1998 it was a non-metropolitan district. Since the last boundary changes in 2019, 55 councillors are elected from 20 wards.
Isle of Wight Council is the local authority for the Isle of Wight, a unitary authority and non-metropolitan county in England. Since the last boundary changes in 2021 the island has been divided into 39 electoral divisions, each of which elects one councillors. Elections are held every four years.
Central Bedfordshire Council is the local authority for the a unitary authority of Central Bedfordshire in Bedfordshire, England. It was created on 1 April 2009 replacing Mid Bedfordshire, South Bedfordshire and Bedfordshire County Council.
Somerset Council elections are held every four years to elect Somerset Council, the local authority for the non-metropolitan county of Somerset in South West England. From 1889 until 2023 the council was called Somerset County Council and it was an upper tier county council, with district-level functions being provided by the area's district councils. The districts were all abolished with effect from 1 April 2023, at which point the county council became a unitary authority, taking on the functions of the abolished district councils. The county council changed its name to Somerset Council to coincide with the change in its powers. There are 110 councillors, elected from 54 wards.