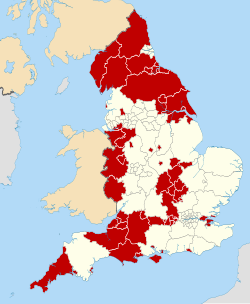
Swindon Borough Council is the local authority for the unitary authority of Swindon in Wiltshire, England. Until 1 April 1997 its area was a non-metropolitan district called Thamesdown Borough Council, with Wiltshire County Council providing the county-level services.
Party | Candidate | Votes | % | ±% | |
---|---|---|---|---|---|
Labour | 548 | 46.3 | |||
Liberal Democrats | 300 | 25.3 | |||
Conservative | 224 | 18.9 | |||
Green | 69 | 5.8 | |||
Socialist Labour | 44 | 53.7.8 | |||
Majority | 248 | 21.0 | |||
Turnout | 1,185 | 20.7 | |||
Labour hold | Swing |
Party | Candidate | Votes | % | ±% | |
---|---|---|---|---|---|
Labour | 715 | 66.0 | −4.4 | ||
Conservative | 297 | 27.4 | +11.2 | ||
Liberal Democrats | 72 | 6.6 | −6.8 | ||
Majority | 418 | 38.6 | |||
Turnout | 1,084 | 15.2 | |||
Labour hold | Swing |
Party | Candidate | Votes | % | ±% | |
---|---|---|---|---|---|
Conservative | Raymond Fisher | 814 | 52.5 | +5.3 | |
Labour | 409 | 26.4 | −13.2 | ||
Liberal Democrats | 258 | 16.6 | +3.4 | ||
UKIP | 69 | 4.5 | +4.5 | ||
Majority | 405 | 26.1 | |||
Turnout | 1,550 | 20.6 | |||
Conservative gain from Labour | Swing |
Party | Candidate | Votes | % | ±% | |
---|---|---|---|---|---|
Labour | 513 | 37.9 | +0.3 | ||
Liberal Democrats | 359 | 26.5 | −12.1 | ||
Conservative | 229 | 16.9 | −0.6 | ||
SA | 119 | 8.8 | +8.8 | ||
Green | 71 | 5.2 | +5.2 | ||
SOU | 41 | 3.0 | −3.2 | ||
UKIP | 21 | 1.6 | +1.6 | ||
Majority | 154 | 11.4 | |||
Turnout | 1,353 | 19.4 | |||
Labour hold | Swing |
Party | Candidate | Votes | % | ±% | |
---|---|---|---|---|---|
Labour | 829 | 47.5 | +4.2 | ||
Conservative | 651 | 37.3 | +11.3 | ||
Liberal Democrats | 154 | 8.8 | −13.5 | ||
UKIP | 79 | 4.5 | −3.9 | ||
Green | 34 | 1.9 | +1.9 | ||
Majority | 178 | 10.2 | |||
Turnout | 1,747 | 23.5 | |||
Labour hold | Swing |
Party | Candidate | Votes | % | ±% | |
---|---|---|---|---|---|
Labour | Peter Mallinson | 706 | 38.4 | −3.4 | |
Conservative | 586 | 31.9 | −1.8 | ||
Liberal Democrats | 338 | 18.4 | +1.2 | ||
Independent | 106 | 5.8 | +5.8 | ||
Green | 60 | 3.3 | −3.9 | ||
UKIP | 43 | 2.3 | +2.3 | ||
Majority | 120 | 6.5 | |||
Turnout | 1,839 | 35.0 | |||
Labour gain from Conservative | Swing |
Party | Candidate | Votes | % | ±% | |
---|---|---|---|---|---|
Labour | Jenny Millin | 887 | 47.5 | +12.6 | |
Conservative | Toby Elliott | 755 | 40.4 | +1.0 | |
UKIP | William Oram | 129 | 6.9 | +6.9 | |
Liberal Democrats | Chris Ward | 98 | 5.2 | −13.3 | |
Majority | 132 | 7.1 | |||
Turnout | 1,869 | 23.7 | |||
Labour gain from Conservative | Swing |
Party | Candidate | Votes | % | ±% | |
---|---|---|---|---|---|
Conservative | Steve Weisinger | 1,453 | |||
Labour | Phil Beaumont | 1,075 | |||
UKIP | John Lenton | 195 | |||
Green | Andrew Donald Day | 111 | |||
Liberal Democrats | Cath Smith | 23 | |||
Majority | 378 | ||||
Turnout | 32.6 | ||||
Conservative hold | Swing |
Party | Candidate | Votes | % | ±% | |
---|---|---|---|---|---|
Conservative | Oliver Donachie | 1,376 | 49.6 | +6.0 | |
Labour | Maura Clarke | 887 | 32.0 | +0.8 | |
UKIP | Ed Gerrard | 426 | 15.4 | +4.8 | |
Liberal Democrats | Sean Davey | 83 | 3.0 | −3.3 | |
Majority | 489 | 17.6 | |||
Turnout | 2,772 | ||||
Conservative hold | Swing |
Party | Candidate | Votes | % | ±% | |
---|---|---|---|---|---|
Conservative | Kate Tomlinson | 1,139 | 60.6 | +6.4 | |
Labour | Ian Edwards | 508 | 27.0 | −5.9 | |
Liberal Democrats | Joseph Polson | 102 | 5.4 | +5.4 | |
Green | Stephen Litchfield | 83 | 4.4 | −3.4 | |
Independent | Elena Mari | 47 | 2.5 | +2.5 | |
Majority | 631 | 33.6 | |||
Turnout | 1,879 | ||||
Conservative hold | Swing |
Party | Candidate | Votes | % | ±% | |
---|---|---|---|---|---|
Conservative | Matthew Vallender | 1,143 | 50.6 | +11.6 | |
Labour | Joseph Polson | 1,118 | 49.4 | −0.4 | |
Majority | 25 | 1.2 | |||
Turnout | 2,261 | ||||
Conservative gain from Labour | Swing |
Party | Candidate | Votes | % | ±% | |
---|---|---|---|---|---|
Conservative | Sudha Nukana | 991 | 48.6 | +15.6 | |
Labour | Meural Cardoso | 694 | 34.0 | −19.8 | |
Green | Roderick Hebden | 173 | 8.5 | −0.3 | |
Independent | Alex Petrarche | 100 | 4.9 | +4.9 | |
Liberal Democrats | Ciaran Skinner | 82 | 4.0 | −0.5 | |
Majority | 297 | 14.6 | |||
Turnout | 2,040 | ||||
Conservative gain from Labour | Swing |
Blackpool Borough Council elections are generally held every four years. Blackpool Borough Council is the local authority for the unitary authority of Blackpool in Lancashire, England. Since the last boundary changes in 2023, 42 councillors have been elected from 21 wards.
Rugby Borough Council elections are held three years out of every four, with a third of the council elected each time. Rugby Borough Council is the local authority for the non-metropolitan district of Rugby in Warwickshire, England. Since the last boundary changes in 2012, 42 councillors have been elected from 16 wards.
Test Valley Borough Council is elected every four years.
Dacorum Borough Council in Hertfordshire, England is elected every four years. Since the last boundary changes in 2007, 51 councillors have been elected from 25 wards.
Fylde Borough Council elections are held every four years to elect councillors to Fylde Borough Council in Lancashire, England. Since the last boundary changes in 2023 the council has comprised 37 councillors, representing 17 wards, with each ward electing one, two or three councillors.
Cotswold District Council in Gloucestershire, England, is elected every four years.
One third of Harrogate Borough Council in North Yorkshire, England was elected each year, followed by one year without election. Since the last boundary changes in 2002, 54 councillors had been elected from 35 wards. The last elections were held in 2018, ahead of the abolition of Harrogate Borough Council on 31 March 2023. Its functions transferred to the new North Yorkshire Council. The first elections to the North Yorkshire Council took place on 5 May 2022, when 21 councillors were elected from 21 divisions in the Borough of Harrogate.
One third of Basingstoke and Deane Borough Council in Hampshire, England is elected each year, followed by one year without election. Since the last boundary changes in 2021, 54 councillors have been elected from 18 wards.
Warwick District Council elections are held every four years. Warwick District Council is the local authority for the non-metropolitan district of Warwick in Warwickshire, England. Since the last boundary changes in 2019, 44 councillors have been elected from 17 wards.
West Lancashire Borough Council elections are generally held three years out of every four, with a third of the council elected each time. West Lancashire Borough Council is the local authority for the non-metropolitan district of West Lancashire in Lancashire, England. Since the last boundary changes in 2023 the council has comprised 45 councillors representing 15 wards, with each ward electing three councillors.
St Edmundsbury Borough Council in Suffolk, England, was elected every four years. After the last boundary changes in 2003, 45 councillors were elected from 31 wards. The council was abolished in 2019, with the area becoming part of West Suffolk.
East Hampshire District Council elections are held every four years to elect councillors to East Hampshire District Council in Hampshire, England. Since the last boundary changes in 2019 the council has comprised 43 councillors representing 31 wards, with each ward electing one, two or three councillors.
Halton Borough Council elections are generally held three years out of every four, with a third of the council being elected each time. Halton Borough Council is the local authority for the unitary authority of Halton in Cheshire, England. Since the last boundary changes in 2021, 54 councillors have been elected from 18 wards.
King's Lynn and West Norfolk District Council in Norfolk, England is elected every four years. Since the last boundary changes in 2019, 55 councillors have been elected from 35 wards.
Warrington Borough Council elections are held every four years. Warrington Borough Council is the local authority for the unitary authority of Warrington in Cheshire, England. Since the last boundary changes in 2016, 58 councillors have been elected from 22 wards.
Newcastle-under-Lyme Borough Council elections are held every four years. Newcastle-under-Lyme Borough Council is the local authority for the non-metropolitan district of Newcastle-under-Lyme in Staffordshire, England. Since the last boundary changes in 2018, 47 councillors have been elected from 21 wards. Prior to 2018 elections were held three years out of every four, with a third of the council elected each time.
One third of Welwyn Hatfield Borough Council in Hertfordshire, England is elected each year, followed by one year without election. Since the last boundary changes in 2016 the council has comprised 48 councillors representing 16 wards, each of which elects three councillors.
Gravesham Borough Council elections are held every four years to elect Gravesham Borough Council in Kent, England. Since the last boundary changes in 2023, the council has comprised 39 councillors, representing 17 wards.
Hertsmere Borough Council elections are held every four years to elect members of Hertsmere Borough Council in Hertfordshire, England. Since the last boundary changes in 2019, the council comprises 39 councillors elected from 16 wards.
Half of Fareham Borough Council in Hampshire, England is elected every two years, while before 2002 the council was elected by thirds. Since the last boundary changes in 2002, 31 councillors have been elected from 15 wards.