Borough result maps
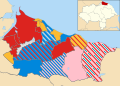 2003 results map
 2007 results map
 2011 results map
 2015 results map
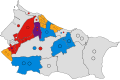 2019 results map
 2023 results map
Redcar and Cleveland Borough Council is the local authority for the unitary authority of Redcar and Cleveland in North Yorkshire, England. Until 1 April 1996 it was a non-metropolitan district in Cleveland, called Langbaurgh (or Langbaurgh-on-Tees after 1988).
Since the first election to the council in 1973 political control of the council has been held by the following parties: [1] [2]
Langbaurgh non-metropolitan district
| Party in control | Years | |
|---|---|---|
| No overall control | 1973–1976 | |
| Conservative | 1976–1979 | |
| Labour | 1979–1987 | |
| No overall control | 1987–1991 | |
| Labour | 1991–1996 | |
Redcar and Cleveland unitary authority
| Party in control | Years | |
|---|---|---|
| Labour | 1996–2003 | |
| No overall control | 2003–2011 | |
| Labour [3] | 2011–2013 | |
| No overall control | 2013–present | |
The leaders of the council since 2007 have been:
| Councillor | Party | From | To | |
|---|---|---|---|---|
| George Dunning [4] | Labour | 17 May 2007 | 12 Feb 2015 | |
| Mary Lanigan | Independent | 12 Feb 2015 | 28 May 2015 | |
| Sue Jeffrey | Labour | 28 May 2015 | 23 May 2019 | |
| Mary Lanigan [5] | Independent | 23 May 2019 | 25 May 2023 | |
| Alec Brown [6] | Labour | 25 May 2023 | ||
| Year | Labour | Liberal Democrats | Conservative | UKIP | East Cleveland Independents [a] | Eston Independents | Teesville Independents | Independent | Council control after election | |
|---|---|---|---|---|---|---|---|---|---|---|
| 1995 | 49 | 7 | 1 | 0 | 0 | 0 | 0 | 2 | Labour | |
| 1999 | 32 | 11 | 14 | 0 | 0 | 0 | 0 | 2 | Labour | |
| 2003 | 23 | 15 | 13 | 0 | 4 | 0 | 0 | 4 | No overall control | |
| 2007 | 28 | 13 | 11 | 0 | 0 | 0 | 3 | 4 | No overall control | |
| 2011 | 32 | 16 | 6 | 0 | 0 | 0 | 3 | 2 | Labour | |
| 2015 | 29 | 11 | 10 | 1 | 1 | 1 | 0 | 6 | No overall control | |
| 2019 | 15 | 13 | 11 | 2 | 1 | 0 | 3 | 14 | No overall control | |
| 2023 | 23 | 11 | 12 | 0 | 0 | 0 | 0 | 13 | No overall control | |


| Party | Candidate | Votes | % | ±% | |
|---|---|---|---|---|---|
| Liberal Democrats | Joyce Benbow | 771 | 39.4 | ||
| Labour | John Taylor | 742 | 37.9 | ||
| Conservative | Jean White | 445 | 22.7 | ||
| Majority | 29 | 1.5 | |||
| Turnout | 1,958 | 35.0 | |||
| Liberal Democrats gain from Labour | Swing | ||||
| Party | Candidate | Votes | % | ±% | |
|---|---|---|---|---|---|
| Labour | John Simms | 2,168 | 56.2 | −21.5 | |
| Independent | Ray Freeman | 1,362 | 35.3 | +35.3 | |
| Conservative | Yvonne Bennett | 329 | 8.5 | +8.5 | |
| Majority | 806 | 20.9 | |||
| Turnout | 3,859 | ||||
| Labour hold | Swing | ||||
| Party | Candidate | Votes | % | ±% | |
|---|---|---|---|---|---|
| Labour | 488 | 58.2 | −15.1 | ||
| Independent | 201 | 24.0 | +24.0 | ||
| Conservative | 150 | 17.9 | −8.8 | ||
| Majority | 287 | 34.2 | |||
| Turnout | 839 | ||||
| Labour hold | Swing | ||||
| Party | Candidate | Votes | % | ±% | |
|---|---|---|---|---|---|
| Labour | Sheelagh Clarke | 736 | 40.5 | −22.2 | |
| Conservative | David Tabner | 537 | 29.5 | +29.5 | |
| Liberal Democrats | Vera Butler | 509 | 28.0 | −9.3 | |
| Socialist Labour | John Taylor | 36 | 2.0 | +2.0 | |
| Majority | 199 | 11.0 | |||
| Turnout | 1,818 | 34.2 | |||
| Labour hold | Swing | ||||
| Party | Candidate | Votes | % | ±% | |
|---|---|---|---|---|---|
| Independent | Dave Fitzpatrick | 1,918 | 59.4 | +45.3 | |
| Labour | Susan McLeod | 722 | 22.4 | −40.1 | |
| Conservative | Marjorie Veal | 333 | 10.3 | −12.6 | |
| Liberal Democrats | Val Miller | 257 | 8.0 | +8.0 | |
| Majority | 1,196 | 37.0 | |||
| Turnout | 3,230 | ||||
| Independent gain from Labour | Swing | ||||
| Party | Candidate | Votes | % | ±% | |
|---|---|---|---|---|---|
| Labour | Peter Dunlop | 463 | 63.3 | −9.3 | |
| Liberal Democrats | Paul Tuffs | 242 | 33.1 | +22.0 | |
| Conservative | Lynda Russell | 27 | 3.7 | +3.7 | |
| Majority | 199 | 30.2 | |||
| Turnout | 732 | 16.3 | |||
| Labour hold | Swing | ||||
| Party | Candidate | Votes | % | ±% | |
|---|---|---|---|---|---|
| Liberal Democrats | Bill Goodwell | 599 | 35.8 | −13.4 | |
| Independent | Mike Findley | 587 | 35.1 | +35.1 | |
| Labour | Sue McLeod | 199 | 11.9 | −23.0 | |
| Green | Peter Goodwin | 173 | 10.3 | +10.3 | |
| Conservative | Neil Bilham | 114 | 6.8 | −9.1 | |
| Majority | 12 | 0.7 | |||
| Turnout | 1,672 | 48.3 | |||
| Liberal Democrats gain from Socialist Labour | Swing | ||||
| Party | Candidate | Votes | % | ±% | |
|---|---|---|---|---|---|
| Labour | Denise Bunn | 818 | 34.3 | +5.9 | |
| East Cleveland Independent | David Williams | 805 | 33.7 | +0.3 | |
| Conservative | Michael King | 626 | 26.2 | −12.0 | |
| Independent | Barry Parvin | 137 | 5.7 | +5.7 | |
| Majority | 13 | 0.6 | |||
| Turnout | 2,386 | 67.4 | |||
| Labour gain from Independent | Swing | ||||
| Party | Candidate | Votes | % | ±% | |
|---|---|---|---|---|---|
| Conservative | Bill Clarke | 1,124 | 55.9 | +13.5 | |
| Labour | Bill Suthers | 887 | 44.1 | −0.8 | |
| Majority | 237 | 11.8 | |||
| Turnout | 2,011 | 34.4 | |||
| Conservative hold | Swing | ||||
| Party | Candidate | Votes | % | ±% | |
|---|---|---|---|---|---|
| Liberal Democrats | John Hannon | 1,031 | 56.4 | +25.5 | |
| Labour | Paul Dixon | 486 | 26.6 | −15.9 | |
| Conservative | Brian Mundy | 204 | 11.2 | −15.5 | |
| BNP | Dawn Castle | 106 | 5.8 | +5.8 | |
| Majority | 545 | 29.8 | |||
| Turnout | 1,827 | 36.8 | |||
| Liberal Democrats gain from Labour | Swing | ||||
| Party | Candidate | Votes | % | ±% | |
|---|---|---|---|---|---|
| Labour | Marilyn Bramley | 652 | 49.9 | −0.6 | |
| Liberal Democrats | Toni Meir | 288 | 22.1 | +12.3 | |
| BNP | Bernard Collinson | 206 | 15.8 | +1.4 | |
| Independent | Oz Sadiq | 101 | 7.7 | −7.3 | |
| Conservative | Joan Bolton | 59 | 4.5 | −5.8 | |
| Majority | 364 | 27.8 | |||
| Turnout | 1,306 | 27.6 | |||
| Labour hold | Swing | ||||
| Party | Candidate | Votes | % | ±% | |
|---|---|---|---|---|---|
| Liberal Democrats | Ken Lucas | 809 | 42.4 | +17.3 | |
| Labour | Marian Fairley | 667 | 35.0 | −17.1 | |
| BNP | Lynn Payne | 305 | 16.6 | +16.6 | |
| Conservative | Brian Hughes-Mundy | 125 | 6.6 | −16.2 | |
| Majority | 142 | 7.4 | |||
| Turnout | 1,906 | 36.8 | |||
| Liberal Democrats gain from Labour | Swing | ||||
| Party | Candidate | Votes | % | ±% | |
|---|---|---|---|---|---|
| Liberal Democrats | Eric Howden | 805 | 52.3 | +27.2 | |
| Labour | Richard Green | 515 | 33.5 | −18.6 | |
| BNP | Lynn Payne | 145 | 9.4 | +9.4 | |
| Conservative | Joan Bolton | 73 | 4.7 | −18.0 | |
| Majority | 290 | 18.8 | |||
| Turnout | 1,538 | 29.9 | |||
| Liberal Democrats gain from Labour | Swing | ||||
| Party | Candidate | Votes | % | ±% | |
|---|---|---|---|---|---|
| Labour | Sue Jeffrey | 442 | 43.6 | −6.9 | |
| Liberal Democrats | Steven Abbott | 354 | 34.9 | +25.1 | |
| Independent | Vincent Smith | 102 | 10.1 | −5.0 | |
| UKIP | Martin Bulmer | 69 | 6.8 | +6.8 | |
| Conservative | Joan Bolton | 47 | 4.6 | −5.7 | |
| Majority | 88 | 8.7 | |||
| Turnout | 1,014 | 21.2 | |||
| Labour hold | Swing | ||||
| Party | Candidate | Votes | % | ±% | |
|---|---|---|---|---|---|
| Liberal Democrats | Ann Wilson | 1,084 | 73.5 | +12.4 | |
| Labour | Steve Goldswain | 210 | 14.2 | −5.0 | |
| UKIP | Martin Bulmer | 103 | 7.0 | +7.0 | |
| Conservative | Colin Jones | 77 | 5.2 | −14.4 | |
| Majority | 874 | 59.3 | |||
| Turnout | 1,474 | 29.6 | |||
| Liberal Democrats hold | Swing | ||||
| Party | Candidate | Votes | % | ±% | |
|---|---|---|---|---|---|
| Labour | Doreen Rudland | 565 | 38.1 | −1.0 | |
| Independent | Barry Hunt | 351 | 23.7 | +10.9 | |
| Liberal Democrats | Valerie Miller | 315 | 21.2 | −7.8 | |
| Conservative | Don Agar | 220 | 14.8 | −4.4 | |
| BNP | Michael George | 33 | 2.2 | +2.2 | |
| Majority | 214 | 14.4 | |||
| Turnout | 1,484 | 27.8 | |||
| Labour hold | Swing | ||||
| Party | Candidate | Votes | % | ±% | |
|---|---|---|---|---|---|
| Liberal Democrats | Ron Harrison | 661 | |||
| Liberal Democrats | Josh Mason | 633 | |||
| Labour | Norma Hensby | 531 | |||
| Labour | Celia Elliott | 512 | |||
| Conservative | Michael Bateman | 217 | |||
| Conservative | Brian Hughes-Munday | 142 | |||
| UKIP | Ian Neil | 50 | |||
| Turnout | 2,746 | 36.8 | |||
| Liberal Democrats hold | Swing | ||||
| Liberal Democrats hold | Swing | ||||
| Party | Candidate | Votes | % | ±% | |
|---|---|---|---|---|---|
| Labour | John P Hannon | 539 | 49.0 | ||
| Liberal Democrats | Dave Stones | 484 | 44.0 | ||
| Conservative | Matthew Bennett | 76 | 6.9 | ||
| Majority | 55 | 5.0 | |||
| Turnout | 1,099 | 33.88 | |||
| Labour gain from Liberal Democrats | Swing | ||||
| Party | Candidate | Votes | % | ±% | |
|---|---|---|---|---|---|
| Labour | David Walsh | 745 | 46.1 | ||
| UKIP | Stuart Todd | 485 | 30.0 | ||
| Conservative | Anne Watts | 176 | 10.9 | ||
| Independent | James Carrolle | 170 | 10.5 | ||
| Liberal Democrats | Rodney Waite | 40 | 2.5 | ||
| Majority | 260 | 16.1 | |||
| Turnout | 1,616 | 28.3 | |||
| Labour hold | Swing | ||||
| Party | Candidate | Votes | % | ±% | |
|---|---|---|---|---|---|
| Liberal Democrats | Sabrina Thompson | 753 | 37.3 | ||
| Labour | Neil Bendelow | 741 | 36.7 | ||
| UKIP | Andrea Turner | 523 | 25.9 | ||
| Majority | 12 | 0.6 | |||
| Turnout | 2,017 | 38.9 | |||
| Liberal Democrats hold | Swing | ||||
| Party | Candidate | Votes | % | ±% | |
|---|---|---|---|---|---|
| Conservative | Caroline Jackson | 879 | 45.0 | −8.8 | |
| Liberal Democrats | Arthur Kidd | 536 | 27.4 | +10.1 | |
| Labour | Ian Taylor | 368 | 18.8 | −10.1 | |
| UKIP | Kenneth Lilleker | 116 | 5.9 | n/a | |
| Independent | George Tinsley | 56 | 2.9 | n/a | |
| Majority | 343 | 17.6 | |||
| Turnout | 1,955 | 33.3 | |||
| Conservative hold | Swing | ||||
| Party | Candidate | Votes | % | ±% | |
|---|---|---|---|---|---|
| Liberal Democrats | Carole Morgan | 980 | 75.4 | +37.3 | |
| UKIP | Ian Neil | 138 | 10.6 | −6.8 | |
| Labour | Alison Suthers | 126 | 9.7 | −9.4 | |
| Conservative | Cameron Brown | 41 | 3.2 | −8.4 | |
| North East | Philip Lockey | 15 | 1.2 | N/A | |
| Majority | 842 | 64.8 | |||
| Turnout | 1,300 | 27.5 | |||
| Liberal Democrats hold | Swing | ||||
| Party | Candidate | Votes | % | ±% | |
|---|---|---|---|---|---|
| Conservative | Alma Thrower | 860 | 57.4 | +3.6 | |
| Liberal Democrats | Graeme Kidd | 326 | 21.8 | +4.5 | |
| Labour | Ian Urwin | 183 | 12.2 | −16.7 | |
| UKIP | Barry Hudson | 129 | 8.6 | n/a | |
| Majority | 534 | 35.6 | |||
| Turnout | 1,498 | 25.0 | |||
| Conservative hold | Swing | ||||
| Party | Candidate | Votes | % | ±% | |
|---|---|---|---|---|---|
| Liberal Democrats | Laura Benson | 426 | 44.6 | +4.9 | |
| Labour | Charlie Brady | 259 | 27.1 | −6.7 | |
| UKIP | Andrea Turner | 153 | 16.0 | −2.4 | |
| Independent | Mark Hannon | 52 | 5.4 | n/a | |
| Independent | Dave Stones | 36 | 3.8 | −4.3 | |
| Conservative | Maret Ward | 29 | 3.0 | n/a | |
| Majority | 167 | 17.5 | |||
| Turnout | 955 | 29.0 | |||
| Liberal Democrats hold | Swing | ||||
| Party | Candidate | Votes | % | ±% | |
|---|---|---|---|---|---|
| Liberal Democrats | Deborah Dowson | 661 | 38.4 | +8.6 | |
| Labour | David Jones | 368 | 21.4 | +1.5 | |
| Independent | John Lambert | 261 | 15.2 | n/a | |
| Independent | Victor Jeffries | 225 | 13.1 | n/a | |
| Conservative | Olwyn Twentyman | 174 | 10.1 | −2.6 | |
| Green | Nicola Riley | 31 | 1.8 | −9.7 | |
| Majority | 293 | 17.0 | |||
| Turnout | 1,720 | 34.3 | |||
| Liberal Democrats hold | Swing | ||||
| Party | Candidate | Votes | % | ±% | |
|---|---|---|---|---|---|
| Conservative | Vera Rider | 494 | 32.7 | +7.1 | |
| Liberal Democrats | Marilyn Marshall | 397 | 26.3 | +12.3 | |
| Labour | Darcie Shepherd | 337 | 22.3 | +4.0 | |
| Independent | Vic Jeffries | 282 | 18.7 | −3.6 | |
| Majority | 97 | 6.4 | |||
| Turnout | 1,510 | 27.9 | |||
| Conservative gain from Independent | Swing | ||||
| Party | Candidate | Votes | % | ±% | |
|---|---|---|---|---|---|
| Conservative | Andrew Hixon | 879 | 45.1 | +21.9 | |
| Labour | Lisa Belshaw | 406 | 20.9 | −2.1 | |
| Independent | Sheila Berry | 398 | 20.4 | +20.4 | |
| Independent | Fred Page | 195 | 10.0 | +10.0 | |
| Liberal Democrats | Carolyn Cree | 69 | 3.5 | +3.5 | |
| Majority | 473 | 24.3 | |||
| Turnout | 1,947 | 34.5 | |||
| Conservative hold | Swing | ||||
| Party | Candidate | Votes | % | ±% | |
|---|---|---|---|---|---|
| Conservative | Stephen Waterfield | 1,318 | 53.3 | +8.3 | |
| Liberal Democrats | Jemma Joy | 566 | 22.9 | −9.5 | |
| Independent | Christopher Baker | 332 | 13.4 | +13.4 | |
| Labour | Alan Hiscox | 256 | 10.4 | −3.0 | |
| Majority | 752 | 30.4 | |||
| Turnout | 2,472 | 44.9 | |||
| Conservative hold | Swing | ||||
| Party | Candidate | Votes | % | ±% | |
|---|---|---|---|---|---|
| Conservative | Andrea Turner | 710 | 45.0 | +12.6 | |
| Labour | Luke Myer | 440 | 27.9 | +17.8 | |
| Independent | Judith Findley | 399 | 25.3 | +25.3 | |
| Liberal Democrats | Marilyn Marshall | 29 | 1.8 | −8.6 | |
| Majority | 270 | 17.1 | |||
| Turnout | 1,578 | 46.6 | |||
| Conservative hold | Swing | ||||
| Party | Candidate | Votes | % | ±% | |
|---|---|---|---|---|---|
| Conservative | Paul Salvin | 389 | 37.5 | +15.9 | |
| Labour | Leanne Reed | 357 | 34.5 | +2.4 | |
| Independent | Paul McInnes | 109 | 10.5 | +10.5 | |
| Independent | Rita Richardson | 143 | 13.8 | +13.8 | |
| Liberal Democrats | Tracy Jacobs | 38 | 3.7 | −12.9 | |
| Majority | 32 | 3 | |||
| Turnout | 1,036 | 19.2 | |||
| Conservative gain from Labour | Swing | ||||
| Party | Candidate | Votes | % | ±% | |
|---|---|---|---|---|---|
| Conservative | Stephen Crane | 384 | 37.9 | ||
| Labour | Jane Bradley | 206 | 20.4 | ||
| Independent | Andrea Turner | 119 | 11.8 | ||
| Reform | Christopher Gallacher | 108 | 10.7 | ||
| Independent | Vic Jeffries | 105 | 10.4 | ||
| Independent | Steve Cooper | 50 | 4.9 | ||
| Liberal Democrats | Sarah Booth | 40 | 4.0 | ||
| Majority | 178 | 17.6 | |||
| Turnout | 1,012 | ||||
| Conservative gain from Labour | Swing | ||||
| Party | Candidate | Votes | % | ±% | |
|---|---|---|---|---|---|
| Reform | Craig Holmes | 839 | 65.3 | ||
| Labour | Norman Macleod | 247 | 19.2 | ||
| Conservative | Julie Craig | 179 | 13.9 | ||
| Liberal Democrats | Stuart Saunders | 19 | 1.5 | ||
| Majority | 592 | 46.0 | |||
| Turnout | 1,284 | ||||
| Reform gain from Conservative | Swing | ||||
| Party | Candidate | Votes | % | ±% | |
|---|---|---|---|---|---|
| Labour | Susan Jeffrey | 368 | 47.4 | ||
| Reform | Adam Jones | 344 | 44.3 | ||
| Conservative | Richard Kerr-Morgan | 64 | 8.2 | ||
| Majority | 24 | 3.1 | |||
| Turnout | 776 | ||||
| Labour hold | Swing | ||||