County result maps
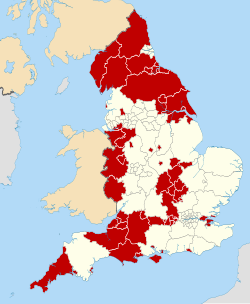
 2005 results map
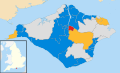 2009 results map
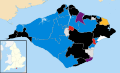 2013 results map
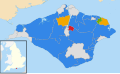 2017 results map
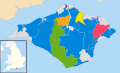 2021 results map
Isle of Wight Council is the local authority for the Isle of Wight, a unitary authority and non-metropolitan county in England. Since the last boundary changes in 2021 the island has been divided into 39 electoral divisions, each of which elects one councillors. Elections are held every four years. [1]


| Party | Candidate | Votes | % | ±% | |
|---|---|---|---|---|---|
| Conservative | 207 | 35.5 | −3.0 | ||
| Liberal Democrats | 189 | 32.4 | +3.9 | ||
| Labour | 137 | 23.5 | −9.5 | ||
| UKIP | 25 | 4.3 | +4.3 | ||
| Independent | 23 | 3.9 | +3.9 | ||
| Independent | 2 | 0.3 | +0.3 | ||
| Majority | 18 | 3.1 | |||
| Turnout | 583 | ||||
| Conservative hold | Swing | ||||
| Party | Candidate | Votes | % | ±% | |
|---|---|---|---|---|---|
| Conservative | 286 | 45.5 | −2.7 | ||
| Liberal Democrats | 155 | 24.6 | −5.8 | ||
| Independent | 150 | 23.8 | +23.8 | ||
| Labour | 38 | 6.0 | −12.9 | ||
| Majority | 131 | 20.8 | |||
| Turnout | 629 | ||||
| Conservative hold | Swing | ||||
| Party | Candidate | Votes | % | ±% | |
|---|---|---|---|---|---|
| Liberal Democrats | 389 | 39.7 | +39.7 | ||
| Conservative | 377 | 38.5 | −8.0 | ||
| Independent | 213 | 21.8 | +21.8 | ||
| Majority | 12 | 1.2 | |||
| Turnout | 979 | ||||
| Liberal Democrats gain from Conservative | Swing | ||||
| Party | Candidate | Votes | % | ±% | |
|---|---|---|---|---|---|
| Conservative | Gary Taylor | 274 | 37.2 | +10.8 | |
| Labour | Deborah Gardiner | 201 | 27.3 | +19.1 | |
| Liberal Democrats | Tony Zeid | 164 | 22.3 | −11.2 | |
| Independent | Ian Jenkins | 97 | 13.2 | +13.2 | |
| Majority | 73 | 9.9 | |||
| Turnout | 736 | ||||
| Conservative gain from Liberal Democrats | Swing | ||||
| Party | Candidate | Votes | % | ±% | |
|---|---|---|---|---|---|
| Conservative | Dave Stewart | 510 | 53.6 | −7.7 | |
| Liberal Democrats | Malcolm Groves | 365 | 38.4 | −0.3 | |
| Labour | Josh Cooper | 76 | 8.0 | +8.0 | |
| Majority | 145 | 15.2 | |||
| Turnout | 951 | ||||
| Conservative hold | Swing | ||||
| Party | Candidate | Votes | % | ±% | |
|---|---|---|---|---|---|
| Independent | Ivor Warlow | 428 | 37.2 | −4.9 | |
| Conservative | Ian Cobb | 424 | 36.9 | −5.6 | |
| Liberal Democrats | Tim Wakeley | 139 | 12.1 | −3.3 | |
| UKIP | Daryll Pitcher | 93 | 8.1 | +8.1 | |
| Labour | Mick Lyons | 66 | 5.7 | +5.7 | |
| Majority | 4 | 0.3 | |||
| Turnout | 1,150 | ||||
| Independent gain from Conservative | Swing | ||||
| Party | Candidate | Votes | % | ±% | |
|---|---|---|---|---|---|
| Conservative | Stuart Hutchinson | 640 | 76.7 | +30.2 | |
| Liberal Democrats | Mike Carr | 116 | 13.9 | +13.9 | |
| UKIP | Rose Lynden-Bell | 78 | 9.4 | +9.4 | |
| Majority | 524 | 62.8 | |||
| Turnout | 834 | ||||
| Conservative gain from Independent | Swing | ||||
| Party | Candidate | Votes | % | ±% | |
|---|---|---|---|---|---|
| Conservative | Steve Hastings | 547 | 49.7 | −25.5 | |
| Liberal Democrats | Nick Stuart | 286 | 26.0 | +26.0 | |
| Green | Daniel James | 143 | 13.0 | −5.9 | |
| Labour | Simon Haytack | 101 | 9.2 | +3.3 | |
| UKIP | Terry Brennan | 24 | 2.2 | +2.2 | |
| Majority | 261 | 23.7 | |||
| Turnout | 1,101 | ||||
| Conservative hold | Swing | ||||
| Party | Candidate | Votes | % | ±% | |
|---|---|---|---|---|---|
| Conservative | Stephen Hendry | 318 | 35.1 | +9.3 | |
| Liberal Democrats | Julie Burridge | 179 | 19.8 | +14.7 | |
| Independent | Michael Paler | 167 | 18.4 | +18.4 | |
| Labour | Luisa Hillard | 141 | 15.6 | +3.6 | |
| Island Independents | Karen Lucioni | 60 | 6.6 | +6.6 | |
| UKIP | Rose Lynden-Bell | 41 | 4.5 | +4.5 | |
| Majority | 139 | 15.3 | |||
| Turnout | 906 | ||||
| Conservative gain from Independent | Swing | ||||
| Party | Candidate | Votes | % | ±% | |
|---|---|---|---|---|---|
| Conservative | Richard Hollis | 605 | 35.7 | −4.5 | |
| Labour | Maria Villa Vine | 408 | 24.1 | +18.0 | |
| Green | Joe Lever | 361 | 21.3 | +0.6 | |
| Liberal Democrats | Nick Stuart | 238 | 14.0 | +10.4 | |
| Independent | Stephen Reynolds | 47 | 2.8 | +2.8 | |
| Independent | Julian Harris | 36 | 2.1 | +2.1 | |
| Majority | 197 | 11.6 | |||
| Turnout | 1,695 | ||||
| Conservative hold | Swing | ||||
| Party | Candidate | Votes | % | ±% | |
|---|---|---|---|---|---|
| Liberal Democrats | Nick Stuart | 526 | 53.4 | +23.5 | |
| Conservative | Carol Bryan | 239 | 24.3 | −19.2 | |
| Green | Doug Alldred | 153 | 15.5 | −11.1 | |
| Vectis Party | Stephen Parkes | 36 | 3.7 | +3.7 | |
| Labour | Gary Clarke | 31 | 3.1 | +3.1 | |
| Majority | 287 | 29.1 | |||
| Turnout | 985 | ||||
| Liberal Democrats gain from Conservative | Swing | ||||
| Party | Candidate | Votes | % | ±% | |
|---|---|---|---|---|---|
| Liberal Democrats | Sarah Redrup | 475 | 47.9 | +47.9 | |
| Conservative | Ed Hopper | 291 | 29.3 | −2.5 | |
| Vectis Party | Linda Pitcher | 178 | 17.9 | −29.4 | |
| Green | Michael Smith | 48 | 4.8 | −8.7 | |
| Majority | 184 | 18.5 | |||
| Turnout | 992 | ||||
| Liberal Democrats gain from Vectis Party | Swing | ||||
| Party | Candidate | Votes | % | ±% | |
|---|---|---|---|---|---|
| Conservative | Ed Blake | 274 | 41.1 | +14.3 | |
| Labour | Steve Cooper | 248 | 37.2 | +16.9 | |
| Liberal Democrats | Ray Harrington-Vail | 145 | 21.7 | +21.7 | |
| Majority | 26 | 3.9 | |||
| Turnout | 667 | ||||
| Conservative hold | Swing | ||||
| Party | Candidate | Votes | % | ±% | |
|---|---|---|---|---|---|
| Reform UK | Caroline Gladwin | 410 | 39.8 | +39.8 | |
| Conservative | Simon Richards | 220 | 13.4 | −36.0 | |
| Green | Julia Laursen | 219 | 21.3 | −7.7 | |
| Liberal Democrats | Bob Blezzard | 146 | 14.2 | +14.2 | |
| Labour | Simon Haytack | 34 | 3.3 | −10.2 | |
| Majority | 190 | 18.5 | |||
| Turnout | 1,029 | ||||
| Reform UK gain from Conservative | Swing | ||||
| Party | Candidate | Votes | % | ±% | |
|---|---|---|---|---|---|
| Independent | Becca Cameron | 472 | 43.1 | +43.1 | |
| Reform UK | Bill Nigh | 269 | 24.6 | +24.6 | |
| Conservative | Warren Whyte | 147 | 13.4 | −34.6 | |
| Independent | Emma Cox | 105 | 9.6 | +9.6 | |
| Labour | Anne Bamford | 74 | 6.8 | +6.8 | |
| Liberal Democrats | Tony Zeid | 28 | 2.6 | +2.6 | |
| Majority | 203 | 18.5 | |||
| Turnout | 1,095 | ||||
| Independent hold | Swing | ||||
| Party | Candidate | Votes | % | ±% | |
|---|---|---|---|---|---|
| Reform UK | David Maclean | 291 | 36.1 | +36.1 | |
| Conservative | Adrian Whittaker | 232 | 28.7 | −15.1 | |
| Green | Robert May | 97 | 12.0 | +1.9 | |
| Liberal Democrats | Julie Burridge | 85 | 10.5 | +10.5 | |
| Independent | Sarah Morris | 55 | 6.8 | +6.8 | |
| Labour | Emily Brothers | 47 | 5.8 | −9.0 | |
| Majority | 59 | 7.3 | |||
| Turnout | 807 | ||||
| Reform UK gain from Conservative | Swing | ||||
| Party | Candidate | Votes | % | ±% | |
|---|---|---|---|---|---|
| Reform UK | Bill Nigh | 290 | 36.8 | +0.7 | |
| Conservative | Adrian Whittaker | 249 | 31.6 | +2.9 | |
| Liberal Democrats | Bob Blezzard | 118 | 15.0 | +4.5 | |
| Green | Robert May | 88 | 11.2 | −0.8 | |
| Labour | Christopher Lloyd | 44 | 5.6 | −0.2 | |
| Majority | 41 | 5.2 | |||
| Turnout | 789 | ||||
| Reform UK hold | Swing | ||||
| Isle of Wight Council | |
|---|---|
| Medina Borough Council | |
| South Wight Borough Council | |
| |