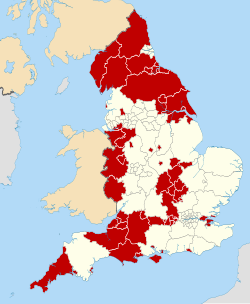
Portsmouth City Council is the local authority for the unitary authority of Portsmouth in Hampshire, England. Until 1 April 1997 it was a non-metropolitan district.
Since the first election to the council in 1973 following the reforms of the Local Government Act 1972, political control of the council has been held by the following parties: [1]
Year | Conservative | Labour | Liberal Democrats [a] | PIP | UKIP | Independents & Others | Council control after election | |
---|---|---|---|---|---|---|---|---|
Local government reorganisation; council established (48 seats) | ||||||||
1973 | 28 | 17 | 0 | – | – | 3 | Conservative | |
1976 | 31 | 14 | 0 | – | – | 3 | Conservative | |
1979 | 31 | 14 | 0 | – | – | 3 | Conservative | |
New ward boundaries (39 seats) | ||||||||
1983 | 25 | 11 | 1 | – | – | 2 | Conservative | |
1984 | 25 | 11 | 1 | – | – | 2 | Conservative | |
1986 | 23 | 10 | 5 | – | – | 1 | Conservative | |
1987 | 24 | 9 | 5 | – | – | 1 | Conservative | |
1988 | 25 | 8 | 5 | – | – | 1 | Conservative | |
1990 | 21 | 12 | 5 | – | – | 1 | Conservative | |
1991 | 19 | 13 | 6 | – | – | 1 | No overall control | |
1992 | 17 | 14 | 7 | – | – | 1 | No overall control | |
1994 | 15 | 14 | 9 | – | 0 | 1 | No overall control | |
1995 | 11 | 18 | 10 | – | 0 | 0 | Labour | |
1996 | 6 | 21 | 12 | – | 0 | 0 | Labour | |
1998 | 8 | 21 | 10 | – | 0 | 0 | Labour | |
1999 | 10 | 20 | 9 | – | 0 | 0 | Labour | |
2000 | '16 | 15 | 8 | – | 0 | 0 | No overall control | |
New ward boundaries (42 seats) | ||||||||
2002 | 15 | 14 | 13 | – | 0 | 0 | No overall control | |
2003 | 15 | 11 | 16 | – | 0 | 0 | No overall control | |
2004 | 15 | 7 | 20 | – | 0 | 0 | No overall control | |
2006 | 16 | 5 | 21 | – | 0 | 0 | No overall control | |
2007 | 17 | 5 | 19 | – | 0 | 0 | No overall control | |
2008 | 19 | 2 | 19 | – | 0 | 2 | No overall control | |
2010 | 16 | 2 | 23 | – | 0 | 0 | Liberal Democrats | |
2011 | 17 | 2 | 23 | – | 0 | 0 | Liberal Democrats | |
2012 | 12 | 4 | 26 | – | 0 | 0 | Liberal Democrats | |
2014 | 12 | 4 | 19 | – | 6 | 1 | No overall control | |
2015 | 17 | 4 | 14 | – | 6 | 1 | No overall control | |
2016 | 19 | 4 | 15 | – | 4 | 1 | No overall control | |
2018 | 19 | 6 | 16 | – | 0 | 1 | No overall control | |
2019 | 16 | 6 | 18 | – | 0 | 2 | No overall control | |
2021 | 16 | 7 | 15 | – | 0 | 4 | No overall control | |
2022 | 13 | 9 | 17 | 3 | 0 | 0 | No overall control | |
2023 | 8 | 7 | 18 | 6 | 0 | 3 | No overall control | |
2024 | 4 | 8 | 19 | 9 | 0 | 2 | No overall control | |
Party | Candidate | Votes | % | ±% | |
---|---|---|---|---|---|
Conservative | Stephen Wemyss | 2,148 | 50.9 | +4.2 | |
Liberal Democrats | Patrict Whittle | 1,973 | 46.7 | +4.3 | |
English Democrat | David Knight | 102 | 2.4 | +2.4 | |
Majority | 175 | 4.2 | |||
Turnout | 4,223 | 43.0 | |||
Conservative hold | Swing |
Party | Candidate | Votes | % | ±% | |
---|---|---|---|---|---|
Liberal Democrats | David Fuller | 1,196 | 58.6 | +2.6 | |
Conservative | Gerry Oldfield | 496 | 24.3 | +1.3 | |
Labour | Simon Payne | 144 | 7.1 | −5.4 | |
English Democrat | David Knight | 131 | 6.4 | −2.1 | |
Green | Sean Sanders | 56 | 2.7 | +2.7 | |
Independent | Mark Austin | 17 | 0.8 | +0.8 | |
Majority | 700 | 34.3 | +1.3 | ||
Turnout | 2,040 | 20.7 | |||
Liberal Democrats hold | Swing |
Party | Candidate | Votes | % | ±% | |
---|---|---|---|---|---|
Labour | Sarah Cook | 791 | 35.0 | +3.2 | |
Conservative | Jim Fleming | 682 | 30.2 | +3.3 | |
Liberal Democrats | Alex Naylor | 548 | 24.2 | −2.9 | |
UKIP | Michelle Essery | 90 | 4.0 | +4.0 | |
Green | Calum Kennedy | 78 | 3.5 | −2.9 | |
English Democrat | Clive Percy | 71 | 3.1 | −4.4 | |
Majority | 109 | 4.8 | |||
Turnout | 2,260 | 22.4 | |||
Labour hold | Swing |
Party | Candidate | Votes | % | ±% | |
---|---|---|---|---|---|
Liberal Democrats | Andy Fraser | 1,835 | 55.8 | +38.4 | |
Conservative | Jim Fleming | 904 | 27.5 | −18.6 | |
Labour | Terry O'Brien | 349 | 10.6 | −8.2 | |
English Democrat | David Knight | 117 | 3.6 | −13.6 | |
UKIP | Michelle Essery | 57 | 1.7 | +1.7 | |
Independent | Mark Austin | 28 | 0.9 | +0.9 | |
Majority | 931 | 28.3 | |||
Turnout | 3,290 | 33.9 | |||
Liberal Democrats gain from Conservative | Swing |