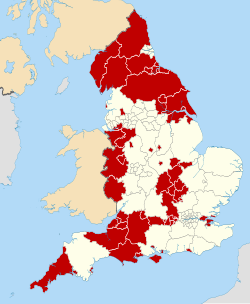
Hartlepool Borough Council elections usually take place for a third of the council, three years out of every four. Hartlepool Borough Council is the local authority for the unitary authority of Hartlepool in County Durham, England. Until 1 April 1996 it was a non-metropolitan district in Cleveland.
On 18 October 2001 there was a referendum on whether Hartlepool should have a directly elected mayor. The referendum saw a narrow vote in favour with 10,667 yes votes and 10,294 no votes on a turnout of 31%. [6] The first election in 2002 saw an independent candidate Stuart Drummond elected and he has been re-elected in both the 2005 and 2009 elections. [7] A referendum to abolish the mayoralty in 2012 succeeded, with 58.7% favouring a cabinet system. [8]
Party | Candidate | Votes | % | ±% | |
---|---|---|---|---|---|
Labour | Bill Iseley | 465 | 66.0 | +20.9 | |
Liberal Democrats | Ken Fox | 240 | 34.0 | −20.9 | |
Majority | 225 | 32.0 | |||
Turnout | 705 | 17.1 | |||
Labour gain from Liberal Democrats | Swing |
Party | Candidate | Votes | % | ±% | |
---|---|---|---|---|---|
Independent | John Cambridge | 502 | 48.6 | +10.5 | |
Labour | Keith Fisher | 359 | 34.8 | −0.6 | |
Liberal Democrats | Kevin Kelly | 171 | 16.6 | −10.0 | |
Majority | 143 | 13.8 | |||
Turnout | 1,032 | 21.1 | |||
Independent hold | Swing |
Party | Candidate | Votes | % | ±% | |
---|---|---|---|---|---|
Labour | Lilian Sutheran | 440 | 52.4 | +5.8 | |
Liberal Democrats | Lynne Gilfoyle | 143 | 17.0 | −14.7 | |
UKIP | Richard Banks | 131 | 15.6 | +15.6 | |
Conservative | Brenda Pearson | 126 | 15.0 | −6.8 | |
Majority | 297 | 35.4 | |||
Turnout | 840 | 18.5 | |||
Labour hold | Swing |
Party | Candidate | Votes | % | ±% | |
---|---|---|---|---|---|
Labour | 350 | 40.5 | −2.3 | ||
Liberal Democrats | Michelle Plant | 230 | 26.6 | +8.6 | |
Independent | Jean Pearson | 127 | 14.7 | −4.7 | |
BNP | 117 | 13.5 | +1.8 | ||
Conservative | 41 | 4.7 | −3.4 | ||
Majority | 120 | 13.9 | |||
Turnout | 865 | 18.5 | |||
Labour hold | Swing |
Party | Candidate | Votes | % | ±% | |
---|---|---|---|---|---|
Conservative | Mary Laffey | 468 | 46.1 | −2.6 | |
UKIP | Eric Wilson | 208 | 20.5 | −4.9 | |
Labour | Lorraine Fenwick | 121 | 120 | −0.5 | |
Liberal Democrats | Sheila Bruce | 99 | 9.7 | −3.6 | |
BNP | Ronald Bage | 68 | 6.7 | +6.7 | |
Independent | Douglas Ferriday | 51 | 5.0 | +5.0 | |
Majority | 260 | 25.6 | |||
Turnout | 1,015 | 21.0 | |||
Conservative hold | Swing |
Party | Candidate | Votes | % | ±% | |
---|---|---|---|---|---|
Labour | Christopher Akers-Belcher | 532 | 42.3 | +5.2 | |
UKIP | Dave Pascoe | 300 | 23.9 | −4.5 | |
Liberal Democrats | Pamela Turnedge | 166 | 13.2 | −6.4 | |
BNP | Cheryl Dunn | 157 | 12.5 | +12.5 | |
Conservative | Ray Pocklington | 102 | 8.1 | −6.9 | |
Majority | 232 | 18.4 | |||
Turnout | 1,257 | 26.7 | |||
Labour hold | Swing |
Party | Candidate | Votes | % | ±% | |
---|---|---|---|---|---|
Independent | Hilary Thompson | 233 | 35.5 | −48.8 | |
Conservative | Chris Banks | 201 | 30.9 | +30.9 | |
Independent | Alan Bell | 132 | 20.3 | +20.3 | |
Labour | Stephen Thomas | 40 | 6.1 | −9.3 | |
Independent | Ron Watts | 28 | 4.3 | +4.3 | |
Liberal Democrats | Keith MacFadyen | 17 | 2.6 | +2.6 | |
Majority | 32 | 4.9 | |||
Turnout | 651 | 39.2 | |||
Independent hold | Swing |
Party | Candidate | Votes | % | ±% | |
---|---|---|---|---|---|
Putting Hartlepool First | Kelly Atkinson | 441 | 38.4 | +23.4 | |
Labour | Ann Marshall | 261 | 22.7 | +9.6 | |
Independent | David Young | 193 | 16.8 | −36.7 | |
UKIP | Thomas Hind | 128 | 11.1 | +0.0 | |
Conservative | Shane Moore | 94 | 8.2 | +1.0 | |
Liberal Democrats | James Tighe | 31 | 2.7 | +2.7 | |
Majority | 180 | 15.7 | |||
Turnout | 1,148 | 16.1 | |||
Putting Hartlepool First gain from Independent | Swing |
Party | Candidate | Votes | % | ±% | |
---|---|---|---|---|---|
Labour | Allan Barclay | 639 | 56.4 | +7.0 | |
UKIP | Tom Hind | 226 | 19.9 | +4.2 | |
Putting Hartlepool First | Mick Stevens | 194 | 17.1 | +0.5 | |
Conservative | Mandy Loynes | 74 | 6.5 | +0.8 | |
Majority | 413 | 36.5 | |||
Turnout | 1,133 | 15.8 | |||
Labour hold | Swing |
Party | Candidate | Votes | % | ±% | |
---|---|---|---|---|---|
UKIP | Tim Fleming | 496 | 49.2 | +0.6 | |
Labour | Trevor Rogan | 255 | 25.3 | −16.5 | |
Putting Hartlepool First | Steve Latimer | 155 | 15.4 | +15.4 | |
Conservative | Benjamin Marshall | 41 | 4.1 | −5.6 | |
Patients not Profits | John Robert Price | 36 | 3.6 | +3.6 | |
Independent | Chris Broadbent | 26 | 2.6 | +2.6 | |
Majority | 241 | 23.9 | |||
Turnout | 1,009 | 17.8 | |||
UKIP gain from Labour | Swing |
Party | Candidate | Votes | % | ±% | |
---|---|---|---|---|---|
Labour | Mike McLaughlin | 555 | 40.6 | +2.6 | |
UKIP | Tom Cassidy | 532 | 38.9 | +8.1 | |
Conservative | Chris Broadbent | 210 | 15.4 | +5.6 | |
Independent | Lucy Patterson | 69 | 5.1 | +5.1 | |
Majority | 23 | 1.7 | |||
Turnout | 1,366 | 24.4 | |||
Labour hold | Swing |
Party | Candidate | Votes | % | ±% | |
---|---|---|---|---|---|
Putting Hartlepool First | Leisa Smith | 474 | 31.6 | +3.2 | |
Independent | Sue Little | 425 | 28.3 | +2.1 | |
Labour | Ann Marshall | 275 | 18.3 | +4.8 | |
Conservative | Mike Young | 180 | 12.0 | +6.0 | |
UKIP | Karen King | 148 | 9.9 | −13.5 | |
Majority | 49 | 3.3 | |||
Turnout | 1,502 | 21.4 | |||
Putting Hartlepool First gain from Independent | Swing |
Party | Candidate | Votes | % | ±% | |
---|---|---|---|---|---|
Labour | Katie Trueman | 479 | 53.1 | +1.9 | |
UKIP | Jacqui Cummins | 325 | 36.0 | +6.4 | |
Conservative | Andrew Martin-Wells | 98 | 10.9 | −1.0 | |
Majority | 154 | 17.1 | |||
Turnout | 902 | 15.9 | |||
Labour hold | Swing |
Party | Candidate | Votes | % | ±% | |
---|---|---|---|---|---|
Conservative | Mike Young | 678 | 45.4 | −13.0 | |
Independent | James Brewer | 546 | 36.5 | +18.6 | |
Labour | Yousuf Khan | 184 | 12.3 | −5.4 | |
Green | Michael Holt | 87 | 5.8 | −0.1 | |
Majority | 132 | 8.8 | |||
Turnout | 1,495 | 25.3 | |||
Conservative hold | Swing |
Party | Candidate | Votes | % | ±% | |
---|---|---|---|---|---|
Independent | James Brewer | 637 | 44.1 | +44.1 | |
Labour | Aileen Kendon | 582 | 40.2 | +1.5 | |
Conservative | Cameron Stokell | 200 | 13.8 | −3.4 | |
Green | Michael Holt | 27 | 1.9 | +1.9 | |
Majority | 55 | 3.8 | |||
Turnout | 1,446 | ||||
Independent gain from Labour | Swing |
Party | Candidate | Votes | % | ±% | |
---|---|---|---|---|---|
Labour | Ann Johnson | 366 | 30.5 | −2.3 | |
IU | Ian Griffiths | 358 | 29.8 | −37.4 | |
Green | Michael Ritchie | 196 | 16.3 | n/a | |
For Britain | Graham Craddy | 166 | 13.8 | n/a | |
UKIP | Graham Harrison | 114 | 9.5 | n/a | |
Majority | 8 | 0.7 | |||
Turnout | 1,200 | 16.9 | |||
Labour gain from Independent | Swing |
Party | Candidate | Votes | % | ±% | |
---|---|---|---|---|---|
Labour | Carole Thompson | 443 | 43.9 | ||
Conservative | Pamela Shurmer | 391 | 38.8 | ||
Independent | Connor Stallard | 126 | 12.5 | ||
Liberal Democrats | Barry McKinstray | 49 | 4.9 | ||
Majority | 52 | 5.2 | |||
Turnout | 1,009 | ||||
Labour gain from Conservative | Swing |
Party | Candidate | Votes | % | ±% | |
---|---|---|---|---|---|
Labour | Cameron Sharp | 450 | 50.8 | ||
Independent | Jaime Horton | 280 | 31.6 | ||
Conservative | Jack Waterman | 124 | 14.0 | ||
Liberal Democrats | Barry McKinstray | 32 | 3.6 | ||
Majority | 170 | 19.2 | |||
Turnout | 886 | ||||
Labour hold | Swing |
Party | Candidate | Votes | % | ±% | |
---|---|---|---|---|---|
Labour | Owen Riddle | 475 | 47.5 | −7.0 | |
Reform UK | Amanda Napper | 399 | 39.9 | +23.9 | |
Liberal Democrats | Barry McKinstray | 89 | 8.9 | +8.9 | |
Green | Stephen Ashfield | 36 | 3.6 | +3.6 | |
Majority | 76 | 7.6 | |||
Turnout | 999 | ||||
Labour hold | Swing |
Dacorum Borough Council in Hertfordshire, England is elected every four years. Since the last boundary changes in 2007, 51 councillors have been elected from 25 wards.
One-third of Rushmoor Borough Council in Hampshire, England, is elected each year, followed by one year without election. From 1979, the council had 15 three-member wards, reduced to 14 wards in 2002 and 13 in 2012. Each ward elects 3 of the 39 councillors, one in each election year, for a term of four years, except in years when ward boundaries are changed when all councillors are elected for terms depending on their position in the poll.
Torbay Council is the local authority for the unitary authority of Torbay in Devon, England. Until 1 April 1998 it was a non-metropolitan district. From 2005 to 2019 it had a directly elected mayor. The council is elected every four years.
One third of Harrogate Borough Council in North Yorkshire, England was elected each year, followed by one year without election. Since the last boundary changes in 2002, 54 councillors had been elected from 35 wards. The last elections were held in 2018, ahead of the abolition of Harrogate Borough Council on 31 March 2023. Its functions transferred to the new North Yorkshire Council. The first elections to the North Yorkshire Council took place on 5 May 2022, when 21 councillors were elected from 21 divisions in the Borough of Harrogate.
Boston Borough Council in Lincolnshire, England is elected every four years. Since the last boundary changes in 2015, 30 councillors are elected from 15 wards.
Northampton Borough Council was the local authority for Northampton in Northamptonshire, England and was elected every four years. From the last boundary changes in 1999, 47 councillors were elected from 23 wards. The borough council was abolished in 2021, with the area becoming part of West Northamptonshire.
One third of Crawley Borough Council in West Sussex, England is elected each year, followed by one year without election. Since the last boundary changes in 2019, 36 councillors have been elected from 13 wards.
Warwick District Council elections are held every four years. Warwick District Council is the local authority for the non-metropolitan district of Warwick in Warwickshire, England. Since the last boundary changes in 2019, 44 councillors have been elected from 17 wards.
West Lancashire Borough Council elections are generally held three years out of every four, with a third of the council elected each time. West Lancashire Borough Council is the local authority for the non-metropolitan district of West Lancashire in Lancashire, England. Since the last boundary changes in 2023 the council has comprised 45 councillors representing 15 wards, with each ward electing three councillors.
Mansfield District Council elections are held every four years. Mansfield District Council is the local authority for the non-metropolitan district of Mansfield in Nottinghamshire, England. Since 2002 Mansfield has also had a directly elected mayor. Since the last boundary changes in 2023, 36 councillors have been elected from 36 wards.
The Borough Council of Wellingborough in Northamptonshire, UK was elected every four years. After the last boundary changes in 1999, thirty-six councillors were elected from 16 wards. The council was abolished in 2021, with the area becoming part of North Northamptonshire.
Rotherham Metropolitan Borough Council is the local authority for Rotherham in South Yorkshire, England. The council is elected every four years. Since the last boundary changes in 2004, 63 councillors have been elected from 21 wards.
King's Lynn and West Norfolk District Council in Norfolk, England is elected every four years. Since the last boundary changes in 2019, 55 councillors have been elected from 35 wards.
Tonbridge and Malling Borough Council is the local authority for the borough of Tonbridge and Malling in Kent, United Kingdom. The council is elected every four years. Since the last boundary changes in 2023, 44 councillors have been elected from 19 wards.
Newcastle-under-Lyme Borough Council elections are held every four years. Newcastle-under-Lyme Borough Council is the local authority for the non-metropolitan district of Newcastle-under-Lyme in Staffordshire, England. Since the last boundary changes in 2018, 47 councillors have been elected from 21 wards. Prior to 2018 elections were held three years out of every four, with a third of the council elected each time.
Elections to Maidstone Borough Council in Kent, United Kingdom are held each year to elect one-third of its members, followed by one year without election. Since the last boundary changes in 2002, 55 councillors have been elected from 26 wards. From 2023 onwards, the format of elections will change, with all 55 councillors being elected once every 4 years.
Folkestone and Hythe District Council is the local authority for the Folkestone and Hythe District in Kent, England. The district was called Shepway prior to 2018. The council is elected every four years. Since the last boundary changes in 2015, 30 councillors have been elected from 13 wards.
Redcar and Cleveland Borough Council is the local authority for the unitary authority of Redcar and Cleveland in North Yorkshire, England. Until 1 April 1996 it was a non-metropolitan district in Cleveland, called Langbaurgh.
Erewash Borough Council elections are held every four years. Erewash Borough Council is the local authority for the non-metropolitan district of Erewash in Derbyshire, England. Since the last boundary changes in 2015, 47 councillors are elected from 19 wards.
Ribble Valley Borough Council elections are held every four years. Ribble Valley Borough Council is the local authority for the non-metropolitan district of Ribble Valley in Lancashire, England. Since the last boundary changes in 2019, 40 councillors have been elected from 26 wards.