The 2007 Harrogate Council election took place on 3 May 2007 to elect members of Harrogate Borough Council in North Yorkshire, England. One third of the council was up for election and the council stayed under no overall control. [1]
Borough status in the United Kingdom is granted by royal charter to local government districts in England, Wales and Northern Ireland. The status is purely honorary, and does not give any additional powers to the council or inhabitants of the district. In Scotland, similarly chartered communities were known as royal burghs, although the status is no longer granted.
North Yorkshire is a non-metropolitan county and largest ceremonial county in England. It is located primarily in the region of Yorkshire and the Humber but partly in the region of North East England. The estimated population of North Yorkshire was 602,300 in mid-2016.
England is a country that is part of the United Kingdom. It shares land borders with Wales to the west and Scotland to the north. The Irish Sea lies west of England and the Celtic Sea to the southwest. England is separated from continental Europe by the North Sea to the east and the English Channel to the south. The country covers five-eighths of the island of Great Britain, which lies in the North Atlantic, and includes over 100 smaller islands, such as the Isles of Scilly and the Isle of Wight.
After the election, the composition of the council was
The Conservative Party, officially the Conservative and Unionist Party, sometimes informally called the Tories, is a centre-right political party in the United Kingdom. The governing party since 2010, it is the largest in the House of Commons, with 312 Members of Parliament, and also has 249 members of the House of Lords, 4 members of the European Parliament, 31 Members of the Scottish Parliament, 11 members of the Welsh Assembly, eight members of the London Assembly and 8,916 local councillors.
The Liberal Democrats is a liberal political party in the United Kingdom. It is currently led by Vince Cable. The party has 12 Members of Parliament in the House of Commons, 96 members of the House of Lords, 16 members of the European Parliament, five Members of the Scottish Parliament and one member in both the Welsh Assembly and London Assembly. At the height of its influence, the party was in a coalition government with the Conservative Party from 2010 to 2015.
Before the election the Conservatives ran the council, but without a majority, with 27 seats, compared to 22 Liberal Democrats and 5 independents. [3] 20 seats were contested in the election, with 1 of the seats being a by-election in Marston Moor ward [4] after the resignation of the Conservative councillor. [5] Both the Conservatives and Liberal Democrats were defending 9 seats in the election, while independents held 2. [6]
By-elections, also spelled bye-elections, are used to fill elected offices that have become vacant between general elections.
A Councillor is a member of a local government council.
The election saw the British National Party contest 15 of the 20 seats, more than Labour who only contested 9 seats, and up from only 1 in 2006. [6] The leader of the British National Party Nick Griffin visited Ripon during the campaign, with the party campaigning against migrant workers, such as those from Poland, who they said were "undercutting British workers" by working for low wages. [6] For the first time the United Kingdom Independence Party also contested 2 seats in the election. [7]
The British National Party (BNP) is a far-right, fascist political party in the United Kingdom. It is headquartered in Wigton, Cumbria, and its current leader is Adam Walker. A minor party, it has no elected representatives at any level of UK government. Founded in 1982, the party reached its greatest level of success in the 2000s, when it had over fifty seats in local government, one seat on the London Assembly, and two Members of the European Parliament.
The Labour Party is a centre-left political party in the United Kingdom that has been described as an alliance of social democrats, democratic socialists and trade unionists. The party's platform emphasises greater state intervention, social justice and strengthening workers' rights.
Nicholas John Griffin is a British politician who represented North West England as a Member of the European Parliament (MEP) from 2009 to 2014. He served as chairman and then president of the far-right British National Party (BNP) from 1999 to 2014, when he was expelled from the party.
The results saw no party win a majority on the council after the Liberal Democrats gained 2 seats from the Conservatives. [8] The Liberal Democrats gained Bilton and Knaresborough King James from the Conservatives, but the Conservatives remained the largest party on the council with 25 seats compared to 23 for the Liberal Democrats. [8]
Bilton is a suburb of Harrogate, North Yorkshire, England, situated to the north-east of the town centre.
Knaresborough is a market and spa town and civil parish in the Borough of Harrogate, North Yorkshire, England, on the River Nidd 4 miles (6.4 km) east of Harrogate.
The balance on the council was held by 6 independents, after independents won all 3 seats contested in Ripon. [8] This included gaining Ripon Spa by 171 votes from Liberal Democrat Paul Freeman, who had held the seat for 16 years. [8] No other party won any seats, with the British National Party coming no better than third in every seat they contested, despite having 15 candidates. [8]
Party | Seats | Gains | Losses | Net gain/loss | Seats % | Votes % | Votes | +/− | |
---|---|---|---|---|---|---|---|---|---|
Liberal Democrat | 10 | 2 | 1 | +1 | 50.0 | 45.9 | 14,904 | +0.1% | |
Conservative | 7 | 0 | 2 | -2 | 35.0 | 38.0 | 12,331 | -2.4% | |
Independent | 3 | 1 | 0 | +1 | 15.0 | 8.1 | 2,640 | -1.6% | |
BNP | 0 | 0 | 0 | 0 | 0 | 4.3 | 1,386 | +3.8% | |
Labour | 0 | 0 | 0 | 0 | 0 | 3.3 | 1,055 | -0.3% | |
UKIP | 0 | 0 | 0 | 0 | 0 | 0.4 | 128 | +0.4% |
Party | Candidate | Votes | % | ± | |
---|---|---|---|---|---|
Liberal Democrat | Andrew Parkes | 974 | 49.4 | -3.0 | |
Conservative | Robin Adderley | 877 | 44.5 | +0.0 | |
Labour | Joel Banner | 122 | 6.2 | +3.1 | |
Majority | 97 | 4.9 | -3.0 | ||
Turnout | 1,973 | 46.9 | +5.8 | ||
Liberal Democrat gain from Conservative | Swing | ||||
Party | Candidate | Votes | % | ± | |
---|---|---|---|---|---|
Liberal Democrat | Margaret-Ann De Courcey-Bayley | 923 | 66.0 | -8.8 | |
Conservative | David Pearson | 296 | 21.2 | +0.7 | |
BNP | Steven Gill | 103 | 7.4 | +7.4 | |
Labour | Tom King | 76 | 5.4 | +0.7 | |
Majority | 627 | 44.8 | -9.5 | ||
Turnout | 1,398 | 31.7 | -0.2 | ||
Liberal Democrat hold | Swing |
Party | Candidate | Votes | % | ± | |
---|---|---|---|---|---|
Conservative | Simon Theakston | 1,057 | 62.0 | +0.2 | |
Liberal Democrat | Matthew Webber | 567 | 33.3 | -4.9 | |
Labour | Kevin McNerney | 81 | 4.8 | +4.8 | |
Majority | 490 | 28.7 | +5.1 | ||
Turnout | 1,705 | 40.8 | -0.1 | ||
Conservative hold | Swing |
Party | Candidate | Votes | % | ± | |
---|---|---|---|---|---|
Conservative | Andrew Jones | 815 | 54.0 | +2.1 | |
Liberal Democrat | Steve Macare | 522 | 34.6 | -8.6 | |
BNP | John Bray | 104 | 6.9 | +6.9 | |
Labour | Harry Mann | 69 | 4.6 | -0.3 | |
Majority | 293 | 19.4 | +10.7 | ||
Turnout | 1,510 | 34.5 | -3.3 | ||
Conservative hold | Swing |
Party | Candidate | Votes | % | ± | |
---|---|---|---|---|---|
Liberal Democrat | Reg Marsh | 1,202 | 65.4 | +3.8 | |
Conservative | Richard Cain | 467 | 25.4 | -9.9 | |
BNP | Frederick Johnson | 112 | 6.1 | +6.1 | |
Labour | Patricia Foxall | 57 | 3.1 | +0.0 | |
Majority | 735 | 40.0 | +13.7 | ||
Turnout | 1,838 | 41.9 | -0.5 | ||
Liberal Democrat hold | Swing |
Party | Candidate | Votes | % | ± | |
---|---|---|---|---|---|
Liberal Democrat | Keith Rothwell | 621 | 45.1 | -14.3 | |
Conservative | Chris Williams | 330 | 23.9 | -6.7 | |
Independent | Andy Wright | 270 | 19.6 | +19.6 | |
Labour | David Crosthwaite | 93 | 6.7 | -3.3 | |
BNP | Belinda Holdsworth | 64 | 4.6 | +4.6 | |
Majority | 291 | 21.1 | -7.7 | ||
Turnout | 1,378 | 35.4 | +0.2 | ||
Liberal Democrat hold | Swing |
Party | Candidate | Votes | % | ± | |
---|---|---|---|---|---|
Liberal Democrat | Jean Burdett | 1,031 | 55.5 | +5.6 | |
Conservative | Tim Hunter | 716 | 38.6 | -7.6 | |
Labour | Sam Clayton | 110 | 5.9 | +2.0 | |
Majority | 315 | 17.0 | +13.2 | ||
Turnout | 1,857 | 47.4 | -0.6 | ||
Liberal Democrat gain from Conservative | Swing | ||||
Party | Candidate | Votes | % | ± | |
---|---|---|---|---|---|
Liberal Democrat | Kevin Hawkins | 740 | 52.5 | -0.5 | |
Conservative | Nathan Smith | 496 | 35.2 | -3.1 | |
Labour | Alan Beatham | 95 | 6.7 | -2.0 | |
BNP | Mark Strike | 78 | 5.5 | +5.5 | |
Majority | 244 | 17.3 | +2.7 | ||
Turnout | 1,409 | 37.0 | -1.7 | ||
Liberal Democrat hold | Swing |
Party | Candidate | Votes | % | ± | |
---|---|---|---|---|---|
Conservative | Jean Butterfield | 862 | 54.3 | -0.7 | |
Liberal Democrat | Carol Brooks | 725 | 45.7 | +0.7 | |
Majority | 137 | 8.6 | -1.4 | ||
Turnout | 1,587 | 38.3 | +1.9 | ||
Conservative hold | Swing |
Party | Candidate | Votes | % | ± | |
---|---|---|---|---|---|
Conservative | John Savage | 630 | 65.9 | -12.2 | |
Liberal Democrat | Gill Firth | 326 | 34.1 | +12.2 | |
Majority | 304 | 31.8 | -24.5 | ||
Turnout | 956 | 43.8 | -12.1 | ||
Conservative hold | Swing |
Party | Candidate | Votes | % | ± | |
---|---|---|---|---|---|
Liberal Democrat | Trevor Chapman | 1,080 | 75.3 | +3.7 | |
Conservative | Lorien Pilling | 211 | 14.7 | -13.7 | |
BNP | Julie Brown | 92 | 6.4 | +6.4 | |
UKIP | John Upex | 51 | 3.6 | +3.6 | |
Majority | 869 | 60.6 | +17.4 | ||
Turnout | 1,434 | 35.4 | +1.0 | ||
Liberal Democrat hold | Swing |
Party | Candidate | Votes | % | ± | |
---|---|---|---|---|---|
Conservative | Mike Gardner | 1,455 | 66.3 | -7.4 | |
Liberal Democrat | Claire Kelley | 741 | 33.7 | +9.7 | |
Majority | 714 | 32.5 | -17.2 | ||
Turnout | 2,196 | 51.3 | +1.1 | ||
Conservative hold | Swing |
Party | Candidate | Votes | % | ± | |
---|---|---|---|---|---|
Independent | Sidney Hawke | 665 | 47.3 | +0.1 | |
Liberal Democrat | Steve Jones | 245 | 17.4 | +10.6 | |
Conservative | John Topping | 203 | 14.4 | +1.9 | |
Independent | Stanley Mackintosh | 160 | 11.4 | -17.1 | |
BNP | Tom Linden | 134 | 9.5 | +9.5 | |
Majority | 420 | 29.9 | +11.3 | ||
Turnout | 1,407 | 36.1 | +2.4 | ||
Independent hold | Swing |
Party | Candidate | Votes | % | ± | |
---|---|---|---|---|---|
Independent | Charles Powell | 913 | 61.4 | -27.1 | |
Liberal Democrat | John Stockdale | 255 | 17.2 | +17.2 | |
Conservative | Tony Simpson | 204 | 13.7 | +2.2 | |
BNP | Neil Smith | 114 | 7.7 | +7.7 | |
Majority | 658 | 44.3 | -22.8 | ||
Turnout | 1,486 | 38.7 | +1.1 | ||
Independent hold | Swing |
Party | Candidate | Votes | % | ± | |
---|---|---|---|---|---|
Independent | Peter Horton | 632 | 39.9 | -5.3 | |
Liberal Democrat | Paul Freeman | 461 | 29.1 | +4.6 | |
Conservative | Andrew Palmer | 366 | 23.1 | -7.2 | |
BNP | Michelle Shrubb | 123 | 7.8 | +7.8 | |
Majority | 171 | 10.8 | -4.2 | ||
Turnout | 1,582 | 39.4 | +1.3 | ||
Independent gain from Liberal Democrat | Swing | ||||
Party | Candidate | Votes | % | ± | |
---|---|---|---|---|---|
Conservative | Jim Clark | 1,393 | 59.8 | +3.1 | |
Liberal Democrat | James Jones | 882 | 37.8 | -5.5 | |
Labour | Michael Lawn | 56 | 2.4 | +2.4 | |
Majority | 511 | 21.9 | +8.4 | ||
Turnout | 2,331 | 49.9 | -0.9 | ||
Conservative hold | Swing |
Party | Candidate | Votes | % | ± | |
---|---|---|---|---|---|
Liberal Democrat | Geoffrey Webber | 807 | 55.7 | +2.9 | |
Conservative | Heather Adderley | 493 | 34.0 | -8.4 | |
UKIP | Ray Kidd | 77 | 5.3 | +5.3 | |
BNP | James Thackray | 71 | 4.9 | +4.9 | |
Majority | 314 | 21.7 | +11.4 | ||
Turnout | 1,448 | 35.2 | -3.4 | ||
Liberal Democrat hold | Swing |
Party | Candidate | Votes | % | ± | |
---|---|---|---|---|---|
Liberal Democrat | Granville Ward | 1,081 | 72.2 | +7.7 | |
Conservative | Phillip Dixon | 195 | 13.0 | -0.8 | |
BNP | Colin Banner | 146 | 9.7 | -1.0 | |
Labour | Geoff Foxall | 76 | 5.1 | +0.5 | |
Majority | 886 | 59.1 | +8.5 | ||
Turnout | 1,498 | 35.2 | -0.8 | ||
Liberal Democrat hold | Swing |
Party | Candidate | Votes | % | ± | |
---|---|---|---|---|---|
Conservative | Pat Jones | 1,034 | 54.5 | -1.3 | |
Liberal Democrat | Nick Anderson | 811 | 42.8 | -1.4 | |
BNP | Robert Green | 51 | 2.7 | +2.7 | |
Majority | 223 | 11.8 | +0.3 | ||
Turnout | 1,896 | 44.7 | -0.2 | ||
Conservative hold | Swing |
Party | Candidate | Votes | % | ± | |
---|---|---|---|---|---|
Liberal Democrat | John Wren | 910 | 58.5 | -7.3 | |
Conservative | Mary Dilworth | 231 | 14.9 | -2.7 | |
Labour | Daniel Maguire | 220 | 14.1 | -2.6 | |
BNP | Russell Taylor | 194 | 12.5 | +12.5 | |
Majority | 679 | 43.7 | -4.5 | ||
Turnout | 1,555 | 37.7 | +0.4 | ||
Liberal Democrat hold | Swing |
One third of Harrogate Borough Council in North Yorkshire, England is elected each year, followed by one year without election. Since the last boundary changes in 2002, 54 councillors have been elected from 35 wards.
The Leeds City Council election took place on 2 May 2002 to elect members of City of Leeds Metropolitan Borough Council in West Yorkshire, England. Prior to the election, there had been several by-elections held with no change to the council composition. One third of the council was up for election and the Labour party stayed in overall control of the council.
The 2007 Swindon Borough Council election took place on 4 May 2007 to elect members of Swindon Unitary Council in Wiltshire, England. One third of the council was up for election and the Conservative party stayed in overall control of the council.
The 2000 Harrogate Council election took place on 4 May 2000 to elect members of Harrogate Borough Council in North Yorkshire, England. One third of the council was up for election and the Liberal Democrats stayed in overall control of the council.
The 2002 Harrogate Council election took place on 2 May 2002 to elect members of Harrogate Borough Council in North Yorkshire, England. The whole council was up for election with boundary changes since the last election in 2000 reducing the number of seats by 5. The Liberal Democrats lost overall control of the council to no overall control.
The 2003 Harrogate Council election took place on 1 May 2003 to elect members of Harrogate Borough Council in North Yorkshire, England. One third of the council was up for election and the council stayed under no overall control.
The 2004 Harrogate Council election took place on 10 June 2004 to elect members of Harrogate Borough Council in North Yorkshire, England. One third of the council was up for election and the Conservative party stayed in overall control of the council.
The 2006 Harrogate Council election took place on 4 May 2006 to elect members of Harrogate Borough Council in North Yorkshire, England. One third of the council was up for election and the Conservative party lost overall control of the council to no overall control.
The 2008 Harrogate Council election took place on 1 May 2008 to elect members of Harrogate Borough Council in North Yorkshire, England. One third of the council was up for election and the council stayed under no overall control.
The 2010 Harrogate Council election took place on 6 May 2010 to elect members of Harrogate Borough Council in North Yorkshire, England. One third of the council was up for election and the Conservative party gained overall control of the council from no overall control.
The 2007 Pendle Borough Council election took place on 3 May 2007 to elect members of Pendle Borough Council in Lancashire, England. One third of the council was up for election and the Liberal Democrats stayed in overall control of the council.
The 2010 Woking Council election took place on 1 May 2010, on the same day as the 2010 general election, to elect members of Woking Borough Council in Surrey, England. One third of the council was up for election and the council stayed under no overall control.
The 1999 Sandwell Metropolitan Borough Council election took place on 6 May 1999 to elect members of Sandwell Metropolitan Borough Council in the West Midlands, England. One third of the council was up for election and the Labour party stayed in overall control of the council.
The 2007 Maidstone Borough Council election took place on 3 May 2007 to elect members of Maidstone Borough Council in Kent, England. One third of the council was up for election and the council stayed under no overall control.
The eighth full elections for Guildford Borough Council took place on 6 May 1999.
The 2011 council elections in Guildford saw the Conservatives retain control over Guildford Borough Council with an increased majority of 20 seats. Full results for each ward can be found at Guildford Council election, full results, 2011.
The 2011 Sandwell Metropolitan Borough Council election took place on 5 May 2011 to elect members of Sandwell Metropolitan Borough Council in the West Midlands, England. One third of the council was up for election and the Labour party stayed in overall control of the council.
The 2007 Redcar and Cleveland Borough Council election took place on 3 May 2007 to elect members of Redcar and Cleveland Unitary Council in England. The whole council was up for election and the council stayed under no overall control.
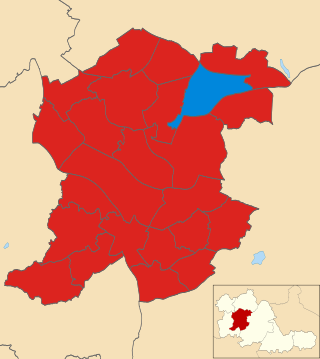
Elections to Harrogate Borough Council were held on 22 May 2014. A third of the council was up for election, with voting only in the urban wards of Harrogate, Knaresborough and Ripon. The elections were held on the same day as the British local elections and the European Parliament elections. Each ward up for election returned a councillor for a four-year term of office.
The 2014 Craven District Council election took place on 22 May 2014 to elect members of Craven District Council in North Yorkshire, England. One third of the council was up for election and the Conservative party stayed in overall control of the council.