The 2007 Pendle Borough Council election took place on 3 May 2007 to elect members of Pendle Borough Council in Lancashire, England. One third of the council was up for election and the Liberal Democrats stayed in overall control of the council. [1]
After the election, the composition of the council was
Before the election the Liberal Democrats had a majority on the council with 26 seats, compared to 13 for the Conservatives, 5 for Labour, 3 independents and 1 British National Party. [3] There was also one vacant seat after a councillor, Mary Norcross, died in March 2007. [3] The Liberal Democrat majority had been reduced since the 2006 election after 3 councillors left the party to become independents. [3]
17 seats were being contested in the election with the Liberal Democrats defending 8 seats, the Conservatives 6 and independents 3. [4] There were a total of 64 candidates in the election, [4] with the Liberal Democrats and Conservatives contesting every seat. [3] Other parties contesting the election including Labour with 16 candidates, 6 from the British National Party, 3 Green Party and 2 United Kingdom Independence Party. [3] There were also some independent candidates, with 3 being the sitting independent, formerly Liberal Democrat, councillors. [3]
Issues in the election included council tax, the environment, phone masts, refuse collection and regeneration. [4] There was also controversy over the candidature of independent Ian Robinson in Waterside, after a Liberal Democrat councillor in the same ward signed his nomination papers. [5]
The election saw a drop of about 3% in the number of voters registered to vote by post to 7,562. [6]
The results saw the Liberal Democrats stay in control of the council after regaining the 3 independent seats, but losing another 2 seats. [7] This meant they held 27 seats and had an overall majority of 7. [7] The Conservatives gained Boulsworth from the Liberal Democrats by 7 votes after 3 recounts to have 14 seats, while Labour went up to 6 seats after taking Bradley by 226 votes. [7] The British National Party remained on 1 seat, after no other party won any seats in the election. [7] Overall turnout in the election was 44.6%. [8]
Party | Seats | Gains | Losses | Net gain/loss | Seats % | Votes % | Votes | +/− | |
---|---|---|---|---|---|---|---|---|---|
Liberal Democrats | 9 | 3 | 2 | +1 | 52.9 | 34.8 | 8,650 | -5.8% | |
Conservative | 7 | 1 | 0 | +1 | 41.2 | 34.6 | 8,600 | +8.6% | |
Labour | 1 | 1 | 0 | +1 | 5.9 | 17.7 | 4,399 | -5.3% | |
BNP | 0 | 0 | 0 | 0 | 0 | 7.0 | 1,737 | -3.4% | |
Independent | 0 | 0 | 3 | -3 | 0 | 4.3 | 1,065 | +4.3% | |
Green | 0 | 0 | 0 | 0 | 0 | 1.2 | 303 | +1.2% | |
UKIP | 0 | 0 | 0 | 0 | 0 | 0.5 | 133 | +0.5% | |
Party | Candidate | Votes | % | ±% | |
---|---|---|---|---|---|
Conservative | Linda Crossley | 1,087 | 66.9 | +21.7 | |
Labour | Susan Nike | 411 | 25.3 | +14.0 | |
Liberal Democrats | Derek Mann | 126 | 7.8 | -35.7 | |
Majority | 676 | 41.6 | +39.9 | ||
Turnout | 1,624 | 41.6 | -0.1 | ||
Conservative hold | Swing | ||||
Party | Candidate | Votes | % | ±% | |
---|---|---|---|---|---|
Conservative | Shelagh Derwent | 566 | 79.8 | -4.6 | |
Labour | John Pope | 80 | 11.3 | +1.8 | |
Liberal Democrats | Darren Reynolds | 63 | 8.9 | +2.8 | |
Majority | 486 | 68.5 | -6.4 | ||
Turnout | 709 | 49.5 | +0.4 | ||
Conservative hold | Swing | ||||
Party | Candidate | Votes | % | ±% | |
---|---|---|---|---|---|
Conservative | Violet Vaughan | 647 | 36.9 | +5.9 | |
Liberal Democrats | David Robertson | 640 | 36.5 | -0.5 | |
BNP | Jane Mulligan | 271 | 15.5 | -9.7 | |
Labour | Jillian Allanson | 121 | 6.9 | +0.2 | |
Green | Leah Jamieson | 74 | 4.2 | +4.2 | |
Majority | 7 | 0.4 | |||
Turnout | 1,753 | 43.4 | -3.0 | ||
Conservative gain from Liberal Democrats | Swing | ||||
Party | Candidate | Votes | % | ±% | |
---|---|---|---|---|---|
Labour | Nadeem Younis | 1,026 | 44.0 | -2.0 | |
Liberal Democrats | Mohammed Munir | 800 | 34.3 | -8.2 | |
Conservative | Victoria Landriau | 344 | 14.7 | +3.1 | |
Green | Christine Stables | 164 | 7.0 | +7.0 | |
Majority | 226 | 9.7 | +6.2 | ||
Turnout | 2,334 | 51.1 | +3.1 | ||
Labour gain from Liberal Democrats | Swing | ||||
Party | Candidate | Votes | % | ±% | |
---|---|---|---|---|---|
Liberal Democrats | Nawaz Ahmed | 943 | 49.7 | +9.6 | |
Conservative | Ann Jackson | 537 | 28.3 | -1.6 | |
Labour | Robert Allen | 416 | 21.9 | -8.2 | |
Majority | 406 | 21.4 | +11.4 | ||
Turnout | 1,896 | 50.6 | +8.3 | ||
Liberal Democrats hold | Swing | ||||
Party | Candidate | Votes | % | ±% | |
---|---|---|---|---|---|
Liberal Democrats | Gary Bird | 570 | 32.8 | -11.4 | |
Labour | Eileen Ansar | 415 | 23.9 | +2.1 | |
BNP | Trevor Dawson | 336 | 19.3 | -5.3 | |
Conservative | Timothy Eyre | 208 | 12.0 | +2.6 | |
Independent | Kate Shore | 163 | 9.4 | +9.4 | |
UKIP | John Banks | 45 | 2.6 | +2.6 | |
Majority | 155 | 8.9 | -10.6 | ||
Turnout | 1,737 | 45.5 | +2.2 | ||
Liberal Democrats gain from Independent | Swing | ||||
Party | Candidate | Votes | % | ±% | |
---|---|---|---|---|---|
Liberal Democrats | Allan Buck | 745 | 49.7 | -14.9 | |
Independent | Jennifer Purcell | 410 | 27.4 | +27.4 | |
Conservative | Beverley Harrison | 205 | 13.7 | -8.0 | |
Labour | Ian Tweedie | 139 | 9.3 | -4.4 | |
Majority | 335 | 22.3 | -20.6 | ||
Turnout | 1,499 | 37.5 | -1.6 | ||
Liberal Democrats hold | Swing | ||||
Party | Candidate | Votes | % | ±% | |
---|---|---|---|---|---|
Liberal Democrats | Martin Bell | 736 | 46.9 | -3.4 | |
Independent | Marlene Hill-Crane | 428 | 27.3 | +27.3 | |
Conservative | Sandra Sargeant | 405 | 25.8 | +9.4 | |
Majority | 308 | 19.6 | -5.7 | ||
Turnout | 1,569 | 38.0 | -6.1 | ||
Liberal Democrats gain from Independent | Swing | ||||
Party | Candidate | Votes | % | ±% | |
---|---|---|---|---|---|
Conservative | Morris Horsfield | 1,264 | 69.1 | +9.9 | |
Liberal Democrats | Jackie Taylforth | 324 | 17.7 | -8.5 | |
Labour | James Metcalfe | 240 | 13.1 | -1.5 | |
Majority | 940 | 51.4 | +18.4 | ||
Turnout | 1,828 | 40.9 | -1.3 | ||
Conservative hold | Swing | ||||
Party | Candidate | Votes | % | ±% | |
---|---|---|---|---|---|
Conservative | Carol Belshaw | 342 | 56.1 | -5.9 | |
Liberal Democrats | Geoffrey Cole | 132 | 21.6 | +7.7 | |
UKIP | Graham Cannon | 88 | 14.4 | +14.4 | |
Labour | Frank Allanson | 48 | 7.9 | -16.2 | |
Majority | 210 | 34.4 | -3.6 | ||
Turnout | 610 | 44.7 | +9.1 | ||
Conservative hold | Swing | ||||
Party | Candidate | Votes | % | ±% | |
---|---|---|---|---|---|
Conservative | James Starkie | 520 | 62.4 | +10.9 | |
Liberal Democrats | William Boylan | 264 | 31.7 | -7.5 | |
Labour | Robert Oliver | 49 | 5.9 | -3.4 | |
Majority | 256 | 30.7 | +18.5 | ||
Turnout | 833 | 60.9 | +10.0 | ||
Conservative hold | Swing | ||||
Party | Candidate | Votes | % | ±% | |
---|---|---|---|---|---|
Liberal Democrats | Ann Kerrigan | 651 | 43.7 | +0.5 | |
Conservative | Smith Benson | 314 | 21.1 | +9.0 | |
BNP | Geoffrey Whitehead | 295 | 19.8 | -9.0 | |
Labour | David Foat | 231 | 15.5 | -0.4 | |
Majority | 337 | 22.6 | +8.2 | ||
Turnout | 1,491 | 37.6 | -2.3 | ||
Liberal Democrats hold | Swing | ||||
Party | Candidate | Votes | % | ±% | |
---|---|---|---|---|---|
Liberal Democrats | John David | 462 | 66.0 | -14.1 | |
Conservative | Anthony Belshaw | 212 | 30.3 | +10.4 | |
Labour | Anthony Hargreaves | 26 | 3.7 | +3.7 | |
Majority | 250 | 35.7 | -24.5 | ||
Turnout | 700 | 58.1 | +1.6 | ||
Liberal Democrats hold | Swing | ||||
Party | Candidate | Votes | % | ±% | |
---|---|---|---|---|---|
Conservative | Tonia Barton | 1,222 | 63.6 | ||
Labour | Saad Khaliq | 380 | 19.8 | ||
Liberal Democrats | Abdul Malik | 320 | 16.6 | ||
Majority | 842 | 43.8 | |||
Turnout | 1,922 | 47.1 | +1.0 | ||
Conservative hold | Swing | ||||
Party | Candidate | Votes | % | ±% | |
---|---|---|---|---|---|
Liberal Democrats | Sonia Robinson | 634 | 40.6 | +0.6 | |
Labour | Sheila Wicks | 364 | 23.3 | -19.6 | |
Conservative | Paul McKenna | 282 | 18.1 | +1.0 | |
BNP | Judith Preston | 280 | 17.9 | +17.9 | |
Majority | 270 | 17.3 | |||
Turnout | 1,560 | 38.7 | +16.7 | ||
Liberal Democrats hold | Swing | ||||
Party | Candidate | Votes | % | ±% | |
---|---|---|---|---|---|
Liberal Democrats | Howard Thomas | 641 | 45.9 | ||
Conservative | Geoffrey Riley | 274 | 19.6 | ||
BNP | Veronica Cullen | 272 | 19.5 | ||
Labour | Tony Martin | 211 | 15.1 | ||
Majority | 367 | 26.3 | |||
Turnout | 1,398 | 34.8 | -3.5 | ||
Liberal Democrats hold | Swing | ||||
Party | Candidate | Votes | % | ±% | |
---|---|---|---|---|---|
Liberal Democrats | Graham Roach | 599 | 42.1 | -16.4 | |
BNP | Adam Grant | 283 | 19.9 | +19.9 | |
Labour | Gerry McCabe | 242 | 17.0 | -9.4 | |
Conservative | Peter Hill | 171 | 12.0 | -3.0 | |
Green | Anastasia Hartley-Fish | 65 | 4.6 | +4.6 | |
Independent | Ian Robinson | 64 | 4.5 | +4.5 | |
Majority | 316 | 22.2 | -9.9 | ||
Turnout | 1,424 | 38.2 | +7.1 | ||
Liberal Democrats gain from Independent | Swing | ||||
A by-election took place on 28 June 2007 after the death of Liberal Democrat councillor Mary Norcross. [10] Twenty-six-year-old Shelley Franklin held the seat for the Liberal Democrats with a majority of 372 votes over the Conservatives. [10]
Party | Candidate | Votes | % | ±% | |
---|---|---|---|---|---|
Liberal Democrats | Shelley Franklin | 632 | 43.7 | -3.2 | |
Conservative | Sandra Sargeant | 260 | 18.0 | -7.8 | |
Independent | Jennifer Purcell | 241 | 16.7 | -10.6 | |
BNP | Geoffrey Whitehead | 237 | 16.4 | +16.4 | |
Labour | Ian Tweedie | 76 | 5.3 | +5.3 | |
Majority | 372 | 25.7 | +6.1 | ||
Turnout | 1,446 | 34.7 | -3.3 | ||
Liberal Democrats hold | Swing | ||||
The For Darwen Party was a local political party in Darwen, south of Blackburn, England, with a platform that Darweners were not properly represented on Blackburn with Darwen Borough Council.
The 2007 council elections in Guildford saw the Conservatives retain control over Guildford Borough Council. Full results for each ward can be found at Guildford Council election, full results, 2007.
The 1998 Burnley Borough Council election took place on 7 May 1998 to elect members of Burnley Borough Council in Lancashire, England. One third of the council was up for election and the Labour Party stayed in overall control of the council.
The 1999 Burnley Borough Council election took place on 6 May 1999 to elect members of Burnley Borough Council in Lancashire, England. One third of the council was up for election and the Labour Party stayed in overall control of the council.
The 2000 Burnley Borough Council election took place on 4 May 2000 to elect members of Burnley Borough Council in Lancashire, England. One third of the council was up for election and the Labour Party lost overall control of the council to no overall control.
The 2010 Rossendale Borough Council election took place on 6 May 2010 to elect members of Rossendale Borough Council in Lancashire, England. One third of the council was up for election and the Conservative Party stayed in overall control of the council.
The 1998 Pendle Borough Council election took place on 7 May 1998 to elect members of Pendle Borough Council in Lancashire, England. One third of the council was up for election and the Liberal Democrats stayed in overall control of the council.
The 1999 Pendle Borough Council election took place on 6 May 1999 to elect members of Pendle Borough Council in Lancashire, England. One third of the council was up for election and the Liberal Democrats lost overall control of the council to no overall control.
The 2000 Pendle Borough Council election took place on 4 May 2000 to elect members of Pendle Borough Council in Lancashire, England. One third of the council was up for election and the council stayed under no overall control.
The 2002 Pendle Borough Council election took place on 2 May 2002 to elect members of Pendle Borough Council in Lancashire, England. The whole council was up for election with boundary changes since the last election in 2000 reducing the number of seats by 2. The council stayed under no overall control.
The 2003 Pendle Borough Council election took place on 1 May 2003 to elect members of Pendle Borough Council in Lancashire, England. One third of the council was up for election and the council stayed under no overall control.
The 2004 Pendle Borough Council election took place on 10 June 2004 to elect members of Pendle Borough Council in Lancashire, England. One third of the council was up for election and the Liberal Democrats gained overall control of the council from no overall control.
The 2006 Pendle Borough Council election took place on 4 May 2006 to elect members of Pendle Borough Council in Lancashire, England. One third of the council was up for election and the Liberal Democrats stayed in overall control of the council.
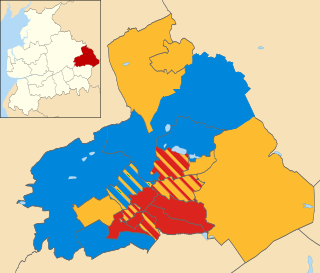
The 2008 Pendle Borough Council election took place on 1 May 2008 to elect members of Pendle Borough Council in Lancashire, England. One third of the council was up for election and the Liberal Democrats lost overall control of the council to no overall control.
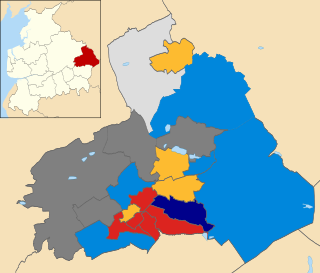
The 2010 Pendle Borough Council election took place on 6 May 2010 to elect members of Pendle Borough Council in Lancashire, England. One third of the council was up for election and the council stayed under no overall control.
The 2003 Hertsmere Borough Council election took place on 1 May 2003 to elect members of Hertsmere Borough Council in Hertfordshire, England. One third of the council was up for election and the Conservative Party stayed in overall control of the council.
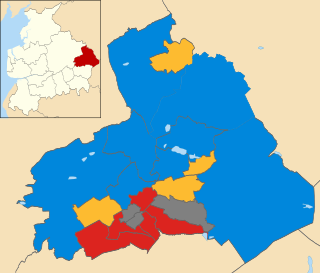
The 2011 Pendle Borough Council election took place on 5 May 2011 to elect members of Pendle Borough Council in Lancashire, England. One third of the council was up for election and the council stayed under no overall control.
The 2012 Pendle Borough Council election took place on 3 May 2012 to elect members of Pendle Borough Council in Lancashire, England. One third of the council was up for election and the council stayed under no overall control.
The 2014 Pendle Borough Council election took place on 22 May 2014 to elect members of Pendle Borough Council in Lancashire, England. One third of the council was up for election and the council stayed under no overall control.
Brian Parker is an English politician who served as councillor on Pendle Borough Council for the Marsden ward of Nelson, Lancashire, between 2006 and his retirement in 2018. He is perhaps best known for being the longest-serving far-right local councillor in British history, and for being the last elected representative of the far-right British National Party (BNP). He is currently a member of the British Democratic Party, and has publicly stated that "I am opposed to all black and brown immigration".