| |||||||||||||||||||||||||||||||||||||||||||||||||||||||||||
20 out of 60 seats to Chester City Council 31 seats needed for a majority | |||||||||||||||||||||||||||||||||||||||||||||||||||||||||||
---|---|---|---|---|---|---|---|---|---|---|---|---|---|---|---|---|---|---|---|---|---|---|---|---|---|---|---|---|---|---|---|---|---|---|---|---|---|---|---|---|---|---|---|---|---|---|---|---|---|---|---|---|---|---|---|---|---|---|---|
| |||||||||||||||||||||||||||||||||||||||||||||||||||||||||||
Winner of each seat at the 1995 Chester City Council election | |||||||||||||||||||||||||||||||||||||||||||||||||||||||||||
|
The 1995 Chester City Council election took place on 4 May 1995 to elect members of Chester City Council in Cheshire, England. [1] This was on the same day as other local elections.
1995 Chester City Council election | ||||||||||
---|---|---|---|---|---|---|---|---|---|---|
Party | This election | Full council | This election | |||||||
Seats | Net | Seats % | Other | Total | Total % | Votes | Votes % | +/− | ||
Labour | 8 | 4 | 40.0 | 15 | 23 | 38.3 | 15,176 | 45.3 | +0.2 | |
Conservative | 6 | 4 | 30.0 | 13 | 19 | 31.7 | 8,984 | 26.8 | –2.4 | |
Liberal Democrats | 5 | 25.0 | 11 | 16 | 26.7 | 7,909 | 23.6 | –1.4 | ||
Independent | 1 | 5.0 | 1 | 2 | 3.3 | 1,300 | 3.9 | N/A | ||
Ratepayer | 0 | 0.0 | 0 | 0 | 0.0 | 104 | 0.3 | –0.2 | ||
Party | Candidate | Votes | % | ±% | |
---|---|---|---|---|---|
Conservative | B. Roberts | 696 | 45.5 | –9.0 | |
Labour | R. Barlow | 567 | 37.1 | –8.4 | |
Liberal Democrats | U. Gerstl | 266 | 17.4 | N/A | |
Majority | 129 | 8.4 | –0.7 | ||
Turnout | 1,529 | 39.3 | –1.7 | ||
Registered electors | 3,887 | ||||
Conservative hold | Swing | 0.3 | |||
Party | Candidate | Votes | % | ±% | |
---|---|---|---|---|---|
Labour | L. Price* | 1,118 | 89.1 | –3.4 | |
Conservative | E. Margerum | 89 | 7.1 | –0.4 | |
Liberal Democrats | H. Prydderch | 48 | 3.8 | N/A | |
Majority | 1,029 | 82.0 | –3.0 | ||
Turnout | 1,255 | 30.6 | –0.4 | ||
Registered electors | 4,102 | ||||
Labour hold | Swing | 1.5 | |||
Party | Candidate | Votes | % | ±% | |
---|---|---|---|---|---|
Liberal Democrats | A. Farrell* | 1,087 | 52.2 | –0.8 | |
Labour | E. Davies | 512 | 24.6 | +5.5 | |
Conservative | P. Gaskin | 484 | 23.2 | –4.6 | |
Majority | 575 | 27.6 | +2.4 | ||
Turnout | 2,083 | 46.0 | –5.0 | ||
Registered electors | 4,524 | ||||
Liberal Democrats hold | Swing | 3.2 | |||
Party | Candidate | Votes | % | ±% | |
---|---|---|---|---|---|
Conservative | J. Boughton | 846 | 47.3 | –13.6 | |
Labour | S. Wardman | 588 | 32.9 | +12.9 | |
Liberal Democrats | I. Mottershaw | 354 | 19.8 | +0.7 | |
Majority | 258 | 14.4 | –27.8 | ||
Turnout | 1,768 | 46.0 | –0.4 | ||
Registered electors | 3,888 | ||||
Conservative hold | Swing | 13.3 | |||
Party | Candidate | Votes | % | ±% | |
---|---|---|---|---|---|
Labour | E. Degg | 1,203 | 67.5 | –0.6 | |
Conservative | S. Barclay | 342 | 19.2 | –3.8 | |
Liberal Democrats | J. Indermaur | 132 | 7.4 | N/A | |
Ratepayer | D. Taylor | 104 | 5.8 | –3.1 | |
Majority | 861 | 48.3 | +3.1 | ||
Turnout | 1,781 | 37.6 | +1.6 | ||
Registered electors | 4,738 | ||||
Labour hold | Swing | 1.6 | |||
Party | Candidate | Votes | % | ±% | |
---|---|---|---|---|---|
Labour | M. Nelson* | 1,098 | 83.2 | –2.5 | |
Conservative | J. Jaworzyn | 150 | 11.4 | –2.9 | |
Liberal Democrats | L. Biddle | 71 | 5.4 | N/A | |
Majority | 948 | 71.9 | +0.4 | ||
Turnout | 1,319 | 30.0 | –1.0 | ||
Registered electors | 4,393 | ||||
Labour hold | Swing | 0.2 | |||
Party | Candidate | Votes | % | ±% | |
---|---|---|---|---|---|
Conservative | W. Fair* | 421 | 51.0 | –17.7 | |
Labour | A. Porter | 323 | 39.2 | +21.1 | |
Liberal Democrats | K. Prydderch | 81 | 9.8 | –3.4 | |
Majority | 98 | 11.9 | –38.8 | ||
Turnout | 825 | 49.0 | –5.4 | ||
Registered electors | 1,684 | ||||
Conservative hold | Swing | 19.4 | |||
Party | Candidate | Votes | % | ±% | |
---|---|---|---|---|---|
Labour | D. Bennett | 1,023 | 53.6 | –5.5 | |
Conservative | D. Rowlands* | 726 | 38.1 | –2.8 | |
Liberal Democrats | G. Ralph | 158 | 8.3 | N/A | |
Majority | 297 | 15.6 | –2.5 | ||
Turnout | 1,907 | 39.0 | –6.0 | ||
Registered electors | 4,870 | ||||
Labour gain from Conservative | Swing | 1.4 | |||
Party | Candidate | Votes | % | ±% | |
---|---|---|---|---|---|
Labour | R. Davidson | 1,117 | 49.3 | –8.1 | |
Conservative | C. White | 781 | 34.5 | –8.1 | |
Liberal Democrats | T. Crossland | 368 | 16.2 | N/A | |
Majority | 336 | 14.8 | –0.1 | ||
Turnout | 2,266 | 52.0 | ±0.0 | ||
Registered electors | 4,344 | ||||
Labour gain from Conservative | Swing | 0.0 | |||
Party | Candidate | Votes | % | ±% | |
---|---|---|---|---|---|
Liberal Democrats | J. Smith* | 1,202 | 53.0 | –4.1 | |
Labour | D. Kelly | 1,064 | 47.0 | +11.4 | |
Majority | 138 | 6.1 | –15.5 | ||
Turnout | 2,266 | 47.9 | –1.1 | ||
Registered electors | 4,726 | ||||
Liberal Democrats hold | Swing | 7.8 | |||
Party | Candidate | Votes | % | ±% | |
---|---|---|---|---|---|
Conservative | L. Crump* | 685 | 62.7 | +13.7 | |
Labour | S. Davies | 298 | 27.3 | N/A | |
Liberal Democrats | N. Banks | 110 | 10.1 | N/A | |
Majority | 387 | 35.4 | N/A | ||
Turnout | 1,093 | 35.8 | –4.4 | ||
Registered electors | 3,051 | ||||
Conservative hold | |||||
Party | Candidate | Votes | % | ±% | |
---|---|---|---|---|---|
Liberal Democrats | D. Simpson* | 795 | 43.4 | –9.2 | |
Labour | W. Megarrell | 521 | 28.5 | +8.9 | |
Conservative | J. Smith | 515 | 28.1 | +0.3 | |
Majority | 274 | 15.0 | –9.8 | ||
Turnout | 1,831 | 45.7 | –6.3 | ||
Registered electors | 4,007 | ||||
Liberal Democrats hold | Swing | 9.1 | |||
Party | Candidate | Votes | % | ±% | |
---|---|---|---|---|---|
Liberal Democrats | R. Hale* | 921 | 56.0 | –3.3 | |
Labour | G. Criag | 723 | 44.0 | +15.7 | |
Majority | 198 | 12.0 | –19.0 | ||
Turnout | 1,644 | 45.2 | –6.8 | ||
Registered electors | 3,637 | ||||
Liberal Democrats hold | Swing | 9.5 | |||
Party | Candidate | Votes | % | ±% | |
---|---|---|---|---|---|
Conservative | R. Storrar | 609 | 38.9 | –9.6 | |
Liberal Democrats | J. Pemberton | 479 | 30.6 | –10.6 | |
Labour | C. Gahan | 477 | 30.5 | +20.2 | |
Majority | 130 | 8.3 | +1.1 | ||
Turnout | 1,565 | 52.2 | +3.2 | ||
Registered electors | 2,998 | ||||
Conservative hold | Swing | 0.5 | |||
Party | Candidate | Votes | % | ±% | |
---|---|---|---|---|---|
Labour | D. Nield | 1,180 | 80.7 | +23.3 | |
Conservative | C. Pearson | 150 | 10.3 | –14.0 | |
Liberal Democrats | R. Price | 133 | 9.1 | –9.2 | |
Majority | 1,030 | 70.4 | +37.3 | ||
Turnout | 1,463 | 37.0 | –5.0 | ||
Registered electors | 3,953 | ||||
Labour hold | Swing | 18.7 | |||
Party | Candidate | Votes | % | ±% | |
---|---|---|---|---|---|
Conservative | C. Plenderleath* | 605 | 53.5 | –19.9 | |
Labour | A. Pegrum | 434 | 38.4 | +11.8 | |
Liberal Democrats | S. Plank | 92 | 8.1 | N/A | |
Majority | 171 | 15.1 | –31.8 | ||
Turnout | 1,131 | 33.7 | –11.5 | ||
Registered electors | 3,355 | ||||
Conservative hold | Swing | 15.9 | |||
Party | Candidate | Votes | % | ±% | |
---|---|---|---|---|---|
Independent | J. Haynes* | 723 | 65.9 | N/A | |
Conservative | I. Cross | 219 | 20.0 | –25.6 | |
Liberal Democrats | M. Richardson | 155 | 14.1 | +0.9 | |
Majority | 504 | 45.9 | N/A | ||
Turnout | 1,097 | 42.0 | –2.0 | ||
Registered electors | 2,614 | ||||
Independent hold | |||||
Party | Candidate | Votes | % | ±% | |
---|---|---|---|---|---|
Labour | N. Dixon | 1,065 | 48.5 | +1.9 | |
Conservative | J. Cliffe* | 663 | 30.2 | +2.0 | |
Liberal Democrats | R. Biddle | 385 | 17.5 | –7.7 | |
Independent | J. Starkey | 81 | 3.7 | N/A | |
Majority | 402 | 18.3 | –0.1 | ||
Turnout | 2,194 | 54.0 | –3.0 | ||
Registered electors | 4,043 | ||||
Labour gain from Conservative | Swing | 0.1 | |||
Party | Candidate | Votes | % | ±% | |
---|---|---|---|---|---|
Liberal Democrats | S. Proctor* | 1,072 | 55.0 | –6.3 | |
Labour | C. Jones | 543 | 27.9 | +7.6 | |
Conservative | D. Gauke | 333 | 17.1 | –1.4 | |
Majority | 529 | 27.2 | –13.8 | ||
Turnout | 1,948 | 44.3 | –1.7 | ||
Registered electors | 4,395 | ||||
Liberal Democrats hold | Swing | 7.0 | |||
Party | Candidate | Votes | % | ±% | |
---|---|---|---|---|---|
Labour | S. Murphy | 1,322 | 53.1 | +4.7 | |
Conservative | D. Bithell | 670 | 26.9 | –9.0 | |
Independent | R. Croft* | 496 | 19.9 | N/A | |
Majority | 652 | 26.2 | +13.7 | ||
Turnout | 2,488 | 48.3 | –3.7 | ||
Registered electors | 5,150 | ||||
Labour gain from Conservative | Swing | 6.9 | |||
Chester is a city in Delaware County, Pennsylvania, United States. It is located in the Delaware Valley on the western bank of the Delaware River between Philadelphia and Wilmington, Delaware. The population of Chester was 32,605 at the 2020 census.
Chester is a cathedral city and the county town of Cheshire, England, on the River Dee, close to the England-Wales border. With a built up area population of 92,400 in 2021, it is the most populous settlement of Cheshire West and Chester and serves as its administrative headquarters. It is also the historic county town of Cheshire and the second-largest settlement in Cheshire after Warrington.
Ellesmere Port and Neston was, from 1974 to 2009, a local government district with borough status in Cheshire, England. It covered the southern part of the Wirral Peninsula, namely that part which is not included in the Metropolitan Borough of Wirral.
Chester was a non-metropolitan local government district of Cheshire, England from 1974 to 2009. It had the status of a city and a borough, and the local authority was called Chester City Council.
The City of Chester is a constituency represented in the House of Commons of the UK Parliament since 2 December 2022 by Samantha Dixon of the Labour Party. She was elected in the by-election held following the resignation of Chris Matheson MP on 21 October 2022.
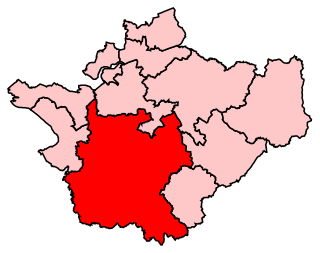
Eddisbury is a constituency in Cheshire represented in the House of Commons of the UK Parliament since 2019 by Edward Timpson, a Conservative.
Ellesmere Port and Neston is a constituency represented in the House of Commons of the UK Parliament since 2015 by Justin Madders of the Labour Party.
Chestler-le-Street District Council elections were generally held every four years between the council's creation in 1974 and its abolition in 2009. Chester-le-Street was a non-metropolitan district in County Durham, England. On 1 April 2009 the council's functions passed to Durham County Council, which became a unitary authority.
Eric Thomas Chester is an American author, socialist political activist, and former economics professor.
Cheshire County Council was the county council of Cheshire. Founded on 1 April 1889, it was officially dissolved on 31 March 2009, when it and its districts were superseded by two unitary authorities; Cheshire West and Chester and Cheshire East.
The Municipality of the District of Chester is a Nova Scotia district municipality occupying the northeastern half of Lunenburg County, Canada.
Cheshire West and Chester is a unitary authority area with borough status in Cheshire, England. It was established on 1 April 2009 as part of the 2009 local government changes, by virtue of an order under the Local Government and Public Involvement in Health Act 2007. It superseded the boroughs of Ellesmere Port and Neston, Vale Royal and the City of Chester; its council assumed the functions and responsibilities of the former Cheshire County Council within its area. The remainder of ceremonial Cheshire is composed of Cheshire East, Halton and Warrington. Cheshire West and Chester has three key urban areas: Chester, Ellesmere Port and Northwich/Winsford.
John A. Linder is an American politician who served as a Democratic member of the Chester City Council from 2010 to 2012 and Mayor of Chester, Pennsylvania from 2012 to 2016.
Cheshire West and Chester Council elections are held every four years. Cheshire West and Chester Council is the local authority for the unitary authority of Cheshire West and Chester in Cheshire, England. Since the last boundary changes in 2019, 70 councillors have been elected from 45 wards.
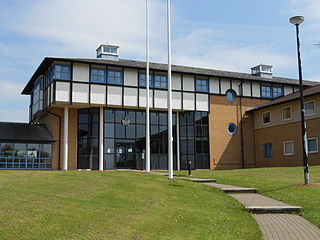
Cheshire West and Chester Council is the local authority for Cheshire West and Chester. It is a unitary authority created on 1 April 2009, succeeding the non-metropolitan districts of Chester City Council, Ellesmere Port and Neston Borough Council, and Vale Royal Borough Council, and the non-metropolitan county of Cheshire County Council. The council was first elected on 1 May 2008, a year before coming into its legal powers on 1 April 2009.
The 2015 Cheshire West and Chester Council election took place on 7 May 2015, electing members of Cheshire West and Chester Council in England. This was on the same day as other local elections across the country as well as the general election.
The 2019 Cheshire West and Chester Council election took place on 2 May 2019 to elect members of Cheshire West and Chester Council in England. This was on the same day as other local elections. Five fewer seats were contested because of boundary changes. No party gained overall control. The Labour Party gained a seat but lost control of the council; the Conservatives lost 8 seats, while the Independents gained 4, the Liberal Democrats gained 2, and the Green Party gained one.
County Durham is a local government district in the ceremonial county of County Durham, England. It is governed by Durham County Council, a unitary authority. The district has an area of 2,232.6 km2, and contains 135 civil parishes. It forms part of the larger ceremonial county of Durham, together with boroughs of Darlington, Hartlepool, and the part of Stockton-on-Tees north of the River Tees.
Samantha Kate Dixon is a British politician serving as Member of Parliament (MP) for the City of Chester since 2022. A member of the Labour Party, she was Leader of Cheshire West and Chester Council from 2015 to 2019.