| |||||||||||||||||||||||||||||||||||||||||||||||||||||||||||||
All 55 seats to West Dorset District Council 28 seats needed for a majority | |||||||||||||||||||||||||||||||||||||||||||||||||||||||||||||
---|---|---|---|---|---|---|---|---|---|---|---|---|---|---|---|---|---|---|---|---|---|---|---|---|---|---|---|---|---|---|---|---|---|---|---|---|---|---|---|---|---|---|---|---|---|---|---|---|---|---|---|---|---|---|---|---|---|---|---|---|---|
| |||||||||||||||||||||||||||||||||||||||||||||||||||||||||||||
|
The 1995 West Dorset District Council election was held on Thursday 4 May 1995 to elect councillors to West Dorset District Council in England. It took place on the same day as other district council elections in the United Kingdom. The entire council was up for election.
The 1995 election saw the council remain in no overall control, with Independent councillors and the Conservatives each electing 18 councillors.
Party | Candidate | Votes | % | ±% | |
---|---|---|---|---|---|
Independent | D. Barrett | 963 | – | N/A | |
Liberal Democrats | F. Streets | 785 | 33.6 | –8.0 | |
Conservative | V. Ivory | 587 | 25.1 | –0.3 | |
Liberal Democrats | M. Walcot | 514 | – | ||
Independent | M. Puzey | 514 | – | N/A | |
Turnout | 57.0 | +0.7 | |||
Registered electors | 3,130 | ||||
Independent hold | Swing | ||||
Liberal Democrats hold | Swing | ||||
Party | Candidate | Votes | % | ±% | |
---|---|---|---|---|---|
Conservative | G. Pritchard | 496 | 60.3 | –13.5 | |
Labour | M. Farmer | 327 | 39.7 | +13.5 | |
Majority | 169 | 20.5 | –27.1 | ||
Turnout | 51.6 | –4.7 | |||
Registered electors | 1,595 | ||||
Conservative hold | Swing | ||||
Party | Candidate | Votes | % | ±% | |
---|---|---|---|---|---|
Independent | E. Garrett * | unopposed | N/A | N/A | |
Registered electors | 1,491 | ||||
Independent hold |
Party | Candidate | Votes | % | ±% | |
---|---|---|---|---|---|
Independent | R. Coatsworth * | 450 | 68.9 | N/A | |
Labour | M. Shiels | 203 | 31.1 | +0.9 | |
Majority | 247 | 37.8 | N/A | ||
Turnout | 37.0 | –3.5 | |||
Registered electors | 1,767 | ||||
Independent gain from Ind. Conservative | Swing | ||||
Party | Candidate | Votes | % | ±% | |
---|---|---|---|---|---|
Labour | L. Dibdin * | 922 | 40.6 | –0.1 | |
Liberal Democrats | R. Draper | 721 | 31.7 | –2.2 | |
Conservative | B. Rowe | 628 | 27.7 | +2.3 | |
Liberal Democrats | F. McKenzie | 570 | – | ||
Turnout | 42.7 | –11.5 | |||
Registered electors | 3,475 | ||||
Labour hold | Swing | ||||
Liberal Democrats hold | Swing | ||||
Conservative gain from Labour | Swing | ||||
Party | Candidate | Votes | % | ±% | |
---|---|---|---|---|---|
Labour | C. Murless * | 660 | 37.2 | +5.7 | |
Independent | C. Samways * | 477 | 26.9 | –1.0 | |
Conservative | S. Brown | 397 | 22.4 | +0.1 | |
Liberal Democrats | B. Wheeler | 242 | 13.6 | –4.7 | |
Turnout | 53.5 | +1.8 | |||
Registered electors | 2,629 | ||||
Labour hold | Swing | ||||
Independent hold | Swing | ||||
Party | Candidate | Votes | % | ±% | |
---|---|---|---|---|---|
Independent | A. Thacker * | unopposed | N/A | N/A | |
Registered electors | 1,483 | ||||
Independent hold |
Party | Candidate | Votes | % | ±% | |
---|---|---|---|---|---|
Liberal Democrats | J. Hardman * | unopposed | N/A | N/A | |
Registered electors | 1,166 | ||||
Liberal Democrats hold |
Party | Candidate | Votes | % | ±% | |
---|---|---|---|---|---|
Conservative | M. Pritchard * | unopposed | N/A | N/A | |
Registered electors | 1,311 | ||||
Conservative hold |
Party | Candidate | Votes | % | ±% | |
---|---|---|---|---|---|
Independent | N. White * | 260 | 62.1 | –9.7 | |
Liberal Democrats | E. Compton | 236 | 47.6 | N/A | |
Majority | 24 | 4.8 | –19.3 | ||
Turnout | 48.9 | –6.4 | |||
Registered electors | 1,092 | ||||
Independent hold |
Party | Candidate | Votes | % | ±% | |
---|---|---|---|---|---|
Independent | R. Stenhouse * | unopposed | N/A | N/A | |
Registered electors | 1,186 | ||||
Independent hold |
Party | Candidate | Votes | % | ±% | |
---|---|---|---|---|---|
Conservative | J. Kennedy * | unopposed | N/A | N/A | |
Registered electors | 1,249 | ||||
Conservative hold |
Party | Candidate | Votes | % | ±% | |
---|---|---|---|---|---|
Independent | J. Cockerill * | unopposed | N/A | N/A | |
Registered electors | 1,348 | ||||
Independent hold |
Party | Candidate | Votes | % | ±% | |
---|---|---|---|---|---|
Independent | M. Pengelly * | unopposed | N/A | N/A | |
Registered electors | 1,383 | ||||
Independent hold |
Party | Candidate | Votes | % | ±% | |
---|---|---|---|---|---|
Conservative | P. Brown * | unopposed | N/A | N/A | |
Independent | I. Gardner * | unopposed | N/A | N/A | |
Registered electors | 3,906 | ||||
Conservative hold | |||||
Independent gain from Conservative |
Party | Candidate | Votes | % | ±% | |
---|---|---|---|---|---|
Liberal Democrats | Enid Stella Jones * | 769 | 75.5 | +11.9 | |
Liberal Democrats | T. Harries * | 626 | – | ||
Conservative | G. Duke | 249 | 24.5 | +1.6 | |
Turnout | 35.7 | –14.0 | |||
Registered electors | 2,936 | ||||
Liberal Democrats hold | Swing | ||||
Party | Candidate | Votes | % | ±% | |
---|---|---|---|---|---|
Independent | L. Phillips * | 446 | – | ||
Liberal Democrats | R. Biggs | 372 | 28.2 | N/A | |
Independent | L. Lock * | 323 | – | N/A | |
Labour | J. Dyer | 278 | 21.1 | N/A | |
Labour | S. Pering | 258 | – | ||
Green | B. Smith | 223 | 16.9 | –9.7 | |
Turnout | 47.0 | –3.1 | |||
Registered electors | 2,214 | ||||
Independent hold | Swing | ||||
Liberal Democrats gain from Conservative | Swing | ||||
Party | Candidate | Votes | % | ±% | |
---|---|---|---|---|---|
Liberal Democrats | H. Dowell * | 1,054 | 42.5 | +0.6 | |
Liberal Democrats | M. Rennie * | 1,008 | – | ||
Liberal Democrats | D. Maggs * | 893 | – | ||
Independent | K. Lambert | 867 | 34.9 | N/A | |
Conservative | R. Hill | 560 | 22.6 | –11.1 | |
Turnout | 45.0 | –8.8 | |||
Registered electors | 4,029 | ||||
Liberal Democrats hold | Swing | ||||
Party | Candidate | Votes | % | ±% | |
---|---|---|---|---|---|
Labour | J. Antell * | 1,059 | 51.3 | +3.2 | |
Labour | W. Gundry * | 789 | – | ||
Liberal Democrats | David Trevor Jones * | 653 | 31.6 | –0.4 | |
Labour | P. Hayward | 631 | – | ||
Liberal Democrats | P. Sennett | 430 | – | ||
Conservative | D. Fry | 354 | 17.1 | –2.8 | |
Turnout | 46.3 | – | |||
Registered electors | 3,227 | ||||
Labour hold | Swing | ||||
Liberal Democrats hold | Swing | ||||
Party | Candidate | Votes | % | ±% | |
---|---|---|---|---|---|
Independent | M. Penfold * | unopposed | N/A | N/A | |
Registered electors | 1,229 | ||||
Independent hold |
Party | Candidate | Votes | % | ±% | |
---|---|---|---|---|---|
Independent | T. Frost * | unopposed | N/A | N/A | |
Registered electors | 1,401 | ||||
Independent hold |
Party | Candidate | Votes | % | ±% | |
---|---|---|---|---|---|
Liberal Democrats | S. Friar | 521 | 69.2 | N/A | |
Conservative | G. House * | 232 | 30.8 | N/A | |
Majority | 289 | 38.4 | N/A | ||
Turnout | 58.0 | N/A | |||
Registered electors | 1,303 | ||||
Liberal Democrats gain from Independent |
Party | Candidate | Votes | % | ±% | |
---|---|---|---|---|---|
Conservative | E. Bryan | unopposed | N/A | N/A | |
Registered electors | 1,154 | ||||
Conservative hold |
Party | Candidate | Votes | % | ±% | |
---|---|---|---|---|---|
Independent | O. Lovell * | 792 | – | N/A | |
Independent | E. Street | 707 | – | N/A | |
Conservative | S. Poupard * | 543 | 37.5 | N/A | |
Independent | V. White | 443 | – | N/A | |
Independent | K. Whetlor | 310 | – | N/A | |
Liberal Democrats | A. Saull-Hunt | 112 | 7.7 | N/A | |
Turnout | 39.0 | N/A | |||
Registered electors | 3,067 | ||||
Independent hold | |||||
Independent gain from Independent | |||||
Conservative hold |
Party | Candidate | Votes | % | ±% | |
---|---|---|---|---|---|
Independent | E. Harris | 450 | 72.8 | N/A | |
Conservative | R. Bowditch | 168 | 27.2 | N/A | |
Majority | 282 | 45.6 | N/A | ||
Turnout | 51.0 | N/A | |||
Registered electors | 1,228 | ||||
Independent gain from Independent |
Party | Candidate | Votes | % | ±% | |
---|---|---|---|---|---|
Conservative | G. Haynes * | 286 | 50.7 | –17.1 | |
Independent | R. Pawley | 278 | 49.3 | N/A | |
Majority | 8 | 1.4 | –34.3 | ||
Turnout | 42.0 | –6.7 | |||
Registered electors | 1,329 | ||||
Conservative hold | Swing | ||||
Party | Candidate | Votes | % | ±% | |
---|---|---|---|---|---|
SDP | J. Shuttleworth * | unopposed | N/A | N/A | |
Conservative | P. Grove-White | unopposed | N/A | N/A | |
Registered electors | 2,523 | ||||
SDP hold | |||||
Conservative gain from Liberal Democrats |
Party | Candidate | Votes | % | ±% | |
---|---|---|---|---|---|
Conservative | J. Boughey | unopposed | N/A | N/A | |
Registered electors | 1,422 | ||||
Conservative gain from Independent |
Party | Candidate | Votes | % | ±% | |
---|---|---|---|---|---|
Conservative | G. Harries * | unopposed | N/A | N/A | |
Registered electors | 1,219 | ||||
Conservative hold |
Party | Candidate | Votes | % | ±% | |
---|---|---|---|---|---|
Independent | I. Martin | unopposed | N/A | N/A | |
Registered electors | 1,179 | ||||
Independent gain from Independent |
Party | Candidate | Votes | % | ±% | |
---|---|---|---|---|---|
Conservative | T. Farmer | 496 | 39.3 | –15.0 | |
Labour | R. Bygrave * | 422 | 33.4 | N/A | |
Conservative | J. Williams | 372 | – | ||
Liberal Democrats | M. Rehahn | 344 | 27.3 | N/A | |
Labour | L. Ashby | 339 | – | ||
Turnout | 45.7 | –12.8 | |||
Registered electors | 2,590 | ||||
Conservative hold | Swing | ||||
Labour gain from Independent | Swing | ||||
Party | Candidate | Votes | % | ±% | |
---|---|---|---|---|---|
Conservative | D. Mildenhall * | 863 | 40.3 | +3.0 | |
Conservative | P. Shorland * | 788 | – | ||
Liberal Democrats | M. Doyle | 693 | 32.4 | –4.1 | |
Conservative | H. Warburton | 657 | – | ||
Labour | P. O'Dwyer | 586 | 27.4 | N/A | |
Liberal Democrats | R. Bonelle | 559 | – | ||
Liberal Democrats | T. Rogers | 497 | – | ||
Turnout | 46.6 | –13.9 | |||
Registered electors | 3,911 | ||||
Conservative hold | Swing | ||||
Liberal Democrats hold | Swing | ||||
Party | Candidate | Votes | % | ±% | |
---|---|---|---|---|---|
Conservative | G. Summers * | 228 | 50.8 | –4.6 | |
Labour | B. Begley | 221 | 49.2 | +4.6 | |
Majority | 7 | 1.6 | –9.3 | ||
Turnout | 32.5 | –9.0 | |||
Registered electors | 1,383 | ||||
Conservative hold | Swing | ||||
Party | Candidate | Votes | % | ±% | |
---|---|---|---|---|---|
Conservative | J. Terrett * | 290 | 59.1 | N/A | |
Labour | J. Everington | 201 | 40.9 | N/A | |
Majority | 89 | 18.1 | N/A | ||
Turnout | 48.0 | N/A | |||
Registered electors | 1,025 | ||||
Conservative hold |
Party | Candidate | Votes | % | ±% | |
---|---|---|---|---|---|
Conservative | T. Hutchinson * | 248 | 63.8 | –4.7 | |
Labour | R. Pickering | 141 | 36.2 | +4.7 | |
Majority | 107 | 27.5 | –9.5 | ||
Turnout | 49.0 | –5.2 | |||
Registered electors | 796 | ||||
Conservative hold | Swing | ||||
Party | Candidate | Votes | % | ±% | |
---|---|---|---|---|---|
Conservative | D. Bushrod * | 331 | 57.0 | +18.4 | |
Liberal Democrats | A. Hemingway | 250 | 43.0 | N/A | |
Majority | 81 | 13.9 | +7.6 | ||
Turnout | 52.0 | –8.0 | |||
Registered electors | 1,171 | ||||
Conservative hold | Swing | ||||
Party | Candidate | Votes | % | ±% | |
---|---|---|---|---|---|
Independent | S. Slade * | unopposed | N/A | N/A | |
Registered electors | 1,989 | ||||
Independent hold |
Party | Candidate | Votes | % | ±% | |
---|---|---|---|---|---|
Liberal Democrats | S. King | 391 | 57.4 | N/A | |
Conservative | R. Wilson | 290 | 42.6 | N/A | |
Majority | 101 | 14.8 | N/A | ||
Turnout | 49.7 | N/A | |||
Registered electors | 1,370 | ||||
Liberal Democrats gain from Conservative |
Party | Candidate | Votes | % | ±% | |
---|---|---|---|---|---|
Conservative | 225 | 44.6 | –14.5 | ||
Liberal Democrats | 199 | 39.5 | N/A | ||
Labour | 80 | 15.8 | –25.1 | ||
Majority | 26 | 5.2 | –12.9 | ||
Turnout | 46.84 | –1.16 | |||
Registered electors | |||||
Conservative hold | Swing | ||||
Party | Candidate | Votes | % | ±% | |
---|---|---|---|---|---|
Labour | 354 | 35.1 | –2.1 | ||
Conservative | 328 | 32.5 | +10.1 | ||
Liberal Democrats | 326 | 32.2 | +18.7 | ||
Liberal Democrats | 293 | – | |||
Conservative | 270 | – | |||
Turnout | |||||
Registered electors | |||||
Labour hold | Swing | ||||
Conservative gain from Independent | Swing | ||||
Party | Candidate | Votes | % | ±% | |
---|---|---|---|---|---|
Conservative | 576 | 51.3 | +8.7 | ||
Liberal Democrats | 546 | 48.7 | –8.7 | ||
Majority | 30 | 2.7 | N/A | ||
Turnout | |||||
Registered electors | |||||
Conservative gain from Liberal Democrats | Swing | ||||
Party | Candidate | Votes | % | ±% | |
---|---|---|---|---|---|
Liberal Democrats | 701 | 64.3 | N/A | ||
Conservative | 201 | 18.4 | N/A | ||
Independent | 187 | 16.9 | N/A | ||
Majority | 500 | 45.9 | N/A | ||
Turnout | 27.7 | N/A | |||
Registered electors | |||||
Liberal Democrats gain from Conservative | Swing | ||||
Sturminster Newton is a town and civil parish in the Blackmore Vale area of Dorset, England. It is situated on a low limestone ridge in a meander of the River Stour. The town is at the centre of a large dairy agriculture region, around which the town's economy is built. The larger part of the town (Sturminster) lies on the north side of the river, and includes most shops and services, whilst to the south is the smaller Newton. Between these two areas is a wide flood plain. The town was the home of poet and author William Barnes, and, for part of his life, Thomas Hardy. The town has 43 shops, a primary and secondary school, and a school and college catering for children with Special educational needs. In the 2011 census the town's civil parish had a population of 5,234.
Lancaster City Council elections are held every four years. Lancaster City Council is the local authority for the non-metropolitan district of Lancaster in Lancashire, England. Since the last boundary changes in 2015, 60 councillors have been elected from 27 wards.
The Cairns Region is a local government area in Far North Queensland, Queensland, Australia, centred on the regional city of Cairns. It was established in 2008 by the amalgamation of the City of Cairns and the Shires of Douglas and Mulgrave. However, following public protest and a referendum in 2013, on 1 January 2014, the Shire of Douglas was de-amalgamated from the Cairns Region and re-established as a separate local government authority.
The 2011 West Dorset District Council election was held on Thursday 5 May 2011 to elect councillors to West Dorset District Council in England. It took place on the same day as other district council elections in the United Kingdom. The whole of this 48-seat council was up for election.
The 2014 United Kingdom local elections were held on 22 May 2014. Usually these elections are held on the first Thursday in May but were postponed to coincide with the 2014 European Parliament Elections. Direct elections were held for all 32 London boroughs, all 36 metropolitan boroughs, 74 district/borough councils, 19 unitary authorities and various mayoral posts in England and elections to the new councils in Northern Ireland.
The 2011 East Dorset District Council election took place on 5 May 2011 to elect members of East Dorset District Council in Dorset, England. The whole council was up for election and the Conservative Party stayed in overall control of the council.
The 2015 West Dorset District Council election was held on Thursday 7 May 2015 to elect councillors to West Dorset District Council in England. It took place on the same day as the general election other district council elections in the United Kingdom. A series of boundary changes saw the number of councillors reduced from 48 to 44.
The 2015 East Dorset District Council election took place on 7 May 2015 in order to elect members of the East Dorset District Council in Dorset, England. The whole council was up for election after boundary changes reduced the number of seats by seven. The Conservative Party stayed in overall control of the council.
Bournemouth, Christchurch and Poole (BCP) is a unitary authority area in the ceremonial county of Dorset, England. It was created on 1 April 2019 by the merger of the areas that were previously administered by the unitary authorities of Bournemouth and Poole, and the non-metropolitan district of Christchurch. The authority covers much of the area of the South Dorset conurbation.
Dorset Council is a unitary local authority in England covering most of the ceremonial county of Dorset. It was created on 1 April 2019 to administer most of the area formerly administered by Dorset County Council, which was previously subdivided into the districts of Weymouth and Portland, West Dorset, North Dorset, Purbeck, and East Dorset, as well as Christchurch, which is now part of Bournemouth, Christchurch and Poole.
Structural changes to local government in England took place between 2019 and 2023. Some of these changes continue the trend of new unitary authorities being created from other types of local government districts, which was a policy of Communities Secretary Robert Jenrick from 2019.
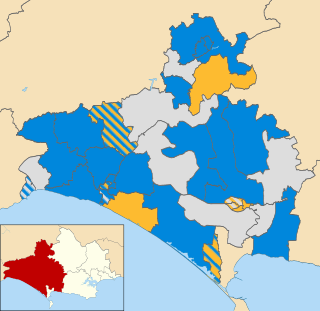
The 2019 Dorset Council election was held on Thursday 2 May 2019 to elect councillors to the new Dorset Council in England. It took place on the same day as other district council elections in the United Kingdom.
The 1995 Bath and North East Somerset Council election was held on Thursday 4 May 1995 to elect councillors to the new Bath and North East Somerset Council in England. It took place on the same day as other district council elections in the United Kingdom.
The 1973 West Dorset District Council election was held on Thursday 10 May 1973 to elect councillors to the new West Dorset District Council in England. It took place on the same day as other district council elections in the United Kingdom.
The 1976 West Dorset District Council election was held on Thursday 6 May 1976 to elect councillors to West Dorset District Council in England. It took place on the same day as other district council elections in the United Kingdom. This was the second election to the district council.
The 1979 West Dorset District Council election was held on Thursday 3 May 1979 to elect councillors to West Dorset District Council in England. It took place on the same day as the general election and other district council elections in the United Kingdom. This was the third election to the district council, the election saw terms of councillors extended from three to four years.
The 1983 West Dorset District Council election was held on Thursday 5 May 1983 to elect councillors to West Dorset District Council in England. It took place on the same day as other district council elections in the United Kingdom. The entire council was up for election, following boundary changes that reduced the number of wards by two, but altogether the number of seats remained the same. Subsequent elections for the council would be elected by thirds following the passing a resolution under section 7 (4) (b) of the Local Government Act 1972.
The 1986 West Dorset District Council election was held on Thursday 8 May 1986 to elect councillors to West Dorset District Council in England. It took place on the same day as other district council elections in the United Kingdom. One third of seats were up for election.
The 1987 West Dorset District Council election was held on Thursday 7 May 1987 to elect councillors to West Dorset District Council in England. It took place on the same day as other district council elections in the United Kingdom. The entire council was up for election as West Dorset returned to whole councils elections, after previously having been elected in thirds.
The 2003 West Dorset District Council election was held on Thursday 1 May 2003 to elect councillors to West Dorset District Council in England. It took place on the same day as other district council elections in the United Kingdom. The entire council was up for election. Following boundary changes the number of wards were reduced by five, and the number of seats reduced from 55 to 48.