| |||||||||||||||||||||||||||||||||
All 48 seats to West Dorset District Council 25 seats needed for a majority | |||||||||||||||||||||||||||||||||
---|---|---|---|---|---|---|---|---|---|---|---|---|---|---|---|---|---|---|---|---|---|---|---|---|---|---|---|---|---|---|---|---|---|
| |||||||||||||||||||||||||||||||||
![]() Map showing the results of the 2003 West Dorset District Council elections. | |||||||||||||||||||||||||||||||||
|
The 2003 West Dorset District Council election was held on Thursday 1 May 2003 to elect councillors to West Dorset District Council in England. It took place on the same day as other district council elections in the United Kingdom. The entire council was up for election. Following boundary changes the number of wards were reduced by five, and the number of seats reduced from 55 to 48. [1]
The 2003 election saw the Conservatives take majority control of the District Council. [2]
Party | Candidate | Votes | % | ±% | |
---|---|---|---|---|---|
Liberal Democrats | Caroline Lucy Payne | unopposed | N/A | N/A | |
Conservative | V. Ivory * | unopposed | N/A | N/A | |
Registered electors | 3,213 | ||||
Liberal Democrats hold | |||||
Conservative hold |
Party | Candidate | Votes | % | ±% | |
---|---|---|---|---|---|
Independent | E. Garrett * | 390 | 66.1 | +7.8 | |
Liberal Democrats | S. Longdon | 200 | 33.9 | +14.6 | |
Majority | 190 | 32.2 | –3.7 | ||
Turnout | 38.6 | –9.1 | |||
Registered electors | 1,541 | ||||
Independent hold | Swing | ||||
Party | Candidate | Votes | % | ±% | |
---|---|---|---|---|---|
Conservative | Ronald William Coatsworth * | 406 | 78.5 | N/A | |
Liberal Democrats | G. Fifield | 111 | 21.5 | N/A | |
Majority | 295 | 57.1 | N/A | ||
Turnout | 31.0 | N/A | |||
Registered electors | 1,673 | ||||
Conservative gain from Independent |
Party | Candidate | Votes | % | ±% | |
---|---|---|---|---|---|
Conservative | R. Stoodley | 445 | 31.5 | N/A | |
Liberal Democrats | Christopher Martin Ray | 393 | 27.8 | N/A | |
Conservative | Keith Allan Day | 333 | – | ||
Labour | R. Nicholls | 325 | 23.0 | N/A | |
Liberal Democrats | K. Wallace | 305 | – | ||
Independent | J. Shaw | 250 | 17.7 | N/A | |
Turnout | 33.6 | N/A | |||
Registered electors | 3,389 | ||||
Conservative win (new seat) | |||||
Liberal Democrats win (new seat) |
Party | Candidate | Votes | % | ±% | |
---|---|---|---|---|---|
Conservative | S. Brown * | 842 | 29.8 | N/A | |
Independent | D. Tett | 715 | 25.3 | N/A | |
Conservative | G. Pritchard * | 599 | – | ||
Labour | C. Wild * | 556 | 19.7 | N/A | |
Conservative | H. Samuel | 347 | – | ||
Liberal Democrats | A. Harrison | 339 | 12.0 | N/A | |
Liberal Democrats | S. Bagnall | 325 | – | ||
Green | L. Sea | 272 | 9.6 | N/A | |
Dorset Stop The War | D. Partridge | 102 | 3.6 | N/A | |
Turnout | 37.7 | N/A | |||
Registered electors | 4,409 | ||||
Conservative win (new seat) | |||||
Independent win (new seat) | |||||
Conservative win (new seat) |
Party | Candidate | Votes | % | ±% | |
---|---|---|---|---|---|
Independent | A. Thacker * | unopposed | N/A | N/A | |
Registered electors | 1,559 | ||||
Independent hold |
Party | Candidate | Votes | % | ±% | |
---|---|---|---|---|---|
Conservative | L. Sewell * | 384 | 58.4 | –5.5 | |
Liberal Democrats | D. Prysor-Jones | 273 | 41.6 | +5.5 | |
Majority | 111 | 16.9 | –10.9 | ||
Turnout | 45.6 | +1.6 | |||
Registered electors | 1,447 | ||||
Conservative hold | Swing | ||||
Party | Candidate | Votes | % | ±% | |
---|---|---|---|---|---|
Liberal Democrats | M. Parsons | 637 | 67.2 | +26.2 | |
Conservative | M. Pritchard * | 311 | 32.8 | –26.2 | |
Majority | 326 | 34.4 | N/A | ||
Turnout | 59.1 | +2.9 | |||
Registered electors | 1,608 | ||||
Liberal Democrats gain from Conservative | Swing | ||||
Party | Candidate | Votes | % | ±% | |
---|---|---|---|---|---|
Liberal Democrats | S. Friar * | 456 | 59.1 | N/A | |
Conservative | P. Sargent * | 315 | 40.9 | N/A | |
Majority | 141 | 18.3 | N/A | ||
Turnout | 46.7 | N/A | |||
Registered electors | 1,652 | ||||
Liberal Democrats win (new seat) |
Party | Candidate | Votes | % | ±% | |
---|---|---|---|---|---|
Conservative | S. East * | 1,012 | 74.2 | N/A | |
Conservative | A. Horsington | 984 | – | ||
Independent | L. Clarke | 352 | 25.8 | N/A | |
Turnout | 41.0 | N/A | |||
Registered electors | 3,334 | ||||
Conservative win (new seat) | |||||
Conservative win (new seat) |
Party | Candidate | Votes | % | ±% | |
---|---|---|---|---|---|
Independent | D. Newson * | unopposed | N/A | N/A | |
Registered electors | 1,475 | ||||
Independent hold |
Party | Candidate | Votes | % | ±% | |
---|---|---|---|---|---|
Conservative | T. Bartlett | 494 | 61.1 | N/A | |
Liberal Democrats | I. Lewis | 315 | 38.9 | N/A | |
Majority | 179 | 22.1 | N/A | ||
Turnout | 45.6 | +0.8 | |||
Registered electors | 1,788 | ||||
Conservative gain from Independent | Swing | ||||
Party | Candidate | Votes | % | ±% | |
---|---|---|---|---|---|
Liberal Democrats | I. Gardner * | 578 | 42.2 | N/A | |
Liberal Democrats | M. Rogers | 557 | – | ||
Conservative | M. Jolliffe | 533 | 38.9 | N/A | |
Liberal Democrats | R. Denton-White | 461 | – | ||
Conservative | M. Dunseith | 452 | – | ||
Conservative | J. Wilson | 392 | – | ||
Independent | D. Smithson | 259 | 18.9 | N/A | |
Turnout | 28.6 | N/A | |||
Registered electors | 4,332 | ||||
Liberal Democrats win (new seat) | |||||
Conservative win (new seat) |
Party | Candidate | Votes | % | ±% | |
---|---|---|---|---|---|
Conservative | G. Summers * | 386 | 67.5 | N/A | |
Liberal Democrats | P. Morgan-Smith | 186 | 32.5 | N/A | |
Majority | 200 | 35.0 | N/A | ||
Turnout | 39.0 | N/A | |||
Registered electors | 1,468 | ||||
Conservative win (new seat) |
Party | Candidate | Votes | % | ±% | |
---|---|---|---|---|---|
Liberal Democrats | Enid Stella Jones * | 734 | 59.1 | +6.8 | |
Liberal Democrats | T. Harries * | 620 | – | ||
Conservative | R. Thorogood | 508 | 40.9 | +15.7 | |
Conservative | B. Parkhurst | 503 | – | ||
Turnout | 36.0 | +4.1 | |||
Registered electors | 3,548 | ||||
Liberal Democrats hold | Swing | ||||
Party | Candidate | Votes | % | ±% | |
---|---|---|---|---|---|
Liberal Democrats | Andrew James Canning | 550 | 38.8 | +4.7 | |
Independent | A. Beard | 481 | 33.9 | N/A | |
Liberal Democrats | R. Tarr | 459 | – | ||
Conservative | A. Parry | 386 | 27.2 | +7.7 | |
Conservative | J. Bell | 362 | – | ||
Turnout | 42.0 | +2.2 | |||
Registered electors | 2,938 | ||||
Liberal Democrats hold | Swing | ||||
Independent gain from Independent | Swing | ||||
Party | Candidate | Votes | % | ±% | |
---|---|---|---|---|---|
Liberal Democrats | M. Rennie * | 760 | 57.1 | N/A | |
Liberal Democrats | R. Potter | 639 | – | ||
Conservative | R. Martindale | 572 | 42.9 | N/A | |
Conservative | J. Halewood | 567 | – | ||
Turnout | 40.0 | N/A | |||
Registered electors | 3,312 | ||||
Liberal Democrats win (new seat) | |||||
Liberal Democrats win (new seat) |
Party | Candidate | Votes | % | ±% | |
---|---|---|---|---|---|
Independent | D. Barrett * | 757 | 40.5 | N/A | |
Liberal Democrats | David Trevor Jones * | 705 | 37.7 | N/A | |
Liberal Democrats | T. Parsley | 616 | – | ||
Conservative | I. Birt | 406 | 21.7 | N/A | |
Turnout | 42.0 | N/A | |||
Registered electors | 3,381 | ||||
Independent win (new seat) | |||||
Liberal Democrats win (new seat) |
Party | Candidate | Votes | % | ±% | |
---|---|---|---|---|---|
Independent | M. Penfold * | unopposed | N/A | N/A | |
Registered electors | 1,656 | ||||
Independent hold |
Party | Candidate | Votes | % | ±% | |
---|---|---|---|---|---|
Independent | T. Frost * | 462 | 63.3 | –1.5 | |
Liberal Democrats | B. Dearlove | 268 | 36.7 | +1.5 | |
Majority | 194 | 26.6 | –2.9 | ||
Turnout | 49.0 | +3.1 | |||
Registered electors | 1,504 | ||||
Independent hold | Swing | ||||
Party | Candidate | Votes | % | ±% | |
---|---|---|---|---|---|
Conservative | M. Roberts | 298 | 50.1 | N/A | |
Independent | A. Brown | 172 | 28.9 | N/A | |
Liberal Democrats | V. Barnes | 125 | 21.0 | N/A | |
Majority | 126 | 21.2 | N/A | ||
Turnout | 41.5 | N/A | |||
Registered electors | 1,437 | ||||
Conservative hold |
Party | Candidate | Votes | % | ±% | |
---|---|---|---|---|---|
Independent | O. Lovell * | 510 | – | N/A | |
Conservative | K. Meech * | 452 | 47.0 | N/A | |
Independent | P. Hicks | 438 | – | N/A | |
Independent | S. Williams | 397 | – | N/A | |
Turnout | 33.3 | N/A | |||
Registered electors | 3,131 | ||||
Independent win (new seat) | |||||
Conservative win (new seat) |
Party | Candidate | Votes | % | ±% | |
---|---|---|---|---|---|
Independent | N. Patmore | 357 | 51.6 | N/A | |
Conservative | P. Gregson | 335 | 48.4 | +20.8 | |
Majority | 22 | 3.2 | N/A | ||
Turnout | 44.9 | –0.6 | |||
Registered electors | 1,549 | ||||
Independent gain from Independent | Swing | ||||
Party | Candidate | Votes | % | ±% | |
---|---|---|---|---|---|
Conservative | I. Gillespie * | 407 | 50.8 | N/A | |
Liberal Democrats | H. Thomas * | 394 | 49.2 | N/A | |
Majority | 13 | 1.6 | N/A | ||
Turnout | 55.8 | N/A | |||
Registered electors | 1,440 | ||||
Conservative win (new seat) |
Party | Candidate | Votes | % | ±% | |
---|---|---|---|---|---|
Conservative | A. Alford | 399 | 62.1 | +10.1 | |
Liberal Democrats | R. Pawley | 244 | 37.9 | –10.1 | |
Majority | 155 | 24.1 | +20.0 | ||
Turnout | 43.0 | – | |||
Registered electors | 1,512 | ||||
Conservative hold | Swing | ||||
Party | Candidate | Votes | % | ±% | |
---|---|---|---|---|---|
Conservative | T. Seall * | 662 | 52.5 | +6.2 | |
Conservative | D. Smy * | 626 | – | ||
Independent | R. Russell | 600 | 47.5 | N/A | |
Turnout | 42.5 | +2.6 | |||
Registered electors | 2,774 | ||||
Conservative hold | Swing | ||||
Party | Candidate | Votes | % | ±% | |
---|---|---|---|---|---|
Conservative | S. Barker | unopposed | N/A | N/A | |
Registered electors | 1,618 | ||||
Conservative hold |
Party | Candidate | Votes | % | ±% | |
---|---|---|---|---|---|
Independent | T. Pearce | 290 | 36.4 | +0.7 | |
Conservative | G. Harries * | 277 | 34.8 | –4.7 | |
Independent | I. Mayo * | 229 | 28.8 | N/A | |
Majority | 13 | 1.6 | N/A | ||
Turnout | 45.7 | +3.0 | |||
Registered electors | 1,762 | ||||
Independent gain from Conservative | Swing | ||||
Party | Candidate | Votes | % | ±% | |
---|---|---|---|---|---|
Conservative | Robert Andrew Gould | unopposed | N/A | N/A | |
Registered electors | 1,602 | ||||
Conservative gain from Independent |
Party | Candidate | Votes | % | ±% | |
---|---|---|---|---|---|
Conservative | Terence Peter Farmer * | 628 | 43.7 | +9.1 | |
Conservative | M. Clark | 567 | – | ||
Green | Jenny Susan Greene | 467 | 32.5 | N/A | |
Labour | Robert James Bygrave | 343 | 23.9 | +3.8 | |
Turnout | 34.0 | –6.4 | |||
Registered electors | 3,308 | ||||
Conservative hold | Swing | ||||
Conservative gain from Independent | Swing | ||||
Party | Candidate | Votes | % | ±% | |
---|---|---|---|---|---|
Conservative | Peter Robert Shorland * | 731 | 56.4 | N/A | |
Conservative | Marjorie Snowden | 660 | – | ||
Liberal Democrats | Robin Andrew Shane Legg * | 564 | 43.6 | N/A | |
Turnout | 33.6 | N/A | |||
Registered electors | 3,509 | ||||
Conservative win (new seat) | |||||
Conservative win (new seat) |
Party | Candidate | Votes | % | ±% | |
---|---|---|---|---|---|
Independent | Stephen John Slade * | 448 | 46.5 | +18.7 | |
Liberal Democrats | D. Rickard | 239 | 34.8 | +5.7 | |
Majority | 209 | 30.4 | +13.0 | ||
Turnout | 41.6 | –1.6 | |||
Registered electors | 1,663 | ||||
Independent hold | Swing | ||||
Party | Candidate | Votes | % | ±% | |
---|---|---|---|---|---|
Conservative | G. House * | 386 | 69.8 | –0.7 | |
Liberal Democrats | S. Hewson | 167 | 30.2 | +0.7 | |
Majority | 219 | 39.6 | –1.4 | ||
Turnout | 41.3 | –1.7 | |||
Registered electors | 1,343 | ||||
Conservative hold | Swing | ||||
East Dorset was a local government district in Dorset, England. Its council met in Wimborne Minster between 2016 and 2019.
Test Valley Borough Council is elected every four years.
Chichester District Council in West Sussex, England is elected every four years. Since the last boundary changes in 2003, 48 councillors have been elected from 29 wards.
Christchurch Borough Council in Dorset, England, existed from 1974 to 2019, when it was abolished and subsumed into Bournemouth, Christchurch and Poole Council.
West Berkshire Council is the local authority for West Berkshire, a unitary authority in Berkshire, England. Until 1 April 1998 it was a non-metropolitan district.
Purbeck District Council in Dorset, England existed from 1973 to 2019. One-third of the council was elected each year, followed by one year where there was an election to Dorset County Council instead. The council was abolished and subsumed into Dorset Council in 2019.
North Dorset District Council in Dorset, England existed from 1974 to 2019, when it was abolished and subsumed into Dorset Council.
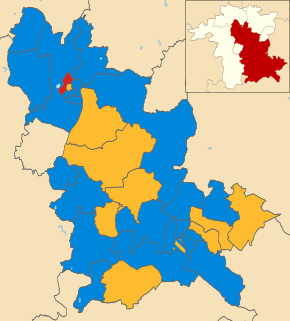
Kennet was a non-metropolitan district in Wiltshire, England. It was abolished on 1 April 2009 and replaced by Wiltshire Council.
East Dorset District Council in Dorset, England existed from 1973 to 2019, when it was abolished and subsumed into Dorset Council.
The 2003 East Dorset District Council election took place on 1 May 2003 to elect members of East Dorset District Council in Dorset, England. The whole council was up for election after boundary changes and the Conservative Party stayed in overall control of the council.
The 2003 Wychavon District Council election took place on 1 May 2003 to elect members of Wychavon District Council in Worcestershire, England. The whole council was up for election with boundary changes since the last election in 1999 reducing the number of seats by four. The Conservative Party stayed in overall control of the council.
The 2015 West Dorset District Council election was held on Thursday 7 May 2015 to elect councillors to West Dorset District Council in England. It took place on the same day as the general election other district council elections in the United Kingdom. A series of boundary changes saw the number of councillors reduced from 48 to 44.
The 2015 East Dorset District Council election took place on 7 May 2015 in order to elect members of the East Dorset District Council in Dorset, England. The whole council was up for election after boundary changes reduced the number of seats by seven. The Conservative Party stayed in overall control of the council.
The 2003 Christchurch Borough Council election took place on 1 May 2003 to elect members of Christchurch Borough Council in Dorset, England. The whole council was up for election after boundary changes reduced the number of seats by one. The Conservative Party stayed in overall control of the council.
Salisbury District Council was the local authority for the non-metropolitan district of Salisbury, created in 1974 in Wiltshire, England. It was abolished on 1 April 2009 and replaced by Wiltshire Council.
West Dorset District Council in Dorset, England existed from 1974 to 2019. The council was abolished and subsumed into Dorset Council in 2019.
Bournemouth, Christchurch and Poole (BCP) is a unitary authority area in the ceremonial county of Dorset, England. It was created on 1 April 2019 by the merger of the areas that were previously administered by the unitary authorities of Bournemouth and Poole, and the non-metropolitan district of Christchurch. The authority covers much of the area of the South Dorset conurbation.
Dorset Council is a unitary local authority in England covering most of the ceremonial county of Dorset. It was created on 1 April 2019 to administer most of the area formerly administered by Dorset County Council, which was previously subdivided into the districts of Weymouth and Portland, West Dorset, North Dorset, Purbeck, and East Dorset, as well as Christchurch, which is now part of Bournemouth, Christchurch and Poole.
The 1983 West Dorset District Council election was held on Thursday 5 May 1983 to elect councillors to West Dorset District Council in England. It took place on the same day as other district council elections in the United Kingdom. The entire council was up for election, following boundary changes that reduced the number of wards by two, but altogether the number of seats remained the same. Subsequent elections for the council would be elected by thirds following the passing a resolution under section 7 (4) (b) of the Local Government Act 1972.
The 1991 West Dorset District Council election was held on Thursday 2 May 1991 to elect councillors to West Dorset District Council in England. It took place on the same day as other district council elections in the United Kingdom. The entire council was up for election. District boundary changes took place before the election but the number of seats remained the same.