The 2003 Carlisle City Council election took place on 1 May 2003 to elect members of Carlisle District Council in Cumbria, England. One third of the council was up for election and the Conservative Party lost overall control of the council to no overall control. [1]
After the election, the composition of the council was:
Overall turnout at the election was 31.4%, slightly down from the 31.7% in 2002. [3]
Party | Seats | Gains | Losses | Net gain/loss | Seats % | Votes % | Votes | +/− | |
---|---|---|---|---|---|---|---|---|---|
Conservative | 9 | 0 | 3 | -3 | 47.4 | 41.1 | 9,317 | -1.8% | |
Labour | 8 | 4 | 0 | +4 | 42.1 | 44.1 | 10,016 | +0.2% | |
Liberal Democrats | 2 | 0 | 0 | 0 | 10.5 | 14.6 | 3,304 | +3.6% | |
Independent | 0 | 0 | 1 | -1 | 0 | 0.3 | 59 | -1.8% | |
Party | Candidate | Votes | % | ±% | |
---|---|---|---|---|---|
Conservative | Alan Toole | 948 | 59.3 | -1.0 | |
Labour | Mohammed Harid | 650 | 40.7 | +1.0 | |
Majority | 298 | 18.6 | -1.9 | ||
Turnout | 1,598 | 34.3 | |||
Conservative hold | Swing | ||||
Party | Candidate | Votes | % | ±% | |
---|---|---|---|---|---|
Labour | Mary Styth | 570 | 47.2 | -1.2 | |
Conservative | Neville Lishman | 425 | 35.2 | -2.7 | |
Liberal Democrats | James Tootle | 153 | 12.7 | +1.2 | |
Independent | Steven Cochrane | 59 | 4.9 | +4.9 | |
Majority | 145 | 12.0 | +1.6 | ||
Turnout | 1,207 | 29.2 | |||
Labour hold | Swing | ||||
Party | Candidate | Votes | % | ±% | |
---|---|---|---|---|---|
Labour | Charles Scarborough | 698 | 60.7 | -2.4 | |
Conservative | Gareth Ellis | 452 | 39.3 | +2.4 | |
Majority | 246 | 21.4 | -4.8 | ||
Turnout | 1,150 | 26.0 | |||
Labour gain from Conservative | Swing | ||||
Party | Candidate | Votes | % | ±% | |
---|---|---|---|---|---|
Conservative | John Collier | 391 | 72.5 | ||
Labour | Robin Pearson | 148 | 27.5 | ||
Majority | 243 | 45.1 | |||
Turnout | 539 | 34.0 | |||
Conservative hold | Swing | ||||
Party | Candidate | Votes | % | ±% | |
---|---|---|---|---|---|
Liberal Democrats | Thomas Hodgson | 603 | 57.6 | +8.5 | |
Labour | Raymond Warwick | 443 | 42.4 | +9.0 | |
Majority | 160 | 15.3 | -0.5 | ||
Turnout | 1,046 | 24.7 | |||
Liberal Democrats hold | Swing | ||||
Party | Candidate | Votes | % | ±% | |
---|---|---|---|---|---|
Labour | Richard Im Thurn | 719 | 72.6 | -5.1 | |
Conservative | David Blackadder | 272 | 27.4 | +5.1 | |
Majority | 447 | 45.1 | -10.2 | ||
Turnout | 991 | 23.1 | |||
Labour gain from Independent | Swing | ||||
Party | Candidate | Votes | % | ±% | |
---|---|---|---|---|---|
Conservative | Brian Dodd | 780 | 45.5 | -2.9 | |
Liberal Democrats | Trevor Allison | 654 | 38.1 | +4.2 | |
Labour | Ann Warwick | 281 | 16.4 | -1.3 | |
Majority | 126 | 7.3 | -7.2 | ||
Turnout | 1,715 | 40.4 | |||
Conservative hold | Swing | ||||
Party | Candidate | Votes | % | ±% | |
---|---|---|---|---|---|
Labour | Hugh McDevitt | 834 | 70.9 | +3.4 | |
Conservative | Stephen Metcalfe | 232 | 19.7 | +2.1 | |
Liberal Democrats | Olwyn Luckley | 111 | 9.4 | -5.5 | |
Majority | 602 | 51.1 | +1.2 | ||
Turnout | 1,177 | 26.9 | |||
Labour hold | Swing | ||||
Party | Candidate | Votes | % | ±% | |
---|---|---|---|---|---|
Labour | Cyril Weber | 851 | 67.3 | +5.2 | |
Conservative | Michele Gwillim | 311 | 24.6 | -13.3 | |
Liberal Democrats | Eileen Aldersey | 102 | 8.1 | +8.1 | |
Majority | 540 | 42.7 | +18.4 | ||
Turnout | 1,264 | 28.3 | |||
Labour hold | Swing | ||||
Party | Candidate | Votes | % | ±% | |
---|---|---|---|---|---|
Conservative | James Knapton | 419 | 76.5 | ||
Labour | Alex Faulds | 129 | 23.5 | ||
Majority | 290 | 52.9 | |||
Turnout | 548 | 33.7 | |||
Conservative hold | Swing | ||||
Party | Candidate | Votes | % | ±% | |
---|---|---|---|---|---|
Conservative | John Jefferson | 568 | 62.2 | +3.0 | |
Labour | Robert Dodds | 345 | 37.8 | -3.0 | |
Majority | 223 | 24.4 | +6.0 | ||
Turnout | 913 | 29.0 | |||
Conservative hold | Swing | ||||
Party | Candidate | Votes | % | ±% | |
---|---|---|---|---|---|
Conservative | Cyril Bowman | 421 | 82.7 | ||
Labour | Roger Horne | 88 | 17.3 | ||
Majority | 333 | 65.4 | |||
Turnout | 509 | 32.8 | |||
Conservative hold | Swing | ||||
Party | Candidate | Votes | % | ±% | |
---|---|---|---|---|---|
Liberal Democrats | Ralph Aldersey | 947 | 50.3 | -0.7 | |
Labour | John Bell | 935 | 49.7 | +10.9 | |
Majority | 12 | 0.6 | -11.5 | ||
Turnout | 1,882 | 39.7 | |||
Liberal Democrats hold | Swing | ||||
Party | Candidate | Votes | % | ±% | |
---|---|---|---|---|---|
Labour | Reginald Watson | 691 | 49.0 | -10.8 | |
Conservative | Lawrence Fisher | 551 | 39.1 | -1.1 | |
Liberal Democrats | Steven Tweedie | 167 | 11.9 | +11.9 | |
Majority | 140 | 9.9 | -9.6 | ||
Turnout | 1,409 | 30.8 | |||
Labour gain from Conservative | Swing | ||||
Party | Candidate | Votes | % | ±% | |
---|---|---|---|---|---|
Conservative | Edward Firth | 737 | 74.3 | -3.3 | |
Labour | John Hale | 255 | 25.7 | +3.3 | |
Majority | 482 | 48.6 | -6.6 | ||
Turnout | 992 | 30.2 | |||
Conservative hold | Swing | ||||
Party | Candidate | Votes | % | ±% | |
---|---|---|---|---|---|
Conservative | Jacquelyne Geddes | 930 | 56.6 | -9.2 | |
Labour | Keith Aitken | 479 | 29.2 | -5.0 | |
Liberal Democrats | Roger O'Brienn | 234 | 14.2 | +14.2 | |
Majority | 451 | 27.4 | -4.2 | ||
Turnout | 1,643 | 35.3 | |||
Conservative hold | Swing | ||||
Party | Candidate | Votes | % | ±% | |
---|---|---|---|---|---|
Labour | Margaret Martlew | 774 | 63.8 | -5.4 | |
Conservative | Richard Hyslop | 273 | 22.5 | -8.3 | |
Liberal Democrats | James Osler | 167 | 13.8 | +13.8 | |
Majority | 501 | 41.3 | +2.9 | ||
Turnout | 1,214 | 30.2 | |||
Labour hold | Swing | ||||
Party | Candidate | Votes | % | ±% | |
---|---|---|---|---|---|
Conservative | Barry Earp | 983 | 76.9 | +15.3 | |
Labour | Helen Horne | 295 | 23.1 | +23.1 | |
Majority | 688 | 53.8 | +30.6 | ||
Turnout | 1,278 | 37.4 | |||
Conservative hold | Swing | ||||
Party | Candidate | Votes | % | ±% | |
---|---|---|---|---|---|
Labour | Joseph Hendry | 831 | 51.3 | +5.6 | |
Conservative | Bryan Hodgson | 624 | 38.5 | -5.9 | |
Liberal Democrats | Hannah Farmer | 166 | 10.2 | +0.4 | |
Majority | 207 | 12.8 | +11.5 | ||
Turnout | 1,621 | 34.0 | |||
Labour gain from Conservative | Swing | ||||
The City of Carlisle was a local government district of Cumbria, England, with the status of a city. It was named after its largest settlement, Carlisle, but covered a far larger area which included the towns of Brampton and Longtown, as well as outlying villages including Dalston, Scotby and Wetheral. In 2011 the district had a population of 107,524, and an area of 1,039.97 square kilometres (402 sq mi).
One third of Carlisle City Council in Cumbria, England, was elected each year, followed by one year without election.
Thanet District Council elections are held every four years to elect Thanet District Council in Kent, England. Since the last boundary changes in 2003 the council has comprised 56 councillors representing 23 wards.
The 2008 Tunbridge Wells Borough Council election took place on 1 May 2008 to elect members of Tunbridge Wells Borough Council in Kent, England. One third of the council was up for election and the Conservative Party stayed in overall control of the council.
The 2004 Harrogate Council election took place on 10 June 2004 to elect members of Harrogate Borough Council in North Yorkshire, England. One third of the council was up for election and the Conservative Party stayed in overall control of the council.
The 2003 North Devon District Council election took place on 1 May 2003 to elect members of North Devon District Council in Devon, England. The whole council was up for election with boundary changes since the last election in 1999 reducing the number of seats by 1. The Liberal Democrats stayed in overall control of the council.
An election was held on 1 May 2003 to elect members of Gedling Borough Council in Nottinghamshire, England. The whole council was up for election with boundary changes since the last election in 1999 reducing the number of seats by 7. The Conservative Party lost overall control of the council to no overall control.
The 1999 Carlisle City Council election took place on 6 May 1999 to elect members of Carlisle District Council in Cumbria, England. The whole council was up for election after boundary changes increased the number of seats by one. The Conservative Party gained overall control of the council from the Labour Party.
The 2000 Carlisle City Council election took place on 4 May 2000 to elect members of Carlisle District Council in Cumbria, England. One third of the council was up for election and the Conservative Party stayed in overall control of the council.
The 2002 Carlisle City Council election took place on 2 May 2002 to elect members of Carlisle District Council in Cumbria, England. One third of the council was up for election and the Conservative Party stayed in overall control of the council.
The 2004 Carlisle City Council election took place on 10 June 2004 to elect members of Carlisle District Council in Cumbria, England. One third of the council was up for election and the council stayed under no overall control.
The 2006 Carlisle City Council election took place on 4 May 2006 to elect members of Carlisle District Council in Cumbria, England. One third of the council was up for election and the council stayed under no overall control.
The 2007 Carlisle City Council election took place on 3 May 2007 to elect members of Carlisle District Council in Cumbria, England. One third of the council was up for election and the council stayed under no overall control.
The 2008 Carlisle City Council election took place on 1 May 2008 to elect members of Carlisle District Council in Cumbria, England. One third of the council was up for election and the council stayed under no overall control.
The 2010 Carlisle City Council election took place on 6 May 2010 to elect members of Carlisle District Council in Cumbria, England. One third of the council was up for election and the council stayed under no overall control.
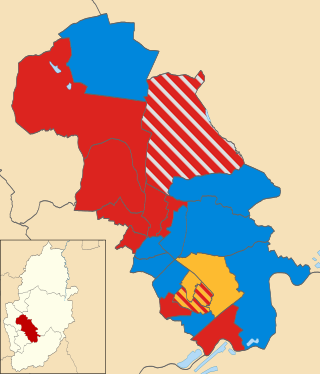
The 2011 Carlisle City Council election took place on 5 May 2011 to elect members of Carlisle District Council in Cumbria, England. One third of the council was up for election and the council stayed under no overall control.
The 2003 Derbyshire Dales District Council election took place on 1 May 2003 to elect members of Derbyshire Dales District Council in Derbyshire, England. The whole council was up for election with boundary changes since the last election in 1999. The Conservative Party stayed in overall control of the council.
The 2012 Carlisle City Council election took place on 3 May 2012 to elect members of Carlisle District Council in Cumbria, England. One third of the council was up for election and the Labour Party gained overall control of the council from no overall control.
The 2014 Carlisle City Council election took place on 22 May 2014 to elect members of Carlisle District Council in Cumbria, England. One third of the council was up for election and the Labour Party stayed in overall control of the council.
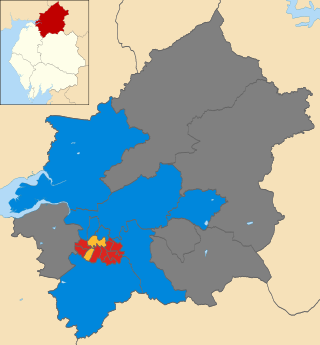
The 2022 Birmingham City Council election took place on 5 May 2022, with all 101 council seats up for election across 37 single-member and 32 two-member wards. The election was held alongside other local elections across Great Britain and town council elections in Sutton Coldfield.