2001 Cumbria County Council election

Last updated

2001 Cumbria County Council election [1]
County Flag of Cumbria.png
  1997 7 June 2001 2005  

All 84 seats of Cumbria County Council
43 seats needed for a majority
 First partySecond party
 
Party Labour Conservative
Last election44 seats, 40.4%22 seats, 36.8%
Seats won4033
Seat changeDecrease2.svg4Increase2.svg11
Popular vote90,01193,931
Percentage37.5%39.2%
SwingDecrease2.svg2.9%Increase2.svg2.4%

 Third partyFourth party
 
Party Liberal Democrats Independent
Last election13 seats, 19.4%4 seats, 3.0%
Seats won101
Seat changeDecrease2.svg3Decrease2.svg3
Popular vote42,1378,245
Percentage17.6%3.4%
SwingDecrease2.svg1.8%Increase2.svg0.4%

Cumbria UK local election 2001 map.svg
Map showing the results of the 2001 Cumbria County Council elections.

Council control before election


Labour Party

Council control after election


No overall control

Elections to Cumbria County Council were held on 7 June 2001. This was on the same day as other UK county council elections. The Labour Party lost control of the council, and was now under no overall control.

Contents

Results

2001 Cumbria County Council election [1]
PartySeatsGainsLossesNet gain/lossSeats %Votes %Votes+/−
  Labour 40Decrease2.svg447.637.590,011Decrease2.svg2.9
  Conservative 33Increase2.svg1139.339.293,931Increase2.svg2.4
  Liberal Democrats 10Decrease2.svg311.917.642,137Decrease2.svg1.8
  Independent 1Decrease2.svg31.23.48,245Increase2.svg0.4
  Socialist People's Party 0Steady2.svg0.01.74,194New
  Liberal 0Steady2.svg0.00.3748Increase2.svg0.1
  Green 0Steady2.svg0.00.2363Steady2.svg0.0
  Legalise Cannabis 0Steady2.svg0.00.1286New

Results by electoral division

Allerdale

Aspatria & Wharrels

Aspatria & Wharrels (1 seat) [2] [3]
PartyCandidateVotes%
Conservative Kathleen Elizabeth Brandwood 1,467 42.6%
Labour Colin Harold Ainsworth1,44742.1%
Liberal Democrats Charles Arthur Alfred Miles52715.3%
Turnout 3,44165.3%
Conservative win (new seat)

Bowness Thursby & Caldbeck

Bowness Thursby & Caldbeck (1 seat) [2] [3]
PartyCandidateVotes%
Conservative Duncan Stewart Fairbairn 1,916 56.3%
Liberal Democrats Agnes Mary Martin86525.4%
Labour Gordon Hanning62318.3%
Turnout 3,40466.9%
Conservative win (new seat)

Cockermouth East

Cockermouth East (1 seat) [2] [3]
PartyCandidateVotes%
Conservative Eric William Nicholson 1,706 49.8%
Labour Martin Trevor Mundahl Harris1,13133.0%
Liberal Democrats Margaret Patricia Burgess58817.2%
Turnout 3,42567.3%
Conservative win (new seat)

Cockermouth West

Cockermouth West (1 seat) [2] [3]
PartyCandidateVotes%
Conservative Timothy Heslop 1,223 46.6%
Labour Isabel Jeanette Burns95936.5%
Liberal Democrats John Morley44216.8%
Turnout 2,62463.9%
Conservative win (new seat)

Dearham and Broughton

Dearham and Broughton (1 seat) [2] [3]
PartyCandidateVotes%
Labour Alan Clark 2,245 62.6%
Conservative Maureen Betty Wood1,34237.4%
Turnout 3,58765.6%
Labour win (new seat)

Harrington

Harrington (1 seat) [2] [3]
PartyCandidateVotes%
Labour Joseph Simon Holliday 1,723 53.8%
Liberal Democrats Ian William Francis1,48046.2%
Turnout 3,20362.2%
Labour win (new seat)

Keswick & Derwent

Keswick & Derwent (1 seat) [2] [3]
PartyCandidateVotes%
Conservative Stanley Hinde 1,503 40.2%
Liberal Democrats Elizabeth Dick Barraclough1,22932.8%
Labour Denstone John Thornton Kemp1,01027.0%
Turnout 3,74263.6%
Conservative win (new seat)

Maryport East

Maryport East (1 seat) [2] [3]
PartyCandidateVotes%
Labour Derek Holmes 2,384 83.0%
Conservative James Lawson48717.0%
Turnout 2,87158.2%
Labour win (new seat)

Maryport West

Maryport West (1 seat) [2] [3]
PartyCandidateVotes%
Labour William Cameron 1,830 66.2%
Independent Michael John Innes Bird61222.1%
Conservative Helene Ann Hargreaves32311.7%
Turnout 2,76562.3%
Labour win (new seat)

Moorclose

Moorclose (1 seat) [2] [3]
PartyCandidateVotes%
Labour Gerald Humes 1,547 67.7%
Liberal Democrats Allan Caine73732.3%
Turnout 2,28458.9%
Labour win (new seat)

Moss Bay

Moss Bay (1 seat) [2] [3]
PartyCandidateVotes%
Labour Barbara Ann Cannon 1,555 80.0%
Liberal Democrats Christine Johansson38920.0%
Turnout 1,94454.0%
Labour win (new seat)

Seaton

Seaton (1 seat) [2] [3]
PartyCandidateVotes%
Labour Nicholas John Findley 1,716 71.0%
Conservative William Derwent Newton70129.0%
Turnout 2,41759.2%
Labour win (new seat)

Solway Coast

Solway Coast (1 seat) [2] [3]
PartyCandidateVotes%
Labour Robert William Allison 1,208 37.4%
Conservative Anthony James Markley1,16236.0%
Independent William Hayton Jefferson73922.9%
Legalise Cannabis John Peacock1213.7%
Turnout 3,23062.3%
Labour win (new seat)

St John's

St John's (1 seat) [2] [3]
PartyCandidateVotes%
Labour James Stewart Samson 1,633 60.2%
Conservative Robert Gibson Hardon1,08139.8%
Turnout 2,71462.1%
Labour win (new seat)

St Michaels

St Michae's (1 seat) [2] [3]
PartyCandidateVotes%
Labour Tracy Dawn Stainton 1,897 75.1%
Conservative Kenneth Reid Steel38615.3%
Liberal Democrats Mark Frederick Joseph Hayton2449.7%
Turnout 2,52761.6%
Labour win (new seat)

Wigton

Wigton (1 seat) [2] [3]
PartyCandidateVotes%
Conservative Robert Seivewright Johnstone Edgar 1,457 53.1%
Labour William Peter Walton75627.6%
Liberal Democrats Anne Holmes53119.4%
Turnout  %
Conservative win (new seat)

Barrow-in-Furness

Dalton North

Dalton North (1 seat) [2] [3]
PartyCandidateVotes%
Labour Peter Phizacklea 1,417 50.5%
Conservative William James Crosthwaite98735.2%
Socialist People's Party Thomas Weall40014.3%
Turnout 2,80459.7%
Labour win (new seat)

Dalton South

Dalton South (1 seat) [2] [3]
PartyCandidateVotes%
Labour William Smith 1,327 50.3%
Conservative Alan Rothery94835.9%
Independent Helene Young1887.1%
Socialist People's Party Dorothy Rita Turner1776.7%
Turnout 2,64057.3%
Labour win (new seat)

Hawcoat

Hawcoat (1 seat) [2] [3]
PartyCandidateVotes%
Conservative John Robert Richardson 1,774 60.9%
Labour Rebecca Jane Melling90831.2%
Socialist People's Party Margaret Ann Arts2317.9%
Turnout 2,91365.9%
Conservative win (new seat)

Hindpool

Hindpool (1 seat) [2] [3]
PartyCandidateVotes%
Labour Anne Burns 1,421 63.0%
Socialist People's Party Rosemarie Hamezeian45020.0%
Conservative Daniel Christopher Edwards38417.0%
Turnout 2,25549.4%
Labour win (new seat)

Newbarns

Newbarns (1 seat) [2] [3]
PartyCandidateVotes%
Conservative William Pears 1,264 46.7%
Labour Jeffrey Harold Garnett1,20744.6%
Socialist People's Party Norman Sidney Graham2378.8%
Turnout 2,70861.8%
Conservative win (new seat)

Old Barrow

Old Barrow (1 seat) [2] [3]
PartyCandidateVotes%
Labour Michael Anthony Hubbold 1,018 54.4%
Socialist People's Party Eric James Wood61232.7%
Conservative William Francis Palmer24112.9%
Turnout 1,87150.5%
Labour win (new seat)

Ormsgill

Ormsgill (1 seat) [2] [3]
PartyCandidateVotes%
Labour Ernest Roland Wilson 1,153 51.5%
Socialist People's Party Jim Hamezeian71932.1%
Conservative Kristina Louise Bell36716.4%
Turnout 2,23954.8%
Labour win (new seat)

Parkside

Parkside (1 seat) [2] [3]
PartyCandidateVotes%
Labour Alan David Nicholson 1,392 55.7%
Conservative Tina Macur83033.2%
Socialist People's Party Kenneth Arts27911.2%
Turnout 2,50159.6%
Labour win (new seat)

Risedale

Risedale (1 seat) [2] [3]
PartyCandidateVotes%
Labour Kevin Robert Hamilton 1,785 65.1%
Conservative Desmond English51718.8%
Socialist People's Party Alexander John Dacre44216.1%
Turnout 2,74452.9%
Labour win (new seat)

Roosecote

Roosecote (1 seat) [2] [3]
PartyCandidateVotes%
Labour Norman Maurice Shaw 1,361 52.5%
Conservative John William Joughin1,23247.5%
Turnout 2,59362.5%
Labour win (new seat)

Walney North

Walney North (1 seat) [2] [3]
PartyCandidateVotes%
Labour Jane Amelia Murphy 1,622 65.3%
Conservative Shirley Richardson56422.7%
Socialist People's Party William David Tucker29812.0%
Turnout 2,48458.5%
Labour win (new seat)

Walney South

Walney South (1 seat) [2] [3]
PartyCandidateVotes%
Labour Alfred Malcolm Horne 1,631 61.9%
Conservative David Roberts65524.9%
Socialist People's Party Deborah Morris34913.2%
Turnout 2,63559.6%
Labour win (new seat)

Carlisle

Belah

Belah (1 seat) [2] [3]
PartyCandidateVotes%
Conservative Alan Toole 1,731 55.5%
Labour Joseph Norman David Weedall1,38744.5%
Turnout 3,11864.9%
Conservative win (new seat)

Belle Vue

Belle Vue (1 seat) [2] [3]
PartyCandidateVotes%
Labour Cyril Frederick Weber 1,172 50.3%
Conservative George Arthur Taylor Bain80234.4%
Liberal Democrats George Robinson35815.4%
Turnout 2,33254.5%
Labour win (new seat)

Botcherby

Botcherby (1 seat) [2] [3]
PartyCandidateVotes%
Labour Anne Glendinning 1,361 60.2%
Conservative Gareth Michael Ellis58125.7%
Liberal Democrats John Martin32014.1%
Turnout 2,26250.4%
Labour win (new seat)

Brampton & Gilsland

Brampton & Gilsland (1 seat) [2] [3]
PartyCandidateVotes%
Conservative Kevan Wilkinson 1,875 60.2%
Labour John Christopher Hale1,24139.8%
Turnout 3,11661.8%
Conservative win (new seat)

Castle

Castle (1 seat) [2] [3]
PartyCandidateVotes%
Liberal Democrats Ralph Elliot Aldersey 994 44.6%
Labour Peter Bradley78635.3%
Conservative Charlotte Anne Fisher44820.1%
Turnout 51.4%
Liberal Democrats win (new seat)

Currock

Currock (1 seat) [2] [3]
PartyCandidateVotes%
Labour Brian Hall 1,469 61.9%
Conservative Judith Lorraine Pattinson61125.7%
Liberal Democrats John Michael Guest29412.4%
Turnout 2,37454.9%
Labour win (new seat)

Dalston & Cummersdale

Dalston & Cummersdale (1 seat) [2] [3]
PartyCandidateVotes%
Conservative John Richard Collier 1,982 56.1%
Labour Raymond Warwick82223.3%
Liberal Democrats David McMillan56215.9%
Green Peter Strong1674.7%
Turnout 3,53366.8%
Conservative win (new seat)

Denton Holme

Denton Holme (1 seat) [2] [3]
PartyCandidateVotes%
Labour Christopher John Southward 1,423 59.7%
Conservative Andrew John Stevenson61926.0%
Liberal Democrats Eileen Aldersey34114.3%
Turnout 2,38353.3%
Labour win (new seat)

Harraby

Harraby (1 seat) [2] [3]
PartyCandidateVotes%
Labour Michael Louis Richardson 1,596 62.8%
Conservative Michele Dawn Gwillim94637.2%
Turnout 2,54255.9%
Labour win (new seat)

Longtown & Bewcastle

Longtown & Bewcastle (1 seat) [2] [3]
PartyCandidateVotes%
Conservative John Donald Jefferson 1,864 62.0%
Labour Robert Dodds77225.7%
Liberal Democrats Raymond Langstone36912.3%
Turnout 3,00561.3%
Conservative win (new seat)

Morton

Morton (1 seat) [2] [3]
PartyCandidateVotes%
Liberal Democrats John Peter Farmer 1,342 43.9%
Conservative Anne Quilter1,22440.1%
Labour Donald Norman Joscelyne48816.0%
Turnout 3,05462.2%
Liberal Democrats win (new seat)

St Aidans

St Aidans (1 seat) [2] [3]
PartyCandidateVotes%
Labour Reginald Watson 1,284 49.1%
Conservative Anthony Richard Fontes93335.7%
Liberal Democrats Judith Edmondson39915.3%
Turnout 2,61657.8%
Labour win (new seat)

Stanwix & Irthington

Stanwix & Irthington (1 seat) [2] [3]
PartyCandidateVotes%
Conservative John Mallinson 1,670 52.3%
Independent William James Graham1,52147.7%
Turnout 65.9%
Conservative win (new seat)

Stanwix Urban

Stanwix Urban (1 seat) [2] [3]
PartyCandidateVotes%
Conservative Elizabeth Anne Mallinson 1,810 57.2%
Labour Keith Aitken1,35542.8%
Turnout 3,16567.7%
Conservative win (new seat)

Upperby

Upperby (1 seat) [2] [3]
PartyCandidateVotes%
Labour Stewart Farries Young 1,565 70.6%
Conservative Jean Watson65329.4%
Turnout 2,21853.3%
Labour win (new seat)

Wetheral

Wetheral (1 seat) [2] [3]
PartyCandidateVotes%
Conservative John Robert Dalton Robinson 2,255 66.3%
Labour Roger Nicholson Horne1,14633.7%
Turnout 3,40166.8%
Conservative win (new seat)

Yewdale

Yewdale (1 seat) [2] [3]
PartyCandidateVotes%
Labour Helen Marion Horne 1,453 49.7%
Conservative Bryan Hodgson1,06836.5%
Liberal Democrats Thomas Geoffrey Hodgson40413.8%
Turnout 2,92561.5%
Labour win (new seat)

Copeland

Bransty

Bransty (1 seat) [2] [3]
PartyCandidateVotes%
Labour Bernard William Kirk 1,694 59.3%
Conservative Mary Simon1,16440.7%
Turnout 2,85862.7%
Labour win (new seat)

Cleator Moor North and Frizington

Cleator Moor North and Frizington (1 seat) [2] [3]
PartyCandidateVotes%
Labour Timothy John Knowles 2,014 65.7%
Conservative Hilda Joyce Morris65921.5%
Liberal Democrats Mike Minogue39212.8%
Turnout 3,06559.5%
Labour win (new seat)

Cleator Moor South & Egremont

Cleator Moor South & Egremont (1 seat) [2] [3]
PartyCandidateVotes%
Labour Simon Arthur John Leyton 2,102 61.5%
Conservative Doreen Platt89726.3%
Liberal Democrats Gabrielle Maureen Minogue41812.2%
Turnout 3,41765.2%
Labour win (new seat)

Distington & Moresby

Distington & Moresby (1 seat) [2] [3]
PartyCandidateVotes%
Labour Archibald Campbell Ross 1,417 55.8%
Conservative Leah Higgins71828.3%
Liberal Democrats Francis Graeme Hollowell40616.0%
Turnout 2,54161.3%
Labour win (new seat)

Gosforth & Ennerdale

Gosforth & Ennerdale (1 seat) [2] [3]
PartyCandidateVotes%
Conservative Ashton Reginald Marson Toft 1,641 55.6%
Labour Christina Margaret Cornall78826.7%
Liberal Democrats Lucille Eleanor Dunn52517.8%
Turnout 2,95468.9%
Conservative win (new seat)

Hensingham & Arlecdon

Hensingham & Arlecdon (1 seat) [2] [3]
PartyCandidateVotes%
Labour Ronald Calvin 1,879 68.4%
Conservative Gareth Richard Charles Maley87031.6%
Turnout 2,74961.3%
Labour win (new seat)

Hillcrest

Hillcrest and Hensingham (1 seat) [2] [3]
PartyCandidateVotes%
Labour Judith Andersen 1,489 54.2%
Conservative Dorothy Anne Wonnacott1,25645.8%
Turnout 2,74563.3%
Labour win (new seat)

Kells and Sandwith

Kells and Sandwith (1 seat) [2] [3]
PartyCandidateVotes%
Labour Joseph Benedict McAllister 1,774 76.5%
Conservative George Edward Mitchell Higgins54523.5%
Turnout 2,31960.9%
Labour win (new seat)

Millom

Millom (1 seat) [2] [3]
PartyCandidateVotes%
Conservative Peter Hodgson 1,473 40.0%
Labour John Park1,45939.6%
Liberal Anthony Baines74820.3%
Turnout 1,41365.5%
Conservative win (new seat)

Mirehouse

Mirehouse (1 seat) [2] [3]
PartyCandidateVotes%
Labour John Woolley 1,714 81.1%
Conservative Jean Lewthwaite39918.9%
Turnout 2,11359.2%
Labour win (new seat)

Seascale & Whicham

Seascale & Whicham (1 seat) [2] [3]
PartyCandidateVotes%
Conservative Susan Elizabeth Brown 1,778 53.2%
Liberal Democrats Roger Charles Putnam92027.5%
Labour George William Usher64219.2%
Turnout 3,34069.7%
Conservative win (new seat)

St Bees & Egremont

St Bees & Egremont (1 seat) [2] [3]
PartyCandidateVotes%
Labour David Edward Southward 1,530 57.3%
Conservative John Postlethwaite Holmes1,14242.7%
Turnout 2,67263.5%
Labour win (new seat)

Eden

Alston and East Fellside

Alston and East Fellside (1 seat) [2] [3]
PartyCandidateVotes%
Conservative Dennis Youngman 1,164 35.5%
Liberal Democrats George Winston Collinge67020.4%
Independent Bryan Metz62919.2%
Independent Richard Vincent Turner34110.4%
Labour Lewis Moncrieff3099.4%
Legalise Cannabis Mark Gibson1655.0%
Turnout 3,27868.5%
Conservative win (new seat)

Appleby

Appleby (1 seat) [2] [3]
PartyCandidateVotes%
Conservative Mary Margaret Warburton 2,011 73.7%
Labour Edward Robertson71926.3%
Turnout 2,73063.9%
Conservative win (new seat)

Eden Lakes

Eden Lakes (1 seat) [2] [3]
PartyCandidateVotes%
Conservative Roger Andrew Bird 1,269 44.0%
Liberal Democrats Neil Hughes78627.3%
Independent John James Moffat47716.5%
Labour Jeanette Bradley35212.2%
Turnout 2,88466.6%
Conservative win (new seat)

Greystoke and Hesket

Greystoke and Hesket (1 seat) [2] [3]
PartyCandidateVotes%
Conservative Albert Pearson Richardson 1,391 45.1%
Independent Gordon Richard Savage61419.9%
Liberal Democrats David Treharne Leonard53517.3%
Labour Elsie Coleman35111.4%
Green Neville Bradshaw1966.3%
Turnout 3,08769.6%
Conservative win (new seat)

Kirkby Stephen

Kirkby Stephen (1 seat) [2] [3]
PartyCandidateVotes%
Conservative Timothy Crispin Stoddard 1,257 40.9%
Independent John Malcolm Smith84527.5%
Liberal Democrats Nicholas James Pemberton70923.0%
Labour Andrew Stevenson2668.6%
Turnout 3,07765.2%
Conservative win (new seat)

Penrith East

Penrith East (1 seat) [2] [3]
PartyCandidateVotes%
Liberal Democrats Michael Ash 914 37.4%
Conservative Helen Jane Fearon82433.7%
Labour Christopher Merchant41617.0%
Independent Graeme Collingwood29011.9%
Turnout 2,44456.5%
Liberal Democrats win (new seat)

Penrith North

Penrith North (1 seat) [2] [3]
PartyCandidateVotes%
Conservative Philip Guy Chappelhow 1,328 47.1%
Liberal Democrats David John Crouchley96334.1%
Labour Ann Ellams52918.8%
Turnout 2,82062.5%
Conservative win (new seat)

Penrith Rural

Penrith Rural (1 seat) [2] [3]
PartyCandidateVotes%
Conservative Gary Brian Strong 1,636 56.9%
Independent David Ian Addison Nattrass72125.1%
Labour Christopher Bagshaw52018.1%
Turnout 2,87768.2%
Conservative win (new seat)

Penrith West

Penrith West (1 seat) [2] [3]
PartyCandidateVotes%
Independent Colin Nineham 713 33.1%
Conservative John George Thompson67031.1%
Liberal Democrats Geoffrey Charles Mason40919.0%
Labour Geoffrey Rockliffe-King36216.8%
Turnout 2,15453.1%
Independent win (new seat)

South Lakeland

Cartmel

Cartmel (1 seat) [2] [3]
PartyCandidateVotes%
Liberal Democrats Ronald Mein 1,564 54.1%
Conservative William John Wearing1,32745.9%
Turnout 2,89164.3%
Liberal Democrats win (new seat)

Grange

Grange (1 seat) [2] [3]
PartyCandidateVotes%
Conservative Peter Craig Jackson 2,090 60.2%
Liberal Democrats Gwyneth Raymond1,38139.8%
Turnout 3,47168.0%
Conservative win (new seat)

High Furness

High Furness (1 seat) [2] [3]
PartyCandidateVotes%
Conservative Oliver Henry Pearson 1,565 51.3%
Liberal Democrats Edward Colin Davies1,48848.7%
Turnout 3,05369.0%
Conservative win (new seat)

Kendal Castle

Kendal Castle (1 seat) [2] [3]
PartyCandidateVotes%
Liberal Democrats Thomas Clare 2,167 67.1%
Conservative Olga Vyacheslavna Lewis1,06432.9%
Turnout 3,23174.6%
Liberal Democrats win (new seat)

Kendal Highgate

Kendal Highgate (1 seat) [2] [3]
PartyCandidateVotes%
Labour Martyn Geoffrey Jowett 1,117 40.5%
Liberal Democrats Brendan Jameson99035.9%
Conservative Frank Brooks64823.5%
Turnout 2,75561.0%
Labour win (new seat)

Kendal Nether

Kendal Nether (1 seat) [2] [3]
PartyCandidateVotes%
Liberal Democrats Leslie Lishman 1,273 41.9%
Labour Paul Michael Braithwaite95331.4%
Conservative Melvin Mackie81026.7%
Turnout 3,03662.5%
Liberal Democrats win (new seat)

Kendal South

Kendal South (1 seat) [2] [3]
PartyCandidateVotes%
Conservative Alan Denis Bobbett 1,393 43.0%
Liberal Democrats Graham Jeffrey Vincent1,33241.1%
Labour Charles Henry Batteson51215.8%
Turnout 3,23769.0%
Conservative win (new seat)

Kendal Strickland and Fell

Kendal Strickland and Fell (1 seat) [2] [3]
PartyCandidateVotes%
Labour David Thompson Clarke 1,469 51.3%
Liberal Democrats Neil Anthony Mackereth74225.9%
Conservative Elizabeth Muriel Graham65022.7%
Turnout 286162.9%
Labour win (new seat)

Kent Estuary

Kent Estuary (1 seat) [2] [3]
PartyCandidateVotes%
Liberal Democrats Ian Stewart 1,965 53.3%
Conservative Richard William Rollins1,72546.7%
Turnout 3,69070.6%
Liberal Democrats win (new seat)

Lakes

Lakes (1 seat) [2] [3]
PartyCandidateVotes%
Liberal Democrats Anne Parker 1,144 41.5%
Conservative Brian Barton1,05938.4%
Independent George Middleton55520.1%
Turnout 2,75858.9%
Liberal Democrats win (new seat)

Low Furness

Low Furness (1 seat) [2] [3]
PartyCandidateVotes%
Conservative Robert James Webster 1,864 62.0%
Liberal Democrats Noel Roy Spendlove77225.7%
Labour Richard Scott36912.3%
Turnout 3,02861.3%
Conservative win (new seat)

Lower Kentdale

Lower Kentdale (1 seat) [2] [3]
PartyCandidateVotes%
Conservative Roger Kenneth Bingham 2,207 69.0%
Liberal Democrats Antony Jolley99131.0%
Turnout 3,19872.2%
Conservative win (new seat)

Lyth Valley

Lyth Valley (1 seat) [2] [3]
PartyCandidateVotes%
Conservative James Bland 1,500 53.4%
Liberal Democrats Stanley Bernard Collins1,30746.6%
Turnout 4,27865.6%
Conservative win (new seat)

Sedbergh and Kirkby Lonsdale

Sedbergh and Kirkby Lonsdale (1 seat) [2] [3]
PartyCandidateVotes%
Conservative Joseph Nicholson 2,066 64.8%
Liberal Democrats Sydney Charles McLennan1,12035.2%
Turnout 3,18666.7%
Conservative win (new seat)

Ulverston East

Ulverston East (1 seat) [2] [3]
PartyCandidateVotes%
Labour Wendy Anne Kolbe 1,691 63.1%
Conservative Christopher Mark Hornby98736.9%
Turnout 2,67856.5%
Labour win (new seat)

Ulverston West

Ulverston West (1 seat) [2] [3]
PartyCandidateVotes%
Conservative Pauline Margaret Halfpenny 1,774 58.4%
Labour Bharath Sundara Rajan1,26541.6%
Turnout 3,03965.8%
Conservative win (new seat)

Upper Kent

Upper Kent (1 seat) [2] [3]
PartyCandidateVotes%
Liberal Democrats Lawson Short 1,640 53.1%
Conservative Stephen Proctor1,44846.9%
Turnout 3,08869.6%
Liberal Democrats win (new seat)

Windermere

Windermere (1 seat) [2] [3]
PartyCandidateVotes%
Liberal Democrats Joan Elizabeth Stocker 1,928 57.9%
Conservative Ernest George Fallowfield1,40442.1%
Turnout 3,33265.1%
Liberal Democrats win (new seat)

Related Research Articles

<span class="mw-page-title-main">Borough of Copeland</span> Borough and Non-metropolitan district in England

The Borough of Copeland is a local government district and borough in western Cumbria, England. Its council is based in Whitehaven. It was formed on 1 April 1974 by the merger of the Borough of Whitehaven, Ennerdale Rural District and Millom Rural District. The population of the Non-Metropolitan district was 69,318 according to the 2001 census, increasing to 70,603 at the 2011 Census.

<span class="mw-page-title-main">City of Carlisle</span> City and non-metropolitan district in Cumbria, England

The City of Carlisle is a local government district of Cumbria, England, with the status of a city and non-metropolitan district. It is named after its largest settlement, Carlisle, but covers a far larger area which includes the towns of Brampton and Longtown, as well as outlying villages including Dalston, Scotby and Wetheral. In 2011 the district had a population of 107,524, and an area of 1,039.97 square kilometres (402 sq mi).

<span class="mw-page-title-main">Borough of Barrow-in-Furness</span> Local government district in Cumbria, England

Barrow-in-Furness is a local government district with borough status in Cumbria, England. It is named after its main town, Barrow-in-Furness. Other settlements include Dalton-in-Furness and Askam-in-Furness. It is the smallest district in the county, but is the most densely populated, with 924 people per square kilometre. The population was 71,980 in 2001, reducing to 69,087 at the 2011 Census.

<span class="mw-page-title-main">Penrith and The Border (UK Parliament constituency)</span> Parliamentary constituency in the United Kingdom, 1950 onwards

Penrith and The Border is a constituency in Cumbria represented in the House of Commons of the UK Parliament since 2019 by Neil Hudson, a Conservative.

<span class="mw-page-title-main">Longtown, Cumbria</span> Human settlement in England

Longtown is a market town in Cumbria, England, just south of the Scottish Border. It has a sheep market which was at the centre of the 2001 United Kingdom foot-and-mouth crisis. Just south-west of Longtown is Arthuret Church, dedicated to St Michael and All Angels.

Tynedale District Council elections were generally held every four years between the council's creation in 1974 and its abolition in 2009. Tynedale was a non-metropolitan district in Northumberland, England. The council was abolished and its functions transferred to Northumberland County Council with effect from 1 April 2009.

Cumbria County Council in England was elected every four years between 1973 and 2017. Since the last boundary changes in 2013, 84 councillors were elected from 84 wards for the last council before abolition in 2023.

<span class="mw-page-title-main">2001 United Kingdom local elections</span>

Local elections took place in some parts of the UK on 7 June 2001. Elections took place for all of the English shire counties, some English unitary authorities and all of the Northern Ireland districts. The elections were delayed from the usual date of the first Thursday in May due to the 2001 UK foot and mouth crisis and were held on the same day as the general election.

<span class="mw-page-title-main">Cumbria County Council</span>

Cumbria County Council is the county council for the non-metropolitan county of Cumbria in the North West of England. Established in April 1974, following its first elections held the previous year, it is an elected local government body responsible for the most significant local services in the area, including schools, roads, and social services.

<span class="mw-page-title-main">1977 United Kingdom local elections</span>

Local elections were held in the United Kingdom in 1977. The results were a major mid-term setback for the Labour government, and the Conservatives, the main opposition, comprehensively regained control of the Greater London Council with 64 seats against Labour's 28. Elections were also held in the county councils and in Northern Ireland.

<span class="mw-page-title-main">1981 United Kingdom local elections</span>

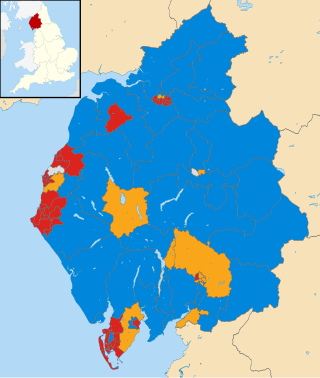
Local elections were held in the United Kingdom in May 1981. The results were a mid-term setback for the Conservative government, which lost 1,193 seats, leaving them with 10,545 councillors. The projected share of the vote was more respectable for the government, however: Labour 41%, Conservatives 38%, Liberals 17%. This was in spite of opinion polls showing a much wider Labour lead over the Conservatives. These were the first elections to be contested by Labour under the leadership of Michael Foot, who had succeeded James Callaghan in late 1980.

<span class="mw-page-title-main">1973 Cumbria County Council election</span>

Elections to Cumbria County Council were held on 12 April 1973. This was on the same day as other UK county council elections. The whole council of 82 members was up for election and the council fell under no overall control.

<span class="mw-page-title-main">1977 Cumbria County Council election</span>

Elections to Cumbria County Council were held on 5 May 1977. This was on the same day as other UK county council elections. The whole council of 82 members was up for election and the Conservative Party gained control of the council, which had previously been under no overall control.

<span class="mw-page-title-main">1981 Cumbria County Council election</span>

Elections to Cumbria County Council were held on 7 May 1981. This was on the same day as other UK county council elections. The council size was increased to 83 members following a boundary review. The Labour Party gained control of the council from the Conservative Party.

<span class="mw-page-title-main">1985 Cumbria County Council election</span>

Elections to Cumbria County Council were held on 2 May 1985. This was on the same day as other UK county council elections. The whole council of 83 members was up for election and the Labour Party lost control of the council, which fell under no overall control.

<span class="mw-page-title-main">1989 Cumbria County Council election</span>

Elections to Cumbria County Council were held on 4 May 1989. This was on the same day as other UK county council elections. The whole council of 83 members was up for election and the council remained under no overall control.

<span class="mw-page-title-main">1993 Cumbria County Council election</span>

Elections to Cumbria County Council were held on 6 May 1993. This was on the same day as other UK county council elections. The whole council of 83 members was up for election and the council remained under no overall control.

<span class="mw-page-title-main">1997 Cumbria County Council election</span>

Elections to Cumbria County Council were held on 1 May 1997. This was on the same day as other UK county council elections. The Labour Party gained control of the council, which had been under no overall control.

<span class="mw-page-title-main">2005 Cumbria County Council election</span>

Elections to Cumbria County Council were held on 5 May 2005. This was on the same day as other UK county council elections. The Labour Party lost their majority and the council fell under no overall control.

<span class="mw-page-title-main">Westmorland and Furness</span> Future unitary authority area in England

Westmorland and Furness is a future unitary authority area in the ceremonial county of Cumbria in north-west England. The council will cover the areas currently served by the districts of Barrow-in-Furness, Eden and South Lakeland. It will include all of the area of the historic county of Westmorland as well as the Furness district of historic Lancashire. It will also incorporate a very small part of historic Yorkshire together with about quarter of the area of the historic county of Cumberland.

References

  1. 1 2 "Local Election Summaries 2001". The Elections Centre. Retrieved 15 October 2019.
  2. 1 2 3 4 5 6 7 8 9 10 11 12 13 14 15 16 17 18 19 20 21 22 23 24 25 26 27 28 29 30 31 32 33 34 35 36 37 38 39 40 41 42 43 44 45 46 47 48 49 50 51 52 53 54 55 56 57 58 59 60 61 62 63 64 65 66 67 68 69 70 71 72 73 74 75 76 77 78 79 80 81 82 83 84 "Election 2001". Cumbria County Council. Archived from the original on 30 December 2001.
  3. 1 2 3 4 5 6 7 8 9 10 11 12 13 14 15 16 17 18 19 20 21 22 23 24 25 26 27 28 29 30 31 32 33 34 35 36 37 38 39 40 41 42 43 44 45 46 47 48 49 50 51 52 53 54 55 56 57 58 59 60 61 62 63 64 65 66 67 68 69 70 71 72 73 74 75 76 77 78 79 80 81 82 83 84 "Cumbria County Council Election Results 1973-2009" (PDF). Elections Centre. Retrieved 18 October 2019.