| |||||||||||||||||||||||||||||||||||||||||||||||||||||||||||||||||||||
All 25 seats to Newtownabbey Borough Council 13 seats needed for a majority | |||||||||||||||||||||||||||||||||||||||||||||||||||||||||||||||||||||
---|---|---|---|---|---|---|---|---|---|---|---|---|---|---|---|---|---|---|---|---|---|---|---|---|---|---|---|---|---|---|---|---|---|---|---|---|---|---|---|---|---|---|---|---|---|---|---|---|---|---|---|---|---|---|---|---|---|---|---|---|---|---|---|---|---|---|---|---|---|
| |||||||||||||||||||||||||||||||||||||||||||||||||||||||||||||||||||||
![]() Party with the most votes by district. |
Elections to Newtownabbey Borough Council were held on 7 June 2001 on the same day as the other Northern Irish local government elections. The election used four district electoral areas to elect a total of 25 councillors.
Party | Seats | Gains | Losses | Net gain/loss | Seats % | Votes % | Votes | +/− | |
---|---|---|---|---|---|---|---|---|---|
UUP | 9 | 0 | 1 | ![]() | 36.0 | 29.2 | 10,216 | ![]() | |
DUP | 8 | 0 | 6 | ![]() | 32.0 | 26.8 | 9,406 | ![]() | |
Independent | 2 | 2 | 0 | ![]() | 8.0 | 10.5 | 3,673 | ![]() | |
SDLP | 2 | 1 | 0 | ![]() | 8.0 | 5.7 | 2,015 | ![]() | |
Alliance | 1 | 0 | 2 | ![]() | 8.0 | 8.0 | 2,384 | ![]() | |
Sinn Féin | 1 | 0 | 0 | ![]() | 4.0 | 5.0 | 1,747 | ![]() | |
United Unionist Assembly Party | 1 | 0 | 0 | ![]() | 4.0 | 3.7 | 1,297 | New | |
Newtownabbey Ratepayers Association | 1 | 0 | 0 | ![]() | 4.0 | 3.1 | 1,039 | ![]() | |
PUP | 0 | 0 | 1 | ![]() | 0.0 | 4.1 | 1,458 | ![]() | |
NI Unionist | 0 | 0 | 0 | ![]() | 0.0 | 2.6 | 922 | New | |
NI Women's Coalition | 0 | 0 | 0 | ![]() | 0.0 | 0.8 | 299 | New | |
NI Conservatives | 0 | 0 | 0 | ![]() | 0.0 | 0.5 | 169 | New |
Note: "Votes" are the first preference votes.
Ward | % | Cllrs | % | Cllrs | % | Cllrs | % | Cllrs | % | Cllrs | % | Cllrs | Total Cllrs |
---|---|---|---|---|---|---|---|---|---|---|---|---|---|
UUP | DUP | SDLP | Alliance | Sinn Féin | Others | ||||||||
Antrim Line | 27.2 | 2 | 22.2 | 2 | 19.2 | 2 | 5.2 | 0 | 13.4 | 1 | 12.8 | 0 | 7 |
Ballyclare | 42.8 | 3 | 38.3 | 2 | 0.0 | 0 | 10.1 | 0 | 0.0 | 0 | 8.8 | 0 | 5 |
Macedon | 11.2 | 1 | 27.3 | 2 | 0.0 | 0 | 2.4 | 0 | 5.0 | 0 | 54.1 | 3 | 6 |
University | 33.6 | 3 | 22.7 | 2 | 0.0 | 0 | 13.1 | 1 | 0.0 | 0 | 30.6 | 1 | 7 |
Total | 29.2 | 9 | 26.8 | 8 | 5.7 | 2 | 8.0 | 1 | 5.0 | 1 | 25.3 | 4 | 25 |
1997: 3 x UUP, 1 x SDLP, 1 x Alliance, 1 x DUP, 1 x Newtownabbey Ratepayers
2001: 2 x DUP, 2 x UUP, 2 x SDLP, 1 x Sinn Féin
1997-2001 Change: DUP, SDLP and Sinn Féin gain from UUP, Alliance and Newtownabbey Ratepayers
Party | Candidate | FPv% | Count | ||||||||||
---|---|---|---|---|---|---|---|---|---|---|---|---|---|
1 | 2 | 3 | 4 | 5 | 6 | 7 | 8 | 9 | 10 | ||||
UUP | Janet Crilly | 16.28% | 1,704 | ||||||||||
DUP | Nigel Hamilton | 12.90% | 1,350 | ||||||||||
UUP | Ivan Hunter* | 5.80% | 607 | 869.43 | 923.58 | 925.89 | 978.8 | 986.73 | 1,167.63 | 1,311.63 | |||
DUP | Arthur Templeton | 6.11% | 640 | 649.66 | 661.66 | 667.45 | 672.91 | 1,031.59 | 1,167.9 | 1,225.43 | 1,225.43 | 1,428.43 | |
SDLP | Tommy McTeague* | 10.78% | 1,128 | 1,131.45 | 1,132.45 | 1,132.54 | 1,165.54 | 1,165.54 | 1,168 | 1,206.46 | 1,266.69 | 1,293.94 | |
Sinn Féin | Briege Meehan | 7.20% | 754 | 754.46 | 754.46 | 754.49 | 756.49 | 757.49 | 757.49 | 760.49 | 1,264.49 | 1,265.49 | |
SDLP | Noreen McClelland | 8.47% | 887 | 889.3 | 889.3 | 889.33 | 967.56 | 968.56 | 973.56 | 1,007.82 | 1,081.82 | 1,097.07 | |
Alliance | Pam Tilson | 5.23% | 547 | 555.05 | 564.05 | 564.14 | 619.09 | 621.09 | 630.32 | 739.73 | 740.73 | 914.42 | |
UUP | Arthur Kell* | 5.12% | 536 | 593.27 | 612.96 | 613.38 | 631.87 | 636.62 | 689.23 | 735.15 | 736.15 | ||
Sinn Féin | Roisin McGurk | 6.14% | 643 | 643 | 643 | 643 | 647 | 647 | 647 | 655.23 | |||
Newtownabbey Ratepayers | John Blair* | 3.72% | 389 | 396.82 | 451.28 | 451.55 | 487.39 | 490.42 | 524.86 | ||||
NI Unionist | Norman Boyd | 3.99% | 418 | 426.97 | 453.89 | 454.79 | 464.2 | 471.52 | |||||
DUP | Elizabeth Snoddy* | 3.22% | 337 | 347.81 | 362.27 | 392.09 | 402.81 | ||||||
NI Women's Coalition | Joan Cosgrove | 2.86% | 299 | 309.35 | 323.04 | 323.19 | |||||||
Independent | James Beckett | 2.18% | 228 | 232.37 | |||||||||
Electorate: 16,969 Valid: 10,467 (61.68%) Spoilt: 261 Quota: 1,309 Turnout: 10,728 (63.22%) |
1997: 3 x UUP, 1 x DUP, 1 x Alliance
2001: 3 x UUP, 2 x DUP
1997-2001 Change: DUP gain from Alliance
Party | Candidate | FPv% | Count | |||||||
---|---|---|---|---|---|---|---|---|---|---|
1 | 2 | 3 | 4 | 5 | 6 | 7 | ||||
DUP | Paul Girvan * | 34.22% | 2,583 | |||||||
DUP | Pamela Hunter | 4.08% | 308 | 1,449.4 | ||||||
UUP | Vera McWilliam* | 16.31% | 1,231 | 1,265.32 | ||||||
UUP | James Bingham* | 15.79% | 1,192 | 1,232.56 | 1,296.91 | |||||
UUP | Edward Turkington* | 7.17% | 541 | 560.76 | 604.57 | 673.67 | 701.03 | 783.91 | 1,108.91 | |
Alliance | Pat McCudden* | 10.08% | 761 | 774.52 | 783.1 | 813.61 | 814.51 | 880.12 | 927.12 | |
UUP | Peter Walker | 3.54% | 267 | 272.72 | 284.94 | 307.49 | 311.27 | 339.53 | ||
PUP | Norman Lavery | 3.30% | 249 | 270.84 | 291.12 | 305.8 | 307.87 | 327.17 | ||
Independent | Sharon Parkes | 3.27% | 247 | 254.8 | 272.22 | 285.6 | 287.22 | |||
NI Conservatives | Alan Greer | 2.24% | 169 | 188.76 | 204.75 | |||||
Electorate: 12,666 Valid: 7,548 (59.59%) Spoilt: 186 Quota: 1,259 Turnout: 7,734 (61.06%) |
1997: 2 x Newtownabbey Labour, 1 x UUP, 1 x UDP, 1 x Newtownabbey Ratepayers, 1 x Independent Unionist
2001: 2 x DUP, 2 x Independent, 1 x UUP, 1 x Newtownabbey Ratepayers
1997-2001 Change: DUP (two seats) gain from Newtownabbey Labour and Independent Unionist, Newtownabbey Labour and UDP become Independent
Party | Candidate | FPv% | Count | |||||||||
---|---|---|---|---|---|---|---|---|---|---|---|---|
1 | 2 | 3 | 4 | 5 | 6 | 7 | 8 | 9 | ||||
DUP | Billy DeCourcy | 19.29% | 1,355 | |||||||||
Independent | Mark Langhammer * | 18.88% | 1,326 | |||||||||
DUP | Andrew Hunter | 8.02% | 563 | 883.84 | 912.7 | 939.22 | 946.26 | 1,015.26 | ||||
UUP | Dineen Walker | 11.16% | 784 | 787.12 | 830.54 | 857.18 | 894.74 | 943.12 | 950.64 | 1,060.64 | ||
Newtownabbey Ratepayers | Billy Webb* | 9.25% | 650 | 652.86 | 706.68 | 742.28 | 803.18 | 831.48 | 961.24 | 1,000.22 | 1,019.22 | |
Independent | Tommy Kirkham * | 8.70% | 611 | 618.02 | 649.74 | 667.78 | 674.56 | 699.2 | 710.24 | 804.48 | 820.48 | |
Independent | Robert Kidd* | 5.38% | 378 | 382.42 | 451.06 | 471.44 | 491.56 | 550.46 | 640.88 | 756.8 | 774.8 | |
PUP | Dougie Jamison | 5.67% | 398 | 402.16 | 429.98 | 440.98 | 454.28 | 499.18 | 501.18 | |||
Sinn Féin | Kevin Vernon | 4.98% | 350 | 350 | 365.34 | 368.9 | 376.16 | 377.68 | ||||
Independent | Andrew Beattie* | 3.93% | 276 | 280.16 | 294.98 | 299.54 | 317.58 | |||||
Alliance | Michael Campbell | 2.46% | 173 | 173.52 | 191.46 | 206.98 | ||||||
Independent | Victor Robinson | 2.28% | 160 | 161.04 | 175.86 | |||||||
Electorate: 12,115 Valid: 7,024 (57.98%) Spoilt: 255 Quota: 1,004 Turnout: 7,279 (60.08%) |
1997: 3 x UUP, 2 x Independent Unionist, 1 x Alliance, 1 x PUP
2001: 3 x UUP, 2 x DUP, 1 x Alliance, 1 x United Unionist
1997-2001 Change: DUP (two seats) gain from PUP and Independent Unionist, Independent Unionist joins United Unionist
Party | Candidate | FPv% | Count | ||||||||
---|---|---|---|---|---|---|---|---|---|---|---|
1 | 2 | 3 | 4 | 5 | 6 | 7 | 8 | ||||
DUP | Roger Hutchinson | 17.92% | 1,791 | ||||||||
UUP | Ken Robinson * | 15.36% | 1,535 | ||||||||
UUP | Barbara Gilliland* | 13.52% | 1,351 | ||||||||
Alliance | Lynn Frazer* | 13.14% | 1,313 | ||||||||
United Unionist | Fraser Agnew * | 8.28% | 828 | 836.7 | 856.46 | 861.15 | 866.07 | 952.41 | 1,183.38 | 1,329.38 | |
DUP | John Mann | 4.79% | 479 | 976.4 | 989.89 | 993.81 | 994.89 | 1,051.57 | 1,100.67 | 1,253.67 | |
UUP | Vi Scott | 4.68% | 468 | 473.1 | 671.65 | 741.16 | 760.18 | 882.12 | 966.52 | 1,080.02 | |
PUP | William Greer* | 8.11% | 811 | 817.6 | 827.48 | 830.42 | 833.72 | 873.9 | 922.98 | 974.03 | |
NI Unionist | Billy Boyd | 5.04% | 504 | 509.7 | 517.49 | 519.73 | 521.71 | 540.75 | 578.13 | ||
United Unionist | John Scott | 4.69% | 469 | 471.1 | 488.2 | 491.91 | 495.33 | 527.11 | |||
Independent | Alister Bell | 4.47% | 447 | 449.1 | 460.12 | 462.57 | 483.75 | ||||
Electorate: 16,875 Valid: 9,996 (59.24%) Spoilt: 236 Quota: 1,250 Turnout: 10,232 (60.63%) |
Castle is one of the ten district electoral areas in Belfast, Northern Ireland. Located in the north of the city, the district elects six members to Belfast City Council and contains the wards of Bellevue, Cavehill, Chichester Park, Duncairn, Fortwilliam and Innisfayle. Castle, along with Oldpark district and parts of the Court district and Newtownabbey Borough Council, forms the Belfast North constituency for the Northern Ireland Assembly and UK Parliament. The district is bounded to the east by the Victoria Channel, to the north by Newtownabbey Borough Council and Belfast Lough, to the south by North Street and to the west by the Cavehill Road.
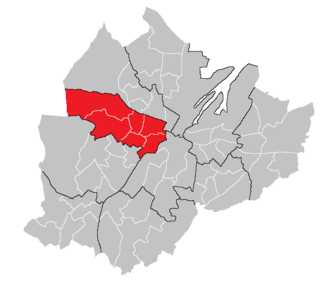
Court is one of the ten district electoral areas (DEA) in Belfast, Northern Ireland. Located in the north and west of the city, the district elects six members to Belfast City Council and contains the wards of Ballygomartin, Clonard, Falls, Forth River, Shankill, and Woodvale. Court is split between the Belfast North and Belfast West constituencies for the Northern Ireland Assembly and UK Parliament.
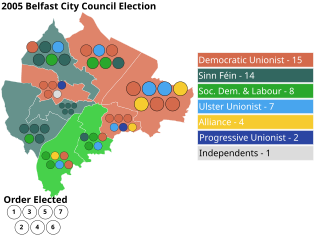
Elections to Belfast City Council were held on 5 May 2005 on the same day as the other Northern Irish local government elections. The election used nine district electoral areas to elect a total of 51 councillors, most representing the more heavily populated north and west.
Elections to Antrim and Newtownabbey Borough Council, part of the Northern Ireland local elections on 2 May 2019, returned 40 members to the council using Single Transferable Vote. The Democratic Unionist Party were the largest party in both first-preference votes and seats.
The second election to Causeway Coast and Glens Borough Council, part of the Northern Ireland local elections on 2 May 2019, returned 40 members to the council via Single Transferable Vote. The Democratic Unionist Party won a plurality of first-preference votes and seats.
Elections took place for Fermanagh and Omagh District Council on 2 May 2019, part of that year's local elections. 40 Councillors were elected via STV.
Elections to Belfast City Council were held on 7 June 2001 on the same day as the other Northern Irish local government elections. The election used nine district electoral areas to elect a total of 51 councillors, most representing the more heavily populated north and west.
Elections to Belfast City Council were held on 21 May 1997 on the same day as the other Northern Irish local government elections. The election used nine district electoral areas to elect a total of 51 councillors, most representing the more heavily populated north and west.
Elections to Belfast City Council were held on 19 May 1993 on the same day as the other Northern Irish local government elections. The election used nine district electoral areas to elect a total of 51 councillors, most representing the more heavily populated north and west.
Elections to Belfast City Council were held on 17 May 1989 on the same day as the other Northern Irish local government elections. The election used nine district electoral areas to elect a total of 51 councillors, most representing the more heavily populated north and west.
Elections to Lisburn Borough Council were held on 7 June 2001 on the same day as the other Northern Irish local government elections. The election used five district electoral areas to elect a total of 30 councillors.
Elections to Lisburn Borough Council were held on 21 May 1997 on the same day as the other Northern Irish local government elections. The election used five district electoral areas to elect a total of 30 councillors.
Elections to Newtownabbey Borough Council were held on 5 May 2011 on the same day as the other Northern Irish local government elections. The election used four district electoral areas to elect a total of 25 councillors.
Elections to Newtownabbey Borough Council were held on 5 May 2005 on the same day as the other Northern Irish local government elections. The election used four district electoral areas to elect a total of 25 councillors.
Elections to Newtownabbey Borough Council were held on 21 May 1997 on the same day as the other Northern Irish local government elections. The election used four district electoral areas to elect a total of 25 councillors.
Elections to Derry City Council were held on 19 May 1993 on the same day as the other Northern Irish local government elections. The election used five district electoral areas to elect a total of 30 councillors.
Elections to Omagh District Council were held on 7 June 2001 on the same day as the other Northern Irish local government elections. The election used three district electoral areas to elect a total of 21 councillors.
Macedon is one of the seven district electoral areas (DEA) in Antrim and Newtownabbey, Northern Ireland. The district elects six members to Antrim and Newtownabbey Borough Council and contains the wards of Abbey, Carnmoney Hill, O'Neill, Rathcoole, Valley and Whitehouse. Macedon forms part of the Belfast North constituencies for the Northern Ireland Assembly and UK Parliament and part of the East Antrim constituencies for the Northern Ireland Assembly and UK Parliament.
Antrim Line was one of the district electoral areas in Newtownabbey, Northern Ireland which existed from 1985 to 2014, one of five DEAs until 1993 and one of four DEAs until 2014. The district elected five members to Newtownabbey Borough Council until 1993 and seven members until 2014, and formed part of the South Antrim constituencies for the Northern Ireland Assembly and UK Parliament and part of the Belfast North constituencies for the Northern Ireland Assembly and UK Parliament.
Waterside is one of the seven district electoral areas (DEA) in Derry and Strabane, Northern Ireland. The district elects seven members to Derry and Strabane District Council and contains the wards of Caw, Clondermot, Drumahoe, Ebrington, Kilfennan, Lisnagelvin and Victoria. Waterside forms part of the Foyle constituencies for the Northern Ireland Assembly and UK Parliament.