1973 Belfast City Council election

Last updated

1973 Belfast City Council election
Flag of Belfast.svg
30 May 1973 1977  

All 51 seats to Belfast City Council
26 seats needed for a majority
Turnout62.54%
 First partySecond partyThird party
 
Party Ulster Unionist Alliance SDLP
Seats won2587

 Fourth partyFifth partySixth party
 
Party NI Labour Republican Clubs Democratic Unionist Party
Seats won222

 Seventh partyEighth partyNinth party
 
Party Ind. Unionist United Loyalist Loyalist Coalition
Seats won221

1973 Belfast City Council election (most voted party by electoral area).svg
Map showing results by electoral area.

Council control before election

Irish Unionist

Council control after election

No overall control

Elections to Belfast City Council were held on 30 May 1973 on the same day as the other Northern Irish local government elections. The election used eight district electoral areas to elect a total of 51 councillors.

Contents

The elections were the first following the reorganisation of local government in Northern Ireland, brought about by the Local Government (Boundaries) Act (Northern Ireland) 1971 & Local Government Act (Northern Ireland) 1972, which replaced the previous FPTP ward system with a new system of proportional representation using multi-member district electoral areas.

The Ulster Unionist Party maintained its position as the largest party, winning just short of a majority, and William Christie continued as Lord Mayor.

Results by party

PartySeats±First Pref. votesFPv%±%
Ulster Unionist 2583,65850.7%
Alliance 822,08113.4%
SDLP 718,82711.4%
NI Labour 29,0465.5%
Republican Clubs 26,5844.0%
United Loyalist26,2743.8%
Ind. Unionist 24,9973.0%
DUP 23,8602.3%
Loyalist Coalition14,8232.9%
Republican Labour 02,5941.6%
Independent Unionist Loyalist09670.6%
Independent Ratepayer06100.4%
Communist 02110.1%
Ulster Liberal 01720.1%
Non-Party0880.1%
Independent 01800.1%
Totals51168,667100%

[1]

Districts summary

[1]

Results of the Belfast City Council election, 1973
by district
Ward %
Cllrs
 %
Cllrs
 %
Cllrs
 %
Cllrs
 %
Cllrs
 %
Cllrs
 %
Cllrs
Total
Cllrs
UUP Alliance SDLP NILP RC DUP Others
Area A55.4410.615.206.110.008.2014.517
Area B62.3519.610.005.400.000.0012.707
Area C54.7422.824.504.702.400.0010.906
Area D7.0019.3144.544.0018.210.007.006
Area E39.917.417.3010.210.0013.5121.726
Area F49.233.8018.712.5016.117.512.206
Area G56.633.3116.513.904.800.0014.906
Area H62.0515.9114.814.700.000.002.607
Total50.72513.4811.475.524.022.3212.7551

Districts results

Area A

1973: 4 x UUP, 1 x Alliance, 1 x Vanguard, 1 x NILP

Area A - 7 seats [2]
PartyCandidateFPv%Count
12345678910111213141516
Ulster Unionist Grace Bannister 25.50%6,328               
Ulster Unionist William Blair6.04%1,4983,050 3,050 3,053.5 3,065.5 3,066.5 3,098.5 3,103.5        
Ulster Unionist Benjamin Horan11.15%2,7682,958.5 2,959.5 2,959.5 2,982 2,984 3,069.5 3,075.5 3,099 3,176      
Ulster Unionist Thomas Gildea6.44%1,5982,079 2,079 2,084.5 2,096.5 2,096.5 2,111 2,122 2,146.5 2,170.5 2,786 2,792 3,714   
Alliance Patricia Carson5.30%1,3151,373 1,376 1,440 1,440 1,457 1,459 1,675.5 2,398.5 2,410 2,444.5 2,444.5 2,535.5 2,688.5 3,226.5 
Vanguard William Elliott5.33%1,3221,358.5 1,358.5 1,358.5 1,418.5 1,419.5 1,498 1,500 1,506 1,622 1,698 1,705 1,773.5 1,847.5 1,850.5 3,049
NI Labour Erskine Holmes 5.39%1,3371,378.5 1,421.5 1,431.5 1,437 1,662.5 1,669.5 1,730 1,841 1,856 1,881.5 1,884.5 1,953 2,048 2,860.5 2,901.5
DUP Thomas Wright4.67%1,1581,176.5 1,177.5 1,177.5 1,209.5 1,212.5 1,269.5 1,271.5 1,273.5 1,860.5 1,889 1,927 2,025 2,184 2,187 2,391.5
United LoyalistW. Dougherty4.83%1,1981,265 1,265 1,265 1,317 1,317 1,405 1,406 1,414 1,527.5 1,568 1,571 1,619 1,666 1,670  
SDLP Ben Caraher 5.25%1,3021,309.5 1,329.5 1,332.5 1,332.5 1,445 1,446 1,483 1,502.5 1,504 1,509.5 1,510.5 1,512.5 1,512.5   
Ulster Unionist John McKeown4.11%1,0211,218.5 1,218.5 1,221.5 1,226.5 1,226.5 1,238 1,240 1,252 1,274 1,463.5 1,476.5     
Ulster Unionist Emma Dunbar2.20%546964.5 965.5 967.5 971.5 971.5 996.5 1,001.5 1,020.5 1,056       
DUP W. G. Greene3.52%874905 907 907 937.5 940.5 1,004.5 1,005.5 1,013.5        
Alliance Sam Edgerton2.83%702716 720 756 761 780 784 979.5         
Alliance Bernadette Hopkirk1.73%430435.5 436.5 494.5 497 550 552          
Ind. Unionist J. Keenan1.74%432443 443 446 479 480           
NI Labour J. Murray1.70%421422.5 440.5 446.5 450.5            
Ulster Constitution Party Lindsay Mason 1.09%271280 280 281             
Alliance Jacqueline Maguire0.77%192194 196              
Communist H. Moore0.41%101101               
Electorate: 38,311  Valid: 24,814 (64.77%)  Spoilt: 360  Quota: 3,102  Turnout: 25,174 (65.71%)  

    Area B

    1973: 5 x UUP, 1 x Alliance, 1 x United Loyalist

    Area B - 7 seats [2]
    PartyCandidateFPv%Count
    123456789101112
    Ulster Unionist Joshua Cardwell 25.41%6,708           
    Ulster Unionist John Allen14.81%3,910           
    United LoyalistH. K. Dickey12.77%3,371           
    Alliance Michael Brown9.65%2,5492,646.41 2,685.56 2,707.71 2,708.93 2,860.37 2,899.56 3,386.56    
    Ulster Unionist William Corry5.64%1,4882,786.46 3,156.21 3,158.38 3,174.74 3,193.73 3,212.88 3,266.45 3,331.45   
    Ulster Unionist Thomas Patton 6.94%1,8332,274.66 2,305.86 2,310.37 2,332.83 2,342.57 2,354.71 2,372.88 2,490.79 2,491.87 2,498.14 3,223.5
    Ulster Unionist H. Cranston4.11%1,0851,953.53 2,024.63 2,029.29 2,036.75 2,041.6 2,056.47 2,095.94 2,170.59 2,175.99 2,194.23 3,261.63
    Alliance David Wonnacott4.56%1,2051,241.21 1,243.31 1,260.37 1,260.71 1,536 1,546.59 1,902.65 2,630.45 2,705.33 2,707.04 2,896.56
    Ulster Unionist Dorothy Dunlop 5.41%1,4281,942.59 1,988.64 1,992.3 2,002.48 2,009.67 2,028.6 2,074.11 2,144.78 2,148.56 2,152.55  
    NI Labour William Gunning2.18%575607.64 609.74 795.29 797.43 804.64 1,290.46 1,328.86     
    Alliance Samuel Coulson3.33%878920.84 930.44 936.63 936.99 1,024.69 1,048.94      
    NI Labour H. Conway1.92%507533.52 539.07 626.58 627.76 631.8       
    Alliance P. Miller2.02%534555.93 558.93 566.59 567.13        
    NI Labour W. Kirkpatrick1.26%332343.73 344.63          
    Electorate: 39,227  Valid: 26,403 (67.31%)  Spoilt: 385  Quota: 3,301  Turnout: 26,788 (68.29%)  

      Area C

      1973: 4 x UUP, 2 x Alliance

      Area C - 6 seats [2]
      PartyCandidateFPv%Count
      123456789
      Alliance David Cook 10.60%2,2412,254 2,327 2,360 2,584 3,027   
      Ulster Unionist John Webster13.11%2,7702,771 2,771 2,946 2,952 2,985 3,023  
      Alliance Muriel Pritchard5.55%1,1721,174 1,176 1,198 1,427 1,757 2,279 3,158 
      Ulster Unionist F. J. McGibben10.63%2,2472,247 2,247 2,278 2,296 2,314 2,355 2,364 3,114
      Ulster Unionist John William Kennedy 12.35%2,6112,616 2,618 2,648 2,660 2,678 2,743 2,753 3,113
      Ulster Unionist W. D. Gilmore11.93%2,5222,525 2,528 2,616 2,626 2,645 2,726 2,741 3,003
      United LoyalistN. McNarry8.01%1,6931,694 1,697 1,794 1,797 1,806 1,857 1,871 1,926
      Ulster Unionist N. Preston6.64%1,4041,404 1,404 1,420 1,424 1,432 1,453 1,464  
      SDLP Mary Scott4.49%948949 1,149 1,160 1,177 1,197 1,413   
      NI Labour Brian Garrett3.87%817957 1,029 1,077 1,103 1,146    
      Alliance William Jeffrey3.46%731737 745 800 948     
      Alliance W. McDonough3.22%681683 685 699      
      Independent D. Donaghy2.87%610614 639       
      Republican Clubs P. Callaghan2.38%503508        
      NI Labour W. Copley0.88%186        
      Electorate: 32,071  Valid: 21,136 (65.90%)  Spoilt: 210  Quota: 3,020  Turnout: 21,346 (66.56%)  

        Area D

        1973: 4 x SDLP, 1 x Alliance, 1 x Republican Clubs

        Area D - 6 seats [2]
        PartyCandidateFPv%Count
        1234567891011121314151617181920
        SDLP J. Gillespie15.46%2,306                   
        Republican Clubs Raymond O'Hagan4.35%649649.84 652.84 652.84 652.84 657.84 663.91 791.91 796.91 799.91 985.05 996.26 1,005.47 1,035.47 1,040.75 1,509.82 1,573.78 1,574.78 2,559.38 
        SDLP Desmond O'Donnell8.93%1,3321,360.84 1,364.91 1,366.98 1,371.19 1,383.19 1,394.19 1,402.19 1,406.19 1,414.33 1,416.33 1,471.82 1,690.48 1,728.97 1,760.95 1,776.02 2,114.9 2,115.9 2,138.32 
        Alliance P. D. Corrie7.77%1,1591,162.92 1,163.92 1,164.92 1,167.99 1,174.99 1,175.99 1,177.99 1,184.06 1,266.06 1,268.06 1,351.13 1,366.41 1,386.48 1,656.7 1,668.9 1,698.18 1,810.18 1,853.18 1,819.18
        SDLP J. P. McCarron5.84%871954.09 959.16 963.65 965.72 971.93 979.07 983.07 1,004.21 1,015.95 1,017.42 1,099.96 1,176.73 1,244.36 1,272.78 1,286.13 1,493.21 1,498.21 1,566.26 1,701.26
        SDLP P. G. Wilson7.24%1,0801,087.14 1,088.14 1,091.14 1,097.14 1,104.35 1,108.4 1,112.42 1,136.49 1,145.7 1,152.7 1,183.7 1,294.75 1,332.96 1,356.1 1,383.17 1,532.53 1,553.53 1,572.53 1,687.53
        Alliance Reginald Donnelly5.52%822825.29 827.29 828.29 832.29 838.29 839.29 847.29 849.36 923.43 924.43 986.57 1,005.64 1,023.92 1,364.48 1,375.55 1,396.76 1,441.76 1,468.83 1,483.83
        Republican Clubs John Brady5.08%758758.91 765.91 773.05 774.05 775.05 787.19 866.19 888.86 889.26 945.26 955.47 963.47 1,136.89 1,143.89 1,383.03 1,412.1 1,412.1   
        Ulster Unionist A. W. Shaw7.01%1,0451,045.07 1,045.07 1,046.07 1,046.07 1,049.07 1,050.07 1,050.07 1,050.07 1,052.07 1,052.07 1,057.07 1,058.07 1,059.07 1,065.14 1,066.14 1,066.14    
        SDLP A. McKenna3.55%530541.97 548.97 562.11 565.11 568.11 672.18 676.18 680.18 701.39 709.39 730.88 808.37 851.72 878.14 909.21     
        Republican Clubs Ethel McAllister4.59%684684.56 686.56 691.7 691.7 691.7 692.7 709.7 727.84 729.84 818.84 826.05 832.05 861.12 866.12      
        Alliance A. J. McGrogan3.82%569572.01 573.08 573.08 579.15 585.22 585.22 586.22 588.22 691.29 698.29 754.36 764.36 772.71       
        Republican Labour D. Barnes2.41%360362.66 376.66 388.73 389.73 392.73 451.73 454.73 592.8 596.94 607.01 634.08 652.15        
        SDLP O'Connor3.51%524529.32 532.32 533.32 534.32 537.32 543.6 544.6 550.6 557.67 565.74 583.81         
        NI Labour T. Hannon2.19%326329.64 330.64 334.64 362.64 501.64 508.64 508.64 526.71 538.71 539.71          
        Republican Clubs Bernard McDonagh2.28%340340.21 343.21 346.42 346.42 346.42 346.49 369.49 378.56 381.56           
        Alliance Monica Slavin2.23%332332.98 334.05 336.05 341.12 345.12 350.12 351.12 353.12            
        Republican Labour J. Flanigan1.62%241241.84 248.84 275.84 275.84 277.84 299.84 303.84             
        Republican Clubs J. J. McElroy1.85%276276.07 281.07 283.07 283.07 285.07 291.07              
        Republican Labour J. J. McNamee1.72%256256.7 264.84 269.84 271.91 272.91               
        NI Labour R. Watson1.13%169169.56 170.56 171.56 220.63                
        NI Labour P. Moyna0.73%109109.63 112.63 112.7                 
        Republican Labour J. Lavelle0.60%9091.26 97.33                  
        Republican Labour F. McDermott0.58%8686.49                   
        Electorate: 34,437  Valid: 14,914 (43.31%)  Spoilt: 1,001  Quota: 2,131  Turnout: 15,915 (46.21%)  

          Area E

          1973: 1 x UUP, 1 x DUP, 1 x NILP, 1 x Alliance, 1 x United Loyalist, 1 x Independent Unionist

          Area E - 6 seats [2]
          PartyCandidateFPv%Count
          12345678
          Ulster Unionist William Christie 39.88%7,875       
          DUP Fred Proctor10.92%2,1563,413.95      
          Ind. Unionist Hugh Smyth 10.86%2,1453,131.7      
          NI Labour Billy Boyd 8.90%1,7582,439.85 2,485.73 2,518.7 2,554.11 2,808.9 2,879.9 
          United LoyalistDavid Smylie6.13%1,2101,761.2 2,295.1 2,463.53 2,556.84 2,578.66 2,581.61 3,030.61
          Alliance James Robinson7.35%1,4522,003.85 2,051.95 2,071.27 2,104.13 2,183.45 2,216.75 2,487.35
          SDLP J. P. Goan5.12%1,0121,016.55 1,018.03 1,018.03 1,018.03 1,388.98 1,974.63 1,985.47
          DUP K. B. Hoy2.60%5141,110.05 1,247.32 1,309.48 1,352.84 1,376.8 1,380.8  
          Republican Labour T. Fleming4.26%842845.25 845.25 845.25 845.9 870.9   
          SDLP P. J. Tanney2.19%432433.3 433.67 434.3 434.51    
          NI Labour George Chambers1.34%264338.1 346.24 349.6 358.59    
          Independent J. Moore0.45%88208.25 223.79 236.81     
          Electorate: 31,548  Valid: 19,748 (62.60%)  Spoilt: 267  Quota: 2,822  Turnout: 20,015 (63.44%)  

            Area F

            1973: 3 x UUP, 1 x SDLP, 1 x DUP, 1 x Republican Clubs

            Area F - 6 seats [2]
            PartyCandidateFPv%Count
            12345678910111213141516
            Ulster Unionist Harry Fletcher21.82%3,441               
            Ulster Unionist James Stewart 21.06%3,320               
            Ulster Unionist Thomas Murphy6.34%1,0002,049.24 2,971.48             
            SDLP Paddy Devlin 14.22%2,2422,242 2,242.64 2,242.96 2,259.96           
            Republican Clubs Jim Sullivan4.66%735735.34 735.66 735.98 740.98 752.98 753.98 753.98 756.98 758.98 772.98 1,072.98 1,072.98 1,461.98 1,691.64 2,419.62
            DUP William Spence7.55%1,1901,286.9 1,389.3 1,768.5 1,771.46 1,776.1 1,779.1 1,796.54 1,796.54 1,797.86 1,808.06 1,859.24 1,860.56 1,861.56 1,935.46 1,939.46
            SDLP Owen Allen3.01%475475.34 475.98 476.3 482.62 493.62 524.62 533.42 536.36 704.56 720.05 804.39 877.39 896.71 1,228.12 1,282.44
            Republican Clubs Sean O'Hare4.44%700700.68 701.64 701.64 705.64 720.64 744.64 747.64 748.13 751.62 751.62 769.94 850.92 1,089.92 1,111.24  
            Alliance Mary Smyth2.35%370376.12 382.2 413.88 416.22 431.9 423.24 448.44 448.44 475.44 693.79 859.69 872.69 876.69   
            Republican Clubs A. Dornan3.55%560560 560.32 560.32 562.32 546.32 595.32 595.32 595.32 595.64 597.64 606.64 681.64    
            Republican Clubs Sean Flynn3.41%538538.34 538.66 538.98 539.98 543.98 556.98 558.98 559.96 573.96 576.96 581.96     
            NI Labour T. Magee1.47%232538.34 538.66 538.98 539.98 543.98 556.98 558.98 559.96 573.96 576.96      
            Alliance P. Woods1.46%230231.02 234.22 249.58 260.58 258.9 258.9 270.82 272.29 285.29       
            SDLP Desmond Gillespie 1.46%230231.02 231.02 231.98 234.98 237.98 257.98 265.3 265.79        
            NI Labour W. Ritchie1.05%165170.44 180.36 213.32 213.66 229.98 232.98          
            Republican Labour W. J. Clarke0.82%129129.34 129.34 129.66 179.66 186.66           
            Communist Betty Sinclair 0.70%110110.68 111.96 113.88 115.22            
            Republican Labour Margaret McKenna0.46%7272 72.64 73.28             
            Republican Labour J. Marron0.18%2931.72 33.64 33.96             
            Electorate: 27,067  Valid: 15,768 (58.26%)  Spoilt: 622  Quota: 2,253  Turnout: 16,390 (60.55%)  

              Area G

              1973: 3 x UUP, 1 x SDLP, 1 x Alliance, 1 x Independent Unionist

              Area G - 6 seats [2]
              PartyCandidateFPv%Count
              123456789101112131415
              Ulster Unionist Margaret Laird20.90%3,632              
              Ulster Unionist Herbert Ditty 20.46%3,556              
              SDLP Gerry Fitt 16.55%2,876              
              Ulster Unionist Hugh Kidd15.25%2,651              
              Ind. Unionist Samuel Millar13.18%2,2913,210.98             
              Alliance Mary McKeown3.29%572680.68 1,104.32 1,194 1,259.66 1,314.91 1,315.05 1,320.88 1,331.8 1,334.48 1,366.76 1,386.81 1,408.92 1,618.44 1,757.85
              NI Labour T. Pakenham1.05%182240.14 552.26 670.06 677.06 723.3 724.44 727.42 757.33 738.57 860.69 867.43 882.73 1,242.63 1,366.79
              Republican Clubs John McAlea2.16%376376.76 384.24 385 433.86 434.37 435.93 440.35 446.91 515.49 517.33 585.17 971.62 1,029.61  
              Republican Clubs J. Boyle2.12%368398.02 533.34 568.3 627.66 653.16 653.86 661.66 671.64 673.79 779.83 803.97 847.81   
              Republican Clubs F. P. McGlade1.67%291292.9 296.3 296.3 340.54 341.56 343.26 346.68 348.82 451.24 457.64 547.92    
              Republican Labour Jim O'Kane1.11%193193.38 194.06 194.44 277.6 277.94 295.68 305.6 315 333.75 339.57     
              NI Labour Jack Sharkey0.76%132143.78 228.78 260.7 282.96 301.83 304.33 312.6 328.29 330.69      
              Republican Clubs D. O'Hare1.00%174174.38 177.78 177.78 198.22 198.9 200.16 205 206.7       
              Independent J. P. Rigby0.01%1316.42 81.7 108.3 112.08 122.62 122.76 154.57        
              Independent Moya Saunders0.03%5256.56 77.64 90.56 100.42 105.17 106.31         
              Republican Labour H. Scullion0.01%1919.38 20.06 20.44 31.64 31.64          
              Electorate: 29,530  Valid: 17,378 (58.85%)  Spoilt: 517  Quota: 2,483  Turnout: 17,895 (60.60%)  

                Area H

                1973: 5 x UUP, 1 x Alliance, 1 x SDLP

                Area H - 7 seats [2]
                PartyCandidateFPv%Count
                12345678910111213141516
                Ulster Unionist John Carson 22.24%5,518               
                Ulster Unionist Frank Millar 16.09%3,993               
                SDLP Thomas Donnelly10.75%2,6672,668.32 2,669.01 2,671.01 2,701.24 2,701.24 2,934.24 2,956.91 2,989.91 3,013.91 3,162.91     
                Alliance John Ferguson 9.15%2,2712,325.12 2,336.12 2,347.92 2,370.15 2,384.26 2,389.26 2,424.69 2,474.68 2,805.17 3,160.17     
                Ulster Unionist Myles Humphreys 7.80%1,9352,443.64 2,583.48 2,609.11 2,613.78 2,637.6 2,637.83 2,656.64 2,668.86 2,686.42 2,706.16 2,706.74 2,998.55 3,215.55  
                Ulster Unionist Mary Creighton2.94%7301,792.16 1,974.32 1,987.98 1,995.32 2,026.6 2,026.6 2,051.29 2,064.96 2,078.18 2,157.54 2,158.12 2,489.68 2,892.62 3,127.62 
                Ulster Unionist W. Shannon5.09%1,2631,471.56 1,585.41 1,592.28 1,598.11 1,616.52 1,616.52 1,622.98 1,631.53 1,640.64 1,648.08 1,648.08 1,908.68 2,187.26 2,291.6 2,359.61
                Ulster Unionist H. E. Smith5.02%1,2451,379.64 1,444.04 1,455.27 1,464.82 1,478.61 1,478.61 1,485.95 1,500.73 1,526.05 1,540.72 1,542.16 1,715.71 1,965.18 2,162.03 2,207.17
                Alliance Maureen McManus3.93%974980.16 981.31 983.31 1,003.31 1,010.75 1,013.75 1,027.19 1,075.19 1,406.39 1,566.17 1,621.85 1,638.53 1,657.53   
                Ulster Constitution Party David Riddelsdell3.90%9671,045.76 1,199.4 1,204.72 1,209.95 1,252.8 1,254.8 1,258.47 1,262.14 1,263.81 1,280.59 1,281.17 1,359.64    
                Ulster Unionist W. Lavery2.78%689967.96 1,132.64 1,141.22 1,146.22 1,157.4 1,157.63 1,168.22 1,185.46 1,195.79 1,218 1,219.16     
                NI Labour S. Barbour1.74%432442.56 446.01 448.01 456.01 456.01 474.01 602.58 905.73 923.17       
                Alliance Hannah Lantin2.82%700710.56 713.55 729.99 741.99 745.99 746.99 762.66 791.77        
                NI Labour Mary Simpson1.64%407416.68 420.82 420.82 441.28 441.95 452.95 544.5         
                NI Labour B. Boyd1.32%327341.96 350.93 351.93 367.81 372.81 379.81          
                Republican Labour B. Loughran1.12%277277 277.46 280.46 288.46 288.46           
                Ind. Unionist J. N. McCauley0.52%129148.36 160.32 181.47 184.47            
                Ulster Liberal R. A. Smith0.69%172175.96 178.72 180.72             
                Independent S. Daly0.47%115126.88 134.7              
                Electorate: 37,491  Valid: 24,811 (66.18%)  Spoilt: 333  Quota: 3,102  Turnout: 25,144 (67.07%)  

                  Related Research Articles

                  <span class="mw-page-title-main">Castle (District Electoral Area)</span> District Electoral Area in Belfast, Northern Ireland

                  Castle is one of the ten district electoral areas in Belfast, Northern Ireland. Located in the north of the city, the district elects six members to Belfast City Council and contains the wards of Bellevue, Cavehill, Chichester Park, Duncairn, Fortwilliam and Innisfayle. Castle, along with Oldpark district and parts of the Court district and Newtownabbey Borough Council, forms the Belfast North constituency for the Northern Ireland Assembly and UK Parliament. The district is bounded to the east by the Victoria Channel, to the north by Newtownabbey Borough Council and Belfast Lough, to the south by North Street and to the west by the Cavehill Road.

                  Area A was one of the eight district electoral areas (DEA) which existed in Belfast, Northern Ireland from 1973 to 1985. Located in the south-east of the city, the district elected seven members to Belfast City Council and contained the wards of Ballymacarrett; Ballynafeigh; Orangefield; Ormeau; Rosetta; The Mount and Willowfield. The DEA formed part of the Belfast South and Belfast East constituencies.

                  Area E was one of the eight district electoral areas (DEA) which existed in Belfast, Northern Ireland from 1973 to 1985. Located in the north-west of the city, the district elected six members to Belfast City Council and contained the wards of Ardoyne; Ballygomartin; Ballysillan; Highfield; Legoniel; and Woodvale. The DEA formed part of the Belfast North and Belfast West constituencies.

                  Area G was one of the eight district electoral areas (DEA) which existed in Belfast, Northern Ireland from 1973 to 1985. Covering Belfast city centre and the inner parts of the north and west of the city, the district elected six members to Belfast City Council and contained the wards of Central; Court; Crumlin; New Lodge; North Howard; and Shankill. The DEA formed part of the Belfast North and Belfast West constituencies.

                  Area H was one of the eight district electoral areas (DEA) which existed in Belfast, Northern Ireland from 1973 to 1985. Located in the north of the city, it covered the Antrim and Shore Road areas, together with parts of the Cliftonville area. The district elected seven members to Belfast City Council and contained the wards of Bellevue, Castleview; Cavehill, Cliftonville; Duncairn; Fortwilliam; and Grove. The DEA largely formed part of the Belfast North constituency.

                  <span class="mw-page-title-main">1973 Londonderry City Council election</span> Local govt election in Northern Ireland

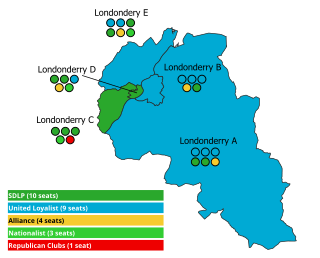
                  The 1973 Londonderry City Council election took place on 30 May 1973 to elect members of Londonderry City Council in Northern Ireland. This was on the same day as other Northern Irish local elections. The campaign was significant in that, following changes to the election process and districts, Irish nationalist parties were able to take control of the council for the first time.

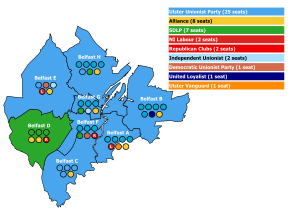
                  Elections to Belfast City Council were held on 19 May 1993 on the same day as the other Northern Irish local government elections. The election used nine district electoral areas to elect a total of 51 councillors, most representing the more heavily populated north and west.

                  Elections to Belfast City Council were held on 17 May 1989 on the same day as the other Northern Irish local government elections. The election used nine district electoral areas to elect a total of 51 councillors, most representing the more heavily populated north and west.

                  Elections to Belfast City Council were held on 15 May 1985 on the same day as the other Northern Irish local government elections. The election used nine district electoral areas to elect a total of 51 councillors, most representing the more heavily populated north and west.

                  Elections to Belfast City Council were held on 20 May 1981 on the same day as the other Northern Irish local government elections. The election used nine district electoral areas to elect a total of 51 councillors, most representing the more heavily populated north and west.

                  Elections to Belfast City Council were held on 18 May 1977 on the same day as the other Northern Irish local government elections. The election used nine district electoral areas to elect a total of 51 councillors, most representing the more heavily populated north and west.

                  Elections to Ards Borough Council were held on 20 May 1981 on the same day as the other Northern Irish local government elections. The election used three district electoral areas to elect a total of 17 councillors.

                  Elections to Ards Borough Council were held on 18 May 1977 on the same day as the other Northern Irish local government elections. The election used three district electoral areas to elect a total of 17 councillors.

                  Elections to Ards Borough Council were held on 30 May 1973 on the same day as the other Northern Irish local government elections. The election used three district electoral areas to elect a total of 17 councillors.

                  Elections to Larne Borough Council were held on 18 May 1977 on the same day as the other Northern Irish local government elections. The election used three district electoral areas to elect a total of 15 councillors.

                  Elections to Craigavon Borough Council were held on 18 May 1977 on the same day as the other Northern Irish local government elections. The election used four district electoral areas to elect a total of 25 councillors.

                  Elections to Newry and Mourne District Council were held on 18 May 1977 on the same day as the other Northern Irish local government elections. The election used six district electoral areas to elect a total of 30 councillors.

                  Elections to Magherafelt District Council were held on 18 May 1977 on the same day as the other Northern Irish local government elections. The election used three district electoral areas to elect a total of 15 councillors.

                  Elections to Cookstown District Council were held on 18 May 1977 on the same day as the other Northern Irish local government elections. The election used three district electoral areas to elect a total of 15 councillors.

                  Elections to Londonderry City Council were held on 18 May 1977 on the same day as the other Northern Irish local government elections. The election used five district electoral areas to elect a total of 27 councillors.

                  References

                  1. 1 2 "Local Government Elections 1973 - 1981: Belfast" . Retrieved 8 July 2021.
                  2. 1 2 3 4 5 6 7 8 "Local Government Results 1973". EONI. Retrieved 8 July 2021.