1973 Merseyside County Council election

Last updated
1973 Merseyside County Council election
Merseyside CoA.svg
12 April 1973 (1973-04-12) 1977  

All 99 seats
to Merseyside County Council
50 seats needed for a majority
Turnout36.7% [1]
 First partySecond partyThird party
 
No image wide.svg
No image wide.svg
No image wide.svg
Party Labour Conservative Liberal
Seats won532619
Popular vote175,475143,34492,524
Percentage41.3%33.7%21.8%

1973 Merseyside County Council election result map.jpg
Map of Merseyside County Council showing wards won by party [2]

Control of Council after election

Labour

The 1973 Merseyside County Council election took place on 12 April 1973 to elect members of Merseyside County Council in England. [1] This was on the same day as other local elections.

Contents

There were 95 wards electing the 99 members between them. [1] Two wards, (both in Wirral), were uncontested.

Election results

Overall election result

New Council.

Merseyside County Council election results, 1973
PartyCandidatesVotes
StoodElected % of total %
Labour 945353.541.3175,475
Conservative 942626.333.7143,344
Liberal 521919.221.892,524
Residents 611.01.97,996
Communist 1800.00.72,978
Tenants100.00.31,184
Independent 200.00.2872
Ind. Conservative 200.00.1397
Save100.00.1268

[1]

Results by borough

Knowsley borough

Merseyside County Council election results, 1973 (Knowsley)
PartyCandidatesVotes
StoodElected % of total %
Labour 111090.961.324,218
Conservative 1019.125.29,954
Liberal 600.011.54,541
Communist 700.02.0778

[1]

Turnout: 31.5%

Liverpool borough

Merseyside County Council election results, 1973 (Liverpool)
PartyCandidatesVotes
StoodElected % of total %
Labour 361850.040.058,840
Liberal 211438.929.443,285
Conservative 36411.129.142,772
Ten100.00.81,184
Communist 400.00.4622
Save100.00.2268
Independent 100.00.174

[1]

Turnout: 34.4%

Sefton borough

Merseyside County Council election results, 1973 (Sefton)
PartyCandidatesVotes
StoodElected % of total %
Conservative 191157.942.836,642
Labour 16631.630.726,245
Liberal 815.315.513,279
Residents 515.39.07,704
Communist 500.01.1902
Independent 100.00.9798

[1]

Turnout: 40.0%

St Helens borough

Merseyside County Council election results, 1973 (St Helens)
PartyCandidatesVotes
StoodElected % of total %
Labour 11981.856.126,428
Conservative 7218.227.913,154
Liberal 400.015.07,045
Communist 100.01.0485

[1]

Turnout: 34.4%

Wirral borough

Merseyside County Council election results, 1973 (Wirral)
PartyCandidatesVotes
StoodElected % of total %
Conservative 22836.438.640,822
Labour 201045.537.639,744
Liberal 13418.223.024,374
Ind. Conservative 200.00.4397
Residents 100.00.3292
Communist 100.00.2191

[1]

Turnout: 41.1%

Ward results

Knowsley

Huyton With Roby No. 1 (Huyton Farm-Princess-Woolfall)

Huyton Farm-Princess-Woolfall
PartyCandidateVotes%±%
Labour P. Longworth 2,139 83.0 N/A
Conservative L. Bottley35313.7N/A
Communist H. Moss843.3N/A
Majority1,78669.3N/A
Registered electors 9,813
Turnout 26.3N/A
Labour win (new seat)

[3]

Huyton With Roby No. 2 (Longview and Rupert Farm)

Longview and Rupert Farm
PartyCandidateVotes%±%
Labour S. Hughes 1,824 51.9 N/A
Liberal C. Lister83523.7N/A
Conservative R. Lockett78322.3N/A
Communist W. Hennessey742.1N/A
Majority98928.2N/A
Registered electors 9,459
Turnout 37.2N/A
Labour win (new seat)

[3]

Huyton With Roby No. 3 (St Agnes-St Bartholomews-Swanside)

St Agnes-St Bartholomews-Swanside
PartyCandidateVotes%±%
Conservative H. Swainbank 2,660 44.9 N/A
Labour M. Spillane2,00533.8N/A
Liberal B. Martin1,21020.4N/A
Communist R. Leyland550.9N/A
Majority65511.1N/A
Registered electors 13,273
Turnout 44.7N/A
Conservative win (new seat)

[3]

Huyton With Roby No. 4 (St Gabriels and St Michaels)

St Gabriels and St Michaels
PartyCandidateVotes%±%
Labour S. Powell 2,464 65.1 N/A
Conservative F. Kearns84822.4N/A
Liberal A. Murray38910.3N/A
Communist W. Bell822.2N/A
Majority1,61642.7N/A
Registered electors 11,198
Turnout 33.8N/A
Labour win (new seat)

[3]

Kirkby No. 1 (Central and Minstead)

Central and Minstead
PartyCandidateVotes%±%
Labour J. King 1,782 66.7 N/A
Liberal A. Dutton76128.5N/A
Communist S. Donnelly1304.9N/A
Majority1,02138.2N/A
Registered electors 10,832
Turnout 24.7N/A
Labour win (new seat)

[3]

Kirkby No. 2 (Cherryfield and Whitfield)

Cherryfield and Whitfield
PartyCandidateVotes%±%
Labour D. Smith 1,381 53.3 N/A
Liberal T. Jones1,00438.7N/A
Conservative S. Hennessy1054.1N/A
Communist P. Cunningham1013.9N/A
Majority37714.6N/A
Registered electors 11,339
Turnout 22.9N/A
Labour win (new seat)

[3]

Kirkby No. 3 (Northwood-Park-Tower Hill-Simonswood)

Northwood-Park-Tower Hill-Simonswood
PartyCandidateVotes%±%
Labour G. Bundred 2,164 72.6 N/A
Conservative A. Dray56519.0N/A
Communist T. Bradburn2528.5N/A
Majority1,59953.6N/A
Registered electors 14,372
Turnout 20.7N/A
Labour win (new seat)

[3]

Prescot

Prescot
PartyCandidateVotes%±%
Labour W. Howarth 2,360 61.2 N/A
Conservative F. Granby1,49438.8N/A
Majority86622.4N/A
Registered electors 9,035
Turnout 42.7N/A
Labour win (new seat)

[3]

Whiston No. 1 (Croton-Tarbock-Whiston)

Croton-Tarbock-Whiston
PartyCandidateVotes%±%
Labour R. Foulkes 2,266 65.6 N/A
Conservative J. Reynolds1,18934.4N/A
Majority1,07731.2N/A
Registered electors 9,924
Turnout 34.8N/A
Labour win (new seat)

[3]

Whiston No. 3 (Halewood)

Halewood
PartyCandidateVotes%±%
Labour T. Lyons 3,380 72.4 N/A
Conservative B. Holder1,28927.6N/A
Majority2,09144.8N/A
Registered electors 13,617
Turnout 34.3N/A
Labour win (new seat)

[3]

Whiston No. 4 (Knowsley)

Knowsley
PartyCandidateVotes%±%
Labour W. Alldritt 2,453 70.8 N/A
Conservative W. Simpson66819.3N/A
Liberal M. Traynor3429.9N/A
Majority1,78551.5N/A
Registered electors 12,510
Turnout 27.7N/A
Labour win (new seat)

[3]

Liverpool

Liverpool No. 1 (Abercromby and St James)

Abercromby and St James
PartyCandidateVotes%±%
Labour H. Carr 2,432 79.1 N/A
Conservative E. Smith36411.8N/A
Communist R. O'Hara2809.1N/A
Majority2,06867.3N/A
Registered electors 13,507
Turnout 22.8N/A
Labour win (new seat)

[3]

Liverpool No. 2 (Aigburth)

Aigburth
PartyCandidateVotes%±%
Conservative S. Moss 4,162 78.8 N/A
Labour K. Stewart1,12021.2N/A
Majority3,04257.6N/A
Registered electors 14,688
Turnout 36.0N/A
Conservative win (new seat)

[3]

Liverpool No. 3 (Allerton)

Allerton
PartyCandidateVotes%±%
Conservative W. Weaver 2,325 55.2 N/A
Liberal S. Carr1,18328.1N/A
Labour C. McDonald70516.7N/A
Majority1,14227.1N/A
Registered electors 10,856
Turnout 38.8N/A
Conservative win (new seat)

[3]

Liverpool No. 4 (Anfield)

Anfield
PartyCandidateVotes%±%
Labour F. McGurk 2,018 38.7 N/A
Liberal J. Wilmington1,73933.4N/A
Conservative L. Jones1,45727.9N/A
Majority2795.3N/A
Registered electors 13,161
Turnout 39.6N/A
Labour win (new seat)

[3]

Liverpool No. 5 (Arundel)

Arundel
PartyCandidateVotes%±%
Liberal N. Wood 2,815 58.3 N/A
Conservative J. Kendrick1,04221.6N/A
Labour F. Gaier97320.1N/A
Majority1,77336.7N/A
Registered electors 14,434
Turnout 33.5N/A
Liberal win (new seat)

[3]

Liverpool No. 6 (Breckfield and St Domingo)

Breckfield and St Domingo
PartyCandidateVotes%±%
Liberal P. Chivall 1,551 45.8 N/A
Labour L. Williams1,20735.7N/A
Conservative K. Jacques62618.5N/A
Majority34410.1N/A
Registered electors 11,443
Turnout 29.6N/A
Liberal win (new seat)

[3]

Liverpool No. 7 (Broadgreen)

Broadgreen
PartyCandidateVotes%±%
Liberal R. Johnston 911 17.7 N/A
Conservative L. Sanders1,05120.4N/A
Labour B. Wright318661.9N/A
Majority2,13541.5N/A
Registered electors 12,358
Turnout 41.7N/A
Labour win (new seat)

[3]

Liverpool No. 8 (Central Everton and Netherfield)

Central Everton and Netherfield
PartyCandidateVotes%±%
Labour J. Parry 2,169 75.9 N/A
Conservative R. Charles42114.7N/A
SaveA. Dooley2689.4N/A
Majority1,74861.2N/A
Registered electors 12,362
Turnout 23.1N/A
Labour win (new seat)

[3]

Liverpool No. 9 (Childwall)

Childwall (2)
PartyCandidateVotes%±%
Liberal W. Limont 4,289 51.7 N/A
Liberal W. Smyth 3,807
Conservative C. Henry De Boer2,96335.7N/A
Conservative D. Bushell2,885
Labour L. Caplan1,04712.6N/A
Labour E. Kelly955
Majority1,33516.0N/A
Registered electors 19,102
Turnout 43.4N/A
Liberal win (new seat)

[3]

Liverpool No. 10 (Church)

Church
PartyCandidateVotes%±%
Liberal Cyril Carr 4,154 63.0 N/A
Conservative H. Bolton-Jones2,03730.9N/A
Labour N. Barnett4006.1N/A
Majority2,11732.1N/A
Registered electors 14,436
Turnout 45.7N/A
Liberal win (new seat)

[3]

Liverpool No. 11 (Clubmoor)

Clubmoor
PartyCandidateVotes%±%
Liberal J. Bowen 2,069 41.9 N/A
Labour M. Stewart1,76035.6N/A
Conservative J. Jones1,11022.5N/A
Majority3096.3N/A
Registered electors 10,800
Turnout 45.7N/A
Liberal win (new seat)

[3]

Liverpool No. 12 (County)

County
PartyCandidateVotes%±%
Labour J. McLean 2,414 59.1 N/A
Conservative P. Tunna1,66940.9N/A
Majority74518.2N/A
Registered electors 12,602
Turnout 32.4N/A
Labour win (new seat)

[3]

Liverpool No. 13 (Croxteth)

Croxteth
PartyCandidateVotes%±%
Liberal G. Holmes 3,800 60.2 N/A
Conservative R. Amyes1,62425.7N/A
Labour D. Cowley88514.0N/A
Majority2,17634.5N/A
Registered electors 12,667
Turnout 49.8N/A
Liberal win (new seat)

[3]

Liverpool No. 14 (Dingle)

Dingle
PartyCandidateVotes%±%
Labour M. Evans 1,479 64.1 N/A
Conservative R. Jones40417.5N/A
Liberal C. Stocker34514.9N/A
Communist J. Cook803.5N/A
Majority1,07546.6N/A
Registered electors 7,597
Turnout 30.4N/A
Labour win (new seat)

[3]

Liverpool No. 15 (Dovecot)

Dovecot
PartyCandidateVotes%±%
Labour W. Burke 3,043 68.2 N/A
Conservative J. Walsh1,41831.8N/A
Majority1,62536.4N/A
Registered electors 16,342
Turnout 31.1N/A
Labour win (new seat)

[3]

Liverpool No. 16 (Fairfield)

Fairfield
PartyCandidateVotes%±%
Liberal C. Crawford 1,598 41.9 N/A
Labour H. Livermore1,38436.3N/A
Conservative W. Scott82821.7N/A
Majority2145.6N/A
Registered electors 10,856
Turnout 35.1N/A
Liberal win (new seat)

[3]

Liverpool No. 17 (Fazakerley)

Fazakerley
PartyCandidateVotes%±%
Labour A. Williams 2,294 57.0 N/A
Conservative A. Lloyd1,73143.0N/A
Majority56214.0N/A
Registered electors 11,774
Turnout 34.2N/A
Labour win (new seat)

[3]

Liverpool No. 18 (Gillmoss)

Gillmoss (2)
PartyCandidateVotes%±%
Labour Edward Loyden 3,784 78.4 N/A
Labour T. Higgins 3,625
Conservative D. Dougherty1,04221.6N/A
Conservative W. Henri934
Majority2,74256.8N/A
Registered electors 20,068
Turnout 24.0N/A
Labour win (new seat)

[3]

Liverpool No. 19 (Granby and Princes Park)

Granby and Princes Park
PartyCandidateVotes%±%
Labour Margaret Simey 2,675 68.2 N/A
Conservative O. Hughes1,04626.7N/A
Communist T. McClelland2035.2N/A
Majority1,62941.5N/A
Registered electors 15,485
Turnout 25.3N/A
Labour win (new seat)

[3]

Liverpool No. 20 (Kensington)

Kensington
PartyCandidateVotes%±%
Liberal J. Watton 2,221 58.8 N/A
Labour Robert Wareing 1,20731.9N/A
Conservative S. Kudrycz3529.3N/A
Majority1,01426.9N/A
Registered electors 9,438
Turnout 40.1N/A
Liberal win (new seat)

[3]

Liverpool No. 21 (Low Hill and Smithdown)

Low Hill and Smithdown
PartyCandidateVotes%±%
Liberal David Alton 2,282 69.7 N/A
Labour H. Lee85426.1N/A
Conservative T. Wingate1394.2N/A
Majority1,42843.6N/A
Registered electors 9,774
Turnout 33.5N/A
Liberal win (new seat)

[3]

Liverpool No. 22 (Melrose and Westminster)

Melrose and Westminster
PartyCandidateVotes%±%
Labour B. Shaw 2,369 72.8 N/A
Conservative J. Gillin88527.2N/A
Majority1,48445.6N/A
Registered electors 11,283
Turnout 28.8N/A
Labour win (new seat)

[3]

Liverpool No. 23 (Old Swan)

Old Swan
PartyCandidateVotes%±%
Liberal D. Jones 3,266 55.9 N/A
Labour J. Walker1,50525.7N/A
Conservative H. Davies1,00017.1N/A
Independent W. McCullough741.3N/A
Majority1,76130.2N/A
Registered electors 13,442
Turnout 43.5N/A
Liberal win (new seat)

[3]

Liverpool No. 24 (Picton)

Picton
PartyCandidateVotes%±%
Liberal P. Mahon 2,260 48.9 N/A
Labour A. Fletcher1,59234.5N/A
Conservative H. Davies76916.6N/A
Majority66814.4N/A
Registered electors 12,225
Turnout 37.8N/A
Liberal win (new seat)

[3]

Liverpool No. 25 (Pirrie)

Pirrie
PartyCandidateVotes%±%
Labour H. Dalton 3,638 67.9 N/A
Conservative R. Gould1,71832.1N/A
Majority1,92035.8N/A
Registered electors 16,059
Turnout 33.4N/A
Labour win (new seat)

[3]

Liverpool No. 26 (St Marys)

St Marys
PartyCandidateVotes%±%
Labour G. Maudsley 2,155 61.0 N/A
Conservative G. Hadley1,37539.0N/A
Majority78022.0N/A
Registered electors 10,105
Turnout 34.9N/A
Labour win (new seat)

[3]

Liverpool No. 27 (St Michaels)

St Michaels
PartyCandidateVotes%±%
Liberal Trevor Jones 2,442 61.3 N/A
Conservative C. Cowlin89322.4N/A
Labour R. Graham58914.8N/A
Communist F. Hennessey591.5N/A
Majority1,54938.9N/A
Registered electors 10,693
Turnout 37.2N/A
Liberal win (new seat)

[3]

Liverpool No. 28 (Sandhills and Vauxhall)

Sandhills and Vauxhall
PartyCandidateVotes%±%
Labour W. Sefton 1,760 55.9 N/A
TenantsJ. Stroud1,18437.6N/A
Conservative P. Rankin2026.4N/A
Majority57618.3N/A
Registered electors 10,501
Turnout 30.0N/A
Labour win (new seat)

[3]

Liverpool No. 29 (Speke)

Speke
PartyCandidateVotes%±%
Labour Kenneth Stewart 3,010 75.2 N/A
Conservative D. Collister99224.8N/A
Majority2,01850.4N/A
Registered electors 14,808
Turnout 27.0N/A
Labour win (new seat)

[3]

Liverpool No. 30 (Tuebrook)

Tuebrook
PartyCandidateVotes%±%
Labour J. Roberts 1,529 38.0 N/A
Liberal W. Galbraith1,36233.8N/A
Conservative D. Daniel1,13428.2N/A
Majority1674.2N/A
Registered electors 11,678
Turnout 34.5N/A
Labour win (new seat)

[3]

Liverpool No. 31 (Warbreck)

Warbreck
PartyCandidateVotes%±%
Labour J. Finnegan 1,957 51.9 N/A
Conservative R. Flude1,81248.1N/A
Majority1453.8N/A
Registered electors 12,195
Turnout 30.9N/A
Labour win (new seat)

[3]

Liverpool No. 32 (Woolton East)

Woolton East
PartyCandidateVotes%±%
Labour L. Evans 2,820 74.4 N/A
Conservative N. Derrick50813.4N/A
Liberal J. Moxon46112.2N/A
Majority2,31261.0N/A
Registered electors 13,002
Turnout 29.1N/A
Labour win (new seat)

[3]

Liverpool No. 33 (Woolton West)

Woolton West (2)
PartyCandidateVotes%±%
Conservative L. Williams 3,673 51.8 N/A
Conservative T. Hobday 3,628
Liberal W. Mellor2,26231.9N/A
Liberal E. Reynolds2,063
Labour K. Jones1,15516.3N/A
Labour J. Changer1,096
Majority1,41119.9N/A
Registered electors 17,839
Turnout 39.7N/A
Conservative win (new seat)

[3]

Sefton

Bootle No. 1 (Derby & Stanley)

Bootle No. 1 (Derby & Stanley)
PartyCandidateVotes%±%
Labour Hugh Baird 2,461 60.0 N/A
Conservative F. Morris1,50826.7N/A
Communist A. Watts1353.3N/A
Majority95323.3N/A
Registered electors 13,240
Turnout 31.0N/A
Labour win (new seat)

[3]

Bootle No. 2 (Linacre and Mersey)

Linacre and Mersey
PartyCandidateVotes%±%
Labour W. Wiseman 2,103 70.5 N/A
Conservative R. Rogerson68723.0N/A
Communist J. Byrne1926.4N/A
Majority1,41647.5N/A
Registered electors 11,509
Turnout 25.9N/A
Labour win (new seat)

[3]

Bootle No. 3 (Netherton-Orrell-Sefton)

Netherton-Orrell-Sefton (2)
PartyCandidateVotes%±%
Labour B. Hillen 4,028 60.3 N/A
Labour A. Weston 3,906
Conservative G. Halliwell2,26133.8N/A
Conservative J. Borrows2,147
Communist R. Morris3955.9N/A
Communist T. Fenn341
Majority1,76726.5N/A
Registered electors 24,169
Turnout 27.7N/A
Labour win (new seat)

[3]

Crosby No. 1 (Central-College-St Johns)

Central-College-St Johns
PartyCandidateVotes%±%
Conservative N. Goldrein 2,309 44.2 N/A
Residents J. Connell1,95337.4N/A
Labour M. Kelly96418.4N/A
Majority3566.8N/A
Registered electors 12,423
Turnout 42.1N/A
Conservative win (new seat)

[3]

Crosby No. 2 (Christchurch-St Marys-St Thomas)

Christchurch-St Marys-St Thomas
PartyCandidateVotes%±%
Labour L. Hyam 1,683 43.3 N/A
Liberal H. Fjortoft1,11828.2N/A
Conservative J. Atherton1,08227.9N/A
Majority56514.5N/A
Registered electors 10,731
Turnout 36.2N/A
Labour win (new seat)

[3]

Crosby No. 3 (East and Little Crosby)

Crosby No. 3 (East and Little Crosby)
PartyCandidateVotes%±%
Residents A. Tickle 1,607 40.3 N/A
Conservative W. Bennett1,47237.0N/A
Labour J. Jones90422.7N/A
Majority1353.3N/A
Registered electors 9,676
Turnout 41.2N/A
Residents win (new seat)

[3]

Crosby No. 4 (North and West)

Crosby No. 4 (North and West)
PartyCandidateVotes%±%
Conservative F. Prichard 2,827 58.2 N/A
Liberal M. Hill2,03441.8N/A
Majority79316.4N/A
Registered electors 9,075
Turnout 53.6N/A
Conservative win (new seat)

[3]

Formby

Formby
PartyCandidateVotes%±%
Conservative K. Thompson 4,691 74.9 N/A
Labour A. Riley1,57525.1N/A
Majority3,11649.8N/A
Registered electors 16,537
Turnout 37.9N/A
Conservative win (new seat)

[3]

Litherland

Litherland
PartyCandidateVotes%±%
Labour O. Brady 3,575 58.1 N/A
Conservative R. Lloyd2,40139.0N/A
Communist A. Wenton1802.9N/A
Majority1,17419.1N/A
Registered electors 16,515
Turnout 37.3N/A
Labour win (new seat)

[3]

Southport No. 1 (Ainsdale-Birkdale South)

Ainsdale-Birkdale South
PartyCandidateVotes%±%
Conservative J. Hartley 2,527 48.0 N/A
Liberal W. Corlett1,99437.9N/A
Labour J. Entwistle74314.1N/A
Majority53310.1N/A
Registered electors 13,418
Turnout 39.2N/A
Conservative win (new seat)

[3]

Southport No. 2 (Birkdale East-Birkdale North-South)

Southport No. 2 (Birkdale East-Birkdale North-South)
PartyCandidateVotes%±%
Conservative H. Martland 1,754 38.2 N/A
Labour J. Corcoran1,59534.8N/A
Liberal J. McCabe1,24027.0N/A
Majority1593.4N/A
Registered electors 11,286
Turnout 40.7N/A
Conservative win (new seat)

[3]

Southport No. 3 (Central-Birkdale West-West)

Southport No. 3 (Central-Birkdale West-West)
PartyCandidateVotes%±%
Conservative J. Simms Mitchell 1,726 63.7 N/A
Liberal D. Collins98536.3N/A
Majority74127.4N/A
Registered electors 9,023
Turnout 30.0N/A
Conservative win (new seat)

[3]

Southport No. 4 (Craven-Sussex-Talbot)

Southport No. 4 (Craven-Sussex-Talbot)
PartyCandidateVotes%±%
Liberal Ronald Fearn 2,510 48.1 N/A
Conservative B. Pogson1,42427.3N/A
Labour K. McNeany1,28624.6N/A
Majority1,08620.8N/A
Registered electors 11,406
Turnout 45.8N/A
Liberal win (new seat)

[3]

Southport No. 5 (Hesketh and Scarisbrick)

Southport No. 5 (Hesketh and Scarisbrick)
PartyCandidateVotes%±%
Conservative J. Leech 2,484 43.8 N/A
Liberal P. Handley1,77331.3N/A
Labour M. Auger1,40824.9N/A
Majority71112.5N/A
Registered electors 10,525
Turnout 53.8N/A
Conservative win (new seat)

[3]

Southport No. 6 (Marine & Park)

Southport No. 6 (Marine and Park)
PartyCandidateVotes%±%
Conservative G. Walton 2,150 57.0 N/A
Liberal C. Jackson1,62543.0N/A
Majority52514.0N/A
Registered electors 10,436
Turnout 36.2N/A
Conservative win (new seat)

[3]

West Lancashire No. 1 (Aintree)

Aintree
PartyCandidateVotes%±%
Conservative A. Birch 1,905 43.3 N/A
Residents F. Deeks1,48733.8N/A
Labour I. James1,00922.9N/A
Majority4189.5N/A
Registered electors 9,367
Turnout 47.0N/A
Conservative win (new seat)

[3]

West Lancashire No. 2 (Maghull East and North-Melling)

West Lancashire No. 2 (Maghull East and North-Melling)
PartyCandidateVotes%±%
Conservative C. Currall 1,915 32.2 N/A
Labour J. Howard1,83130.8N/A
Residents J. Geddes1,40823.7N/A
Independent L. Hancock79813.4N/A
Majority841.4N/A
Registered electors 13,100
Turnout 45.4N/A
Conservative win (new seat)

[3]

West Lancashire No. 3 (Maghull South & West-Melling)

Aintree
PartyCandidateVotes%±%
Conservative F. Dykins 1,519 39.5 N/A
Residents P. Nield1,24932.5N/A
Labour W. Marshall1,08028.1N/A
Majority2707.0N/A
Registered electors 9,200
Turnout 41.8N/A
Conservative win (new seat)

[3]

St Helens

Haydock

Haydock
PartyCandidateVotes%±%
Labour R. Finney 2,926 83.8 N/A
Conservative B. Chapman56716.2N/A
Majority2,35967.6N/A
Registered electors 11,022
Turnout 31.7N/A
Labour win (new seat)

[3]

Newton-Le-Willows

Newton-Le-Willows
PartyCandidateVotes%±%
Labour O. Conheeney 3,874 52.1 N/A
Liberal A. St Leger Sherlock3,56147.9N/A
Majority3134.2N/A
Registered electors 16,022
Turnout 46.4N/A
Labour win (new seat)

[3]

Rainford

Rainford
PartyCandidateVotes%±%
Conservative A. Berry 3,167 53.5 N/A
Labour A. Bentham2,75146.5N/A
Majority4167.0N/A
Registered electors 14,053
Turnout 42.1N/A
Conservative win (new seat)

[3]

St. Helens No. 1 (Central and South Eccleston)

St. Helens No. 1 (Central and South Eccleston)
PartyCandidateVotes%±%
Labour W. Williams 1,801 47.6 N/A
Conservative J. Hand1,37136.2N/A
Liberal W. Wagstaff61116.2N/A
Majority43011.4N/A
Registered electors 10,259
Turnout 36.9N/A
Labour win (new seat)

[3]

St. Helens No. 2 (East Sutton)

East Sutton
PartyCandidateVotes%±%
Labour T. Harvey 2,005 59.5 N/A
Liberal A. Lycott1,36740.5N/A
Majority63819.0N/A
Registered electors 11,760
Turnout 28.7N/A
Labour win (new seat)

[3]

St. Helens No. 3 (Hardshaw and West Sutton)

St. Helens No. 3(Hardshaw and West Sutton)
PartyCandidateVotes%±%
Labour H. Rimmer 2,793 65.0 N/A
Liberal N. Benbow1,50635.0N/A
Majority1,28730.0N/A
Registered electors 15,565
Turnout 27.7N/A
Labour win (new seat)

[3]

St. Helens No. 4 (Moss Bank and North Windle)

St. Helens No. 4 (Moss Bank and North Windle)
PartyCandidateVotes%±%
Labour J. Morris 2,407 52.0 N/A
Conservative C. Martin2,22448.0N/A
Majority1834.0N/A
Registered electors 13,452
Turnout 4,63134.4N/A
Labour win (new seat)

[3]

St. Helens No. 5 (North Eccleston and South Windle)

North Eccleston and South Windle
PartyCandidateVotes%±%
Labour T. Forshaw 1,465 59.7 N/A
Conservative F. Penketh98940.3N/A
Majority47619.4N/A
Registered electors 8,471
Turnout 29.0N/A
Labour win (new seat)

[3]

St. Helens No. 6 (Parr)

St. Helens No. 6 (Parr)
PartyCandidateVotes%±%
Labour F. Mernagh 3,226 86.9 N/A
Communist P. Lenahan48513.1N/A
Majority2,74173.8N/A
Registered electors 16,313
Turnout 22.7N/A
Labour win (new seat)

[3]

Whiston No. 2 (Eccleston and Windle)

Whiston No. 2 (Eccleston and Windle)
PartyCandidateVotes%±%
Conservative G. Brownlow 2,819 73.4% N/A
Labour R. Bishop1,02426.6N/A
Majority1,79546.8%N/A
Registered electors 9,404
Turnout 3,84640.9%N/A
Rejected ballots3
Conservative win (new seat)

[3]

Whiston No. 5 (Rainhill and Bold)

Whiston No. 5 (Rainhill and Bold)
PartyCandidateVotes%±%
Labour W. Jones 2,156 51.7 N/A
Conservative N. Holley2,01748.3N/A
Majority1393.4N/A
Registered electors 10,497
Turnout 4,17339.8N/A
Labour win (new seat)

[3]

Wirral

Bebington No. 1 (Higher Bebington and Woodhey)

Bebington No. 1 (Higher Bebington and Woodhey)
PartyCandidateVotes%±%
Conservative H. Harriman 2,927 49.8 N/A
Labour W. Jones1,83431.2N/A
Liberal A. Snedker1,11819.0N/A
Majority1,09318.6N/A
Registered electors 10,279
Turnout 57.2N/A
Conservative win (new seat)

[3]

Bebington No. 2 (Park, New Ferry, North Bromborough)

Bebington No. 2 (Park, New Ferry, North Bromborough
PartyCandidateVotes%±%
Labour B. Bryning 3,087 65.9 N/A
Conservative G. Drew1,59434.1N/A
Majority1,49331.8N/A
Registered electors 9,776
Turnout 4,68147.9N/A
Labour win (new seat)

[3]

Bebington No. 3 (South Bromborough and Eastham)

South Bromborough and Eastham
PartyCandidateVotes%±%
Labour A. Rose 3,061 44.6 N/A
Conservative D. Allan2,27833.2N/A
Liberal Phillip Gilchrist1,52722.2N/A
Majority78311.4N/A
Registered electors 12,857
Turnout 6,86653.4%N/A
Labour win (new seat)

[3]

Bebington No. 4 (Lower Bebington and Poulton)

Bebington No. 4 (Lower Bebington and Poulton)
PartyCandidateVotes%±%
Conservative F. Williams 3,118 47.3 N/A
Liberal Thomas Harney1,73726.4N/A
Labour A. Radcliffe1,73226.3N/A
Majority1,38120.9N/A
Registered electors 12,002
Turnout 6,58754.9N/A
Conservative win (new seat)

[3]

Birkenhead No. 1 (Argyle-Clifton-Holt)

Birkenhead No. 1 (Argyle-Clifton-Holt)
PartyCandidateVotes%±%
Labour J. Stuart-Cole 2,120 70.6 N/A
Conservative R. Peers88329.4N/A
Majority1,23741.2N/A
Registered electors 8,985
Turnout 3,00333.4N/A
Labour win (new seat)

[3]

Birkenhead No. 2 (Bebington and Mersey)

Birkenhead No. 2 (Bebington and Mersey)
PartyCandidateVotes%±%
Labour C. McRonald 2,010 63.0 N/A
Conservative M. Winter1,18237.0N/A
Majority82826.0N/A
Registered electors 8,707
Turnout 3,19236.7N/A
Labour win (new seat)

[3]

Birkenhead No. 3 (Cathcart-Claughton-Cleveland)

Birkenhead No. 3 (Cathcart-Claughton-Cleveland)
PartyCandidateVotes%±%
Liberal David Griffith Evans 2,521 50.1% N/A
Labour J. McDougall1,47129.2%N/A
Conservative R. Stretch1,04020.7%N/A
Majority1,05020.9N/A
Registered electors 9,993
Turnout 5,03250.4N/A
Liberal win (new seat)

[3]

Birkenhead No. 4 (Devonshire and Egerton)

Birkenhead No. 4 (Devonshire and Egerton)
PartyCandidateVotes%±%
Liberal D. Hughes 3,067 50.1 N/A
Conservative H. Welsh1,54225.2N/A
Labour W. Bagnall1,51424.7N/A
Majority1,52524.9N/A
Registered electors 12,464
Turnout 49.1N/A
Liberal win (new seat)

[3]

Birkenhead No. 5 (Gilbrook and St James)

Birkenhead No. 5 (Gilbrook and St James)
PartyCandidateVotes%±%
Labour J. Roberts 2,242 59.5 N/A
Liberal A. Hayes1,10629.3N/A
Conservative W. Briggs42111.2N/A
Majority1,13630.2N/A
Registered electors 9,030
Turnout 3,76641.7%N/A
Labour win (new seat)

[3]

Birkenhead No. 6 (Grange and Oxton)

Birkenhead No. 6 (Grange and Oxton)
PartyCandidateVotes%±%
Liberal Gordon Lindsay 3,075 52.5 N/A
Conservative Kenneth Porter1,68728.8N/A
Labour Arthur Smith1,10018.8N/A
Majority1,38823.7N/A
Registered electors 12,348
Turnout 47.5N/A
Liberal win (new seat)

[3]

Birkenhead No. 7 (Prenton)

Birkenhead No. 7 (Prenton)
PartyCandidateVotes%±%
Conservative A. Wise 3,422 53.4 N/A
Labour G. Llewellyn2,99146.6N/A
Majority4316.8N/A
Registered electors 15,882
Turnout 6,43340.4N/A
Conservative win (new seat)

[3]

Birkenhead No. 8 (Upton)

Birkenhead No. 8 (Upton)
PartyCandidateVotes%±%
Labour E. Ainslie 3,687 51.1 N/A
Conservative J. Nixon3,04442.2N/A
Residents S. Dean2924.0N/A
Communist K. Thompson1912.6N/A
Majority6438.9N/A
Registered electors 19,861
Turnout 7,21436.3N/A
Labour win (new seat)

[3]

Hoylake No.1 (Caldy and Frankby)

Hoylake No.1 (Caldy and Frankby)
PartyCandidateVotes%±%
Conservative H. NeedhamUnopposed
Registered electors 12,684
Conservative win (new seat)

[3]

Hoylake No.2 (Central-Hoose-Meols-Park)

Hoylake No. 2 (Central-Hoose-Meols-Park)
PartyCandidateVotes%±%
Conservative J. LastUnopposed
Registered electors 11,992
Conservative win (new seat)

[3]

Wallasey No.1 (Leasowe)

Wallasey No.1 (Leasowe)
PartyCandidateVotes%±%
Labour C. Wells 2,507 59.6 N/A
Conservative G. Ward1,09426.0N/A
Liberal D. Franks60414.4N/A
Majority1,41333.6N/A
Registered electors 11,464
Turnout 4,28536.7%N/A
Labour win (new seat)

[3]

Wallasey No. 2 (Marlowe, Egremont South & Liscard)

Wallasey No.2 (Marlowe, Egremont South & Liscard)
PartyCandidateVotes%±%
Labour E. Roberts 2,106 40.0% N/A
Conservative F. Elliot2,10439.9%N/A
Liberal Neil Thomas1,05820.1N/A
Majority20.1%N/A
Registered electors 13,155
Turnout 5,26840.0%N/A
Labour win (new seat)

[3]

Wallasey No. 3 (Moreton and Saughall Massie)

Wallasey No. 3 (Moreton and Saughall Massie)
PartyCandidateVotes%±%
Labour C. Allman 1,556 49.6 N/A
Conservative David Williams1,09434.9%N/A
Liberal E. Lawrence48615.5%N/A
Majority46214.7%N/A
Registered electors 7,070
Turnout 3,13644.4%N/A
Labour win (new seat)

[3]

Wallasey No. 4 (New Brighton-Wallasey-Warren)

Wallasey No. 4 (New Brighton-Wallasey-Warren)
PartyCandidateVotes%±%
Liberal D. Caldwell 4,368 51.1 N/A
Conservative M. Emberton3,49540.9N/A
Labour S. Owens5386.3N/A
Ind. Conservative John Fishwick1391.6N/A
Majority87310.2N/A
Registered electors 14,673
Turnout 58.2N/A
Liberal win (new seat)

[3]

Wallasey No. 5 (North Liscard-Upper Brighton Street)

Wallasey No. 5 (North Liscard-Upper Brighton Street)
PartyCandidateVotes%±%
Conservative H. Grant 2,099 39.8 N/A
Liberal P. Tyrer2,00138.0N/A
Labour G. Watkins91217.3N/A
Ind. Conservative H. Thompson2584.9N/A
Majority981.8N/A
Registered electors 11,774
Turnout 5,27044.8N/A
Conservative win (new seat)

[3]

Wallasey No. 6 ( Seacombe-Poulton-Somerville)

Wallasey No. 6 ( Seacombe-Poulton-Somerville)
PartyCandidateVotes%±%
Labour J. Gershman 2,994 68.3% N/A
Conservative F. Hunter1,38731.7%N/A
Majority1,60736.6%N/A
Registered electors 12,427
Turnout 4,38735.3%N/A
Labour win (new seat)

[3]

Wirral No. 1 (Barnston-Gayton-Heswall-Oldfield)

Wirral No.1 (Barnston-Gayton-Heswall-Oldfield)
PartyCandidateVotes%±%
Conservative N. Pannell 3,477 60.9% N/A
Liberal G. Collins1,70629.9N/A
Labour J. Durrant5229.1%N/A
Majority1,77131.0%N/A
Registered electors 11,022
Turnout 5,70551.8%N/A
Conservative win (new seat)

[3]

Wirral No. 2 (Irby-Pensby-Thurstaston)

Wirral No.2 (Irby-Pensby-Thurstaston)
PartyCandidateVotes%±%
Conservative F. Burlinson 2,934 62.5% N/A
Labour J. Heery1,76037.5%N/A
Majority1,17425.0%N/A
Registered electors 9,147
Turnout 4,69451.3%N/A
Conservative win (new seat)

[3]

Notes

bold denotes the winning candidate

    Related Research Articles

    <span class="mw-page-title-main">Liverpool City Council</span> Local government body in England

    Liverpool City Council is the governing body for the city of Liverpool in Merseyside, England. It consists of 85 councillors, for the city's 64 wards. Following a review by the Local Government Boundary Commission the number of wards increased to 64 at the elections on Thursday 4th May 2023. Three wards elect 3 councillors each, fifteen wards elect 2 councillors each and the remaining 46 wards each elect a single councillor, which brought down the total number of councillors to 85.

    <span class="mw-page-title-main">Metropolitan Borough of Wigan</span> Borough of Greater Manchester, England

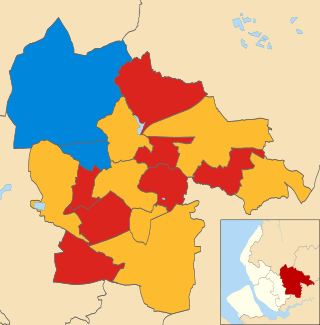
    The Metropolitan Borough of Wigan is a metropolitan borough of Greater Manchester, England. It is named after its largest town, Wigan but covers a far larger area which includes the towns of Atherton, Ashton-in-Makerfield, Golborne, Hindley, Ince-in-Makerfield, Leigh and Tyldesley. The borough also covers the villages and suburbs of Abram, Aspull, Astley, Bryn, Hindley Green, Lowton, Mosley Common, Orrell, Pemberton, Shevington, Standish, Winstanley and Worsley Mesnes. The borough is also the second-most populous district in Greater Manchester.

    <span class="mw-page-title-main">Liverpool Walton (UK Parliament constituency)</span> Parliamentary constituency in the United Kingdom

    Liverpool, Walton is a constituency represented in the House of Commons of the UK Parliament since 2017 by Dan Carden of the Labour Party. Carden won the highest percentage share of the vote in June 2017 of 650 constituencies, 85.7%. It is the safest Labour seat in the United Kingdom, and the safest seat in the country having been won by 85% of the vote in the most recent election in 2019.

    Liverpool City Council elections will be held every four years from 2023. Between 1973 and 2021 elections were generally held three years out of every four, with a third of the council being elected each time. Liverpool City Council is the local authority for the metropolitan borough of Liverpool in Merseyside, England. Since the last boundary changes in 2004, 90 councillors have been elected from 30 wards. New ward boundaries are being prepared to take effect from the 2023 election.

    Knowsley Metropolitan Borough Council elections are generally held three years out of every four, with a third of the council being elected each time. Knowsley Metropolitan Borough Council, generally known as Knowsley Council, is the local authority for the metropolitan borough of Knowsley in Merseyside, England. Since the last boundary changes in 2016, 45 councillors have been elected from 15 wards.

    Neath North is an electoral ward of Neath Port Talbot county borough, Wales falling within the community of Neath.

    <span class="mw-page-title-main">2002 St Helens Metropolitan Borough Council election</span>

    The 2002 St Helens Metropolitan Borough Council election took place on 2 May 2002 to elect members of St Helens Metropolitan Borough Council in Merseyside, England. One third of the council was up for election and the Labour Party stayed in overall control of the council.

    <span class="mw-page-title-main">2003 St Helens Metropolitan Borough Council election</span>

    The 2003 St Helens Metropolitan Borough Council election took place on 1 May 2003 to elect members of St Helens Metropolitan Borough Council in Merseyside, England. One third of the council was up for election and the Labour Party stayed in overall control of the council.

    Sefton Metropolitan Borough Council elections are generally held three years out of every four, with a third of the council being elected each time. Sefton Metropolitan Borough Council, generally known as Sefton Council, is the local authority for the metropolitan borough of Sefton in Merseyside, England. Since the last boundary changes in 2004, 66 councillors have been elected from 22 wards.

    <span class="mw-page-title-main">2006 St Helens Metropolitan Borough Council election</span>

    The 2006 St Helens Metropolitan Borough Council election took place on 4 May 2006 to elect members of St Helens Metropolitan Borough Council in Merseyside, England. One third of the council was up for election and the council stayed under no overall control.

    <span class="mw-page-title-main">Wirral Council</span> Local authority in England

    Wirral Council is the local authority of the Metropolitan Borough of Wirral in Merseyside, England. Wirral is a metropolitan borough, one of five in Merseyside, and provides the majority of local government services in Wirral. The council is a constituent member of the Liverpool City Region Combined Authority.

    <span class="mw-page-title-main">1964 Liverpool City Council election</span> 1964 UK local election

    Elections to Liverpool City Council were held on 7 May 1964.

    <span class="mw-page-title-main">1955 Liverpool City Council election</span> 1955 UK local election

    Elections to Liverpool City Council were held on Thursday 12 May 1955. After the election, the composition of the council was:

    <span class="mw-page-title-main">1953 Liverpool City Council election</span> 1953 UK local election

    Elections to Liverpool City Council were held on 7 May 1953.

    <span class="mw-page-title-main">1949 Liverpool City Council election</span> 1949 UK local election

    Elections to Liverpool City Council were held on Thursday 12 May 1949.

    <span class="mw-page-title-main">1977 Merseyside County Council election</span>

    The 1977 Merseyside County Council election took place on 5 May 1977 to elect members of Merseyside County Council in England. This was on the same day as other local elections.

    <span class="mw-page-title-main">1981 Merseyside County Council election</span>

    The 1981 Merseyside County Council election took place on 7 May to elect members of Merseyside County Council in England. This was on the same day as other local elections.

    <span class="mw-page-title-main">2022 St Helens Metropolitan Borough Council election</span> 2022 local election in St Helens

    The 2022 St Helens Metropolitan Borough Council election took place on 5 May 2022. Due to boundary changes, all 48 councillors were elected at the same time, with the council moving to a system of all-out elections every four years. The election took place alongside other local elections across the United Kingdom.

    <span class="mw-page-title-main">2022 Knowsley Metropolitan Borough Council election</span> 2022 local election in Knowsley

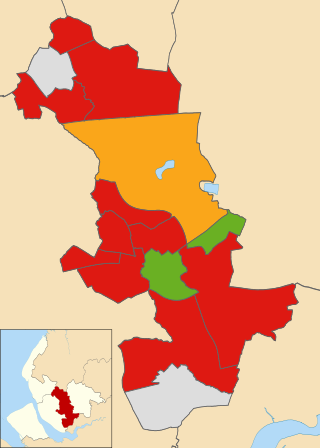
    The 2022 Knowsley Metropolitan Borough Council election took place on 5 May 2022. One third of councillors — 15 out of 45 — on Knowsley Metropolitan Borough Council were elected. The election took place alongside other local elections across the United Kingdom.

    <span class="mw-page-title-main">2022 Wakefield Metropolitan District Council election</span>

    The 2022 Wakefield Metropolitan District Council election took place on 5 May 2022 to elect members of Wakefield Council. This was on the same day as other local elections. 21 of the 63 seats were up for election.

    References

    1. 1 2 3 4 5 6 7 8 9 "Local Election Summaries 1973". The Elections Centre. Retrieved 24 November 2018.
    2. Jeffery, David. "Merseyside Local Election Results Project". Dr David Jeffery. Retrieved 6 May 2021.
    3. 1 2 3 4 5 6 7 8 9 10 11 12 13 14 15 16 17 18 19 20 21 22 23 24 25 26 27 28 29 30 31 32 33 34 35 36 37 38 39 40 41 42 43 44 45 46 47 48 49 50 51 52 53 54 55 56 57 58 59 60 61 62 63 64 65 66 67 68 69 70 71 72 73 74 75 76 77 78 79 80 81 82 83 84 85 86 87 88 89 90 91 92 93 94 95 Rallings, Colin; Thrasher, Michael. Local Elections Handbook 1973. The Elections Centre. Retrieved 2 December 2018.

    "…on night of Labour slaughter…". Liverpool Daily Post. 6 May 1977. Retrieved 25 February 2017.
    "LABOUR SUNK BY TORY'S BLUE TIDE". Liverpool Echo . 6 May 1977. Retrieved 12 March 2017.