| |||||||||||||||||||||||||||||||||||||||||||||||||
| |||||||||||||||||||||||||||||||||||||||||||||||||
22 of 66 seats (One Third) to Wirral Metropolitan Borough Council 34 seats needed for a majority | |||||||||||||||||||||||||||||||||||||||||||||||||
---|---|---|---|---|---|---|---|---|---|---|---|---|---|---|---|---|---|---|---|---|---|---|---|---|---|---|---|---|---|---|---|---|---|---|---|---|---|---|---|---|---|---|---|---|---|---|---|---|---|
Turnout | 44.5% (4.3%) [1] | ||||||||||||||||||||||||||||||||||||||||||||||||
| |||||||||||||||||||||||||||||||||||||||||||||||||
Map of results of 1988 election | |||||||||||||||||||||||||||||||||||||||||||||||||
|
The 1988 Wirral Metropolitan Borough Council election took place on 5 May 1988 to elect members of Wirral Metropolitan Borough Council in England. [2] This election was held on the same day as other local elections.
After the election, the composition of the council was:
Party | Seats | ± | |
---|---|---|---|
Labour | 32 | 5 | |
Conservative | 24 | 5 | |
SLD | 10 | ||
Overall result compared with 1987.
Wirral Metropolitan Borough Council election results, 1988 | |||||||||||||||
---|---|---|---|---|---|---|---|---|---|---|---|---|---|---|---|
Party | Candidates | Votes | |||||||||||||
Stood | Elected | Gained | Unseated | Net | % of total | % | No. | Net % | |||||||
Labour | 22 | 13 | 5 | 0 | 5 | 59.1 | 41.9 | 47,974 | 8.9 | ||||||
Conservative | 22 | 7 | 0 | 5 | 5 | 31.8 | 41.9 | 47,921 | 0.2 | ||||||
SLD | 22 | 2 | 1 | 1 | 9.1 | 13.5 | 15,451 | 8.8 | |||||||
Green | 18 | 0 | 0 | 0 | 0.0 | 2.3 | 2,687 | 1.1 | |||||||
SDP | 2 | 0 | 0 | 0 | 0.0 | 0.3 | 389 | N/A |
Party | Candidate | Votes | % | ±% | |
---|---|---|---|---|---|
Conservative | Brian Cummings | 3,008 | 54.2 | 1.6 | |
Labour | A. Witter | 1,909 | 34.4 | 8.3 | |
SLD | Kevin Turner | 351 | 6.3 | 10.1 | |
Green | Garnette Bowler | 282 | 5.1 | 3.4 | |
Majority | 1,099 | 19.8 | 9.9 | ||
Registered electors | 11,363 | ||||
Turnout | 48.8 | 6.6 | |||
Conservative hold | Swing | 5.0 | |||
Party | Candidate | Votes | % | ±% | |
---|---|---|---|---|---|
Labour | J. Williams | 2,815 | 84.9 | 3.0 | |
Conservative | W. Houldin | 281 | 8.5 | 0.9 | |
SLD | Stephen Niblock | 141 | 4.3 | 4.4 | |
Green | Robert Mitchell | 78 | 2.4 | New | |
Majority | 2,534 | 76.4 | 3.9 | ||
Registered electors | 9,256 | ||||
Turnout | 35.8 | 4.5 | |||
Labour hold | Swing | 2.0 | |||
Party | Candidate | Votes | % | ±% | |
---|---|---|---|---|---|
Labour | William Lungley | 3,035 | 76.5 | 7.0 | |
Conservative | D. Smith | 501 | 12.6 | 1.0 | |
SLD | Stuart Kelly | 333 | 8.4 | 10.5 | |
Green | A. Harrison | 98 | 2.5 | New | |
Majority | 2,534 | 63.9 | 13.3 | ||
Registered electors | 11,005 | ||||
Turnout | 36.0 | 3.2 | |||
Labour hold | Swing | 6.7 | |||
Party | Candidate | Votes | % | ±% | |
---|---|---|---|---|---|
Labour | David Jackson | 2,898 | 58.1 | 10.2 | |
Conservative | C. Molyneux | 1,638 | 32.8 | 5.1 | |
SLD | Simon Holbrook | 364 | 7.3 | 6.9 | |
Green | Perle Sheldricks | 87 | 1.7 | New | |
Majority | 1,260 | 25.3 | 15.4 | ||
Registered electors | 11,420 | ||||
Turnout | 43.7 | 5.2 | |||
Labour hold | Swing | 7.7 | |||
Party | Candidate | Votes | % | ±% | |
---|---|---|---|---|---|
Conservative | Michael Moore | 3,851 | 61.5 | 2.5 | |
Labour | M. Harper | 1,507 | 24.1 | 7.3 | |
SLD | S. Dutton | 724 | 11.6 | 7.6 | |
Green | S. Birchenough | 180 | 2.9 | New | |
Majority | 2,344 | 37.4 | 7.3 | ||
Registered electors | 14,078 | ||||
Turnout | 44.5 | 7.2 | |||
Conservative hold | Swing | 3.7 | |||
Party | Candidate | Votes | % | ±% | |
---|---|---|---|---|---|
Labour | George Davies | 2,210 | 41.1 | 12.5 | |
Conservative | Ian McKellar | 1,903 | 35.4 | 3.6 | |
SLD | Anna Blumenthal | 1,114 | 20.7 | 17.0 | |
Green | Pamela Mitchell | 146 | 2.7 | 0.8 | |
Majority | 307 | 5.7 | N/A | ||
Registered electors | 10,877 | ||||
Turnout | 49.4 | 1.4 | |||
Labour gain from Conservative | Swing | 7.4 | |||
Party | Candidate | Votes | % | ±% | |
---|---|---|---|---|---|
Labour | Andrew Dow | 1,896 | 34.5 | 9.4 | |
SLD | D. Charles | 1,840 | 33.5 | 7.8 | |
Conservative | Mary Jordan | 1,647 | 30.0 | 3.6 | |
Green | Nigel Birchenough | 107 | 1.9 | New | |
Majority | 56 | 1.0 | N/A | ||
Registered electors | 11,917 | ||||
Turnout | 46.1 | 6.7 | |||
Labour gain from SLD | Swing | 4.4 | |||
Party | Candidate | Votes | % | ±% | |
---|---|---|---|---|---|
Labour | Alec Dunn | 3,062 | 66.2 | 13.8 | |
Conservative | G. Francomb | 1,023 | 22.1 | 4.7 | |
SLD | K. Hughes | 396 | 8.6 | 10.2 | |
Green | David Pye | 143 | 3.1 | 1.1 | |
Majority | 2,039 | 44.1 | 18.5 | ||
Registered electors | 11,474 | ||||
Turnout | 40.3 | 3.4 | |||
Labour hold | Swing | 9.3 | |||
Party | Candidate | Votes | % | ±% | |
---|---|---|---|---|---|
Conservative | M. Banks | 4,349 | 75.8 | 4.3 | |
Labour | Michael Sullivan | 676 | 11.8 | 6.0 | |
SLD | Robert Wilkins | 519 | 9.0 | 11.9 | |
Green | J. Bruce | 195 | 3.4 | 1.7 | |
Majority | 3,673 | 64.0 | 13.4 | ||
Registered electors | 13,362 | ||||
Turnout | 43.0 | 9.1 | |||
Conservative hold | Swing | 6.7 | |||
Party | Candidate | Votes | % | ±% | |
---|---|---|---|---|---|
Conservative | Frank Jones | 3,891 | 69.7 | 9.5 | |
Labour | S. Christie | 810 | 14.5 | 7.7 | |
SLD | S. Welshman | 642 | 11.5 | 2.6 | |
Green | A. Brett | 242 | 4.3 | 1.4 | |
Majority | 3,081 | 55.2 | 11.1 | ||
Registered electors | 12,797 | ||||
Turnout | 43.6 | 8.4 | |||
Conservative hold | Swing | 5.6 | |||
Party | Candidate | Votes | % | ±% | |
---|---|---|---|---|---|
Labour | Jim Edwards | 2,805 | 69.0 | 8.0 | |
Conservative | L. Kennedy | 1,100 | 27.0 | 1.3 | |
SLD | Susanne Uriel | 162 | 4.0 | 6.8 | |
Majority | 1,705 | 42.0 | 9.3 | ||
Registered electors | 9,865 | ||||
Turnout | 41.2 | 0.8 | |||
Labour hold | Swing | 4.7 | |||
Party | Candidate | Votes | % | ±% | |
---|---|---|---|---|---|
Labour | E. Smith | 3,321 | 53.3 | 13.4 | |
Conservative | M. Ebbs | 2,461 | 39.5 | 6.3 | |
SLD | John Uriel | 449 | 7.2 | 7.1 | |
Majority | 860 | 13.8 | N/A | ||
Registered electors | 11,677 | ||||
Turnout | 53.4 | 0.9 | |||
Labour gain from Conservative | Swing | 9.9 | |||
Party | Candidate | Votes | % | ±% | |
---|---|---|---|---|---|
Labour | John Clark | 2,665 | 53.2 | 10.1 | |
Conservative | I. Walker | 2,048 | 40.9 | 0.3 | |
SLD | B. Thomas | 223 | 4.4 | 11.3 | |
Green | George Bowler | 76 | 1.5 | New | |
Majority | 617 | 12.3 | 10.4 | ||
Registered electors | 9,233 | ||||
Turnout | 54.3 | 0.8 | |||
Labour gain from Conservative | Swing | 5.2 | |||
Party | Candidate | Votes | % | ±% | |
---|---|---|---|---|---|
Labour | Colin Penfold | 2,438 | 44.1 | 11.3 | |
Conservative | P. Buzzard | 2,404 | 43.5 | 0.2 | |
SLD | L. Matthew | 337 | 6.1 | 17.5 | |
SDP | R. Curphey | 224 | 4.1 | New | |
Green | Allen Burton | 125 | 2.3 | New | |
Majority | 34 | 0.6 | N/A | ||
Registered electors | 11,868 | ||||
Turnout | 46.6 | 0.8 | |||
Labour gain from Conservative | Swing | 5.8 | |||
Party | Candidate | Votes | % | ±% | |
---|---|---|---|---|---|
SLD | Michael Cooke | 2,060 | 38.2 | 0.9 | |
Conservative | Leonard Moore | 1,979 | 36.7 | 1.2 | |
Labour | T. Kelly | 1,251 | 23.2 | 0.2 | |
Green | A. Tebbs | 102 | 1.9 | 0.4 | |
Majority | 81 | 1.5 | 2.1 | ||
Registered electors | 11,550 | ||||
Turnout | 46.7 | 1.7 | |||
SLD hold | Swing | 1.1 | |||
Party | Candidate | Votes | % | ±% | |
---|---|---|---|---|---|
SLD | R. Pullen | 2,432 | 39.9 | 2.3 | |
Conservative | A. Clement | 2,085 | 34.2 | 2.6 | |
Labour | T. Collins | 1,452 | 23.9 | 4.6 | |
Green | D. Pye | 119 | 2.0 | 0.3 | |
Majority | 347 | 5.7 | 0.2 | ||
Registered electors | 12,462 | ||||
Turnout | 48.9 | 6.2 | |||
SLD gain from Conservative | Swing | 0.1 | |||
Party | Candidate | Votes | % | ±% | |
---|---|---|---|---|---|
Conservative | Derek Robinson | 3,491 | 64.9 | 6.1 | |
Labour | D. Hughes | 893 | 16.6 | 5.6 | |
SLD | Peter Reisdorf | 809 | 15.0 | 1.1 | |
Green | K. Cuthbertson | 185 | 3.4 | 0.4 | |
Majority | 2,598 | 48.3 | 5.6 | ||
Registered electors | 12,790 | ||||
Turnout | 42.0 | 8.2 | |||
Conservative hold | Swing | 2.8 | |||
Party | Candidate | Votes | % | ±% | |
---|---|---|---|---|---|
Labour | P. Clee | 3,841 | 75.9 | 13.8 | |
Conservative | G. Allen | 887 | 17.5 | 3.9 | |
SLD | H. Warner | 169 | 3.3 | 13.2 | |
SDP | J. Williams | 165 | 3.3 | New | |
Majority | 2,954 | 58.4 | 17.7 | ||
Registered electors | 11,856 | ||||
Turnout | 42.7 | 2.3 | |||
Labour hold | Swing | 8.9 | |||
Party | Candidate | Votes | % | ±% | |
---|---|---|---|---|---|
Conservative | Sid Dunn | 3,469 | 65.6 | 3.2 | |
Labour | W. Gamet | 985 | 18.6 | 5.5 | |
SLD | Charles Wall | 521 | 9.9 | 8.9 | |
Green | David Burton | 314 | 5.9 | 0.2 | |
Majority | 2,484 | 47.0 | 3.3 | ||
Registered electors | 12,653 | ||||
Turnout | 41.8 | 7.3 | |||
Conservative hold | Swing | 1.7 | |||
Party | Candidate | Votes | % | ±% | |
---|---|---|---|---|---|
Labour | R. Davies | 2,893 | 79.1 | 11.8 | |
Conservative | R. McGunigall | 494 | 13.5 | 1.0 | |
SLD | C. Townsend | 176 | 4.8 | 11.7 | |
Green | C. Rainsford | 95 | 2.6 | 0.9 | |
Majority | 2,399 | 65.6 | 14.8 | ||
Registered electors | 10,529 | ||||
Turnout | 34.7 | 3.8 | |||
Labour hold | Swing | 7.4 | |||
Party | Candidate | Votes | % | ±% | |
---|---|---|---|---|---|
Labour | Keith Rimmer | 3,105 | 55.3 | 9.9 | |
Conservative | Geoffrey Caton | 1,729 | 30.8 | 0.3 | |
SLD | Elizabeth Brame | 664 | 11.8 | 10.9 | |
Green | G. Osler | 113 | 2.0 | 0.6 | |
Majority | 1,376 | 24.5 | 9.6 | ||
Registered electors | 12,731 | ||||
Turnout | 44.1 | 6.8 | |||
Labour hold | Swing | 4.8 | |||
Party | Candidate | Votes | % | ±% | |
---|---|---|---|---|---|
Conservative | Kate Wood | 3,682 | 59.3 | 6.6 | |
Labour | M. Mannin | 1,507 | 24.3 | 7.0 | |
SLD | Moira Gallagher | 1,025 | 16.5 | 13.4 | |
Majority | 2,175 | 35.0 | 12.2 | ||
Registered electors | 12,200 | ||||
Turnout | 50.9 | 3.6 | |||
Conservative hold | Swing | 6.1 | |||
Date | Ward | Name | Previous affiliation | New affiliation | Circumstance | ||
---|---|---|---|---|---|---|---|
October 1988 | Egerton | Alec Dunn | Labour | Independent Labour | Expelled. [13] | ||
October 1988 | Leasowe | Jim Edwards | Labour | Independent Labour | Expelled. [13] | ||
October 1988 | Leasowe | Ken Fox | Labour | Independent Labour | Expelled. [13] | ||
• italics denote the sitting councillor • bold denotes the winning candidate
Wirral Metropolitan Borough Council elections are generally held three years out of every four, with a third of the council being elected each time. Wirral Metropolitan Borough Council, generally known as Wirral Council, is the local authority for the metropolitan borough of Wirral in Merseyside, England. Since the last boundary changes in 2004, 66 councillors have been elected from 22 wards.
The 1998 Wirral Metropolitan Borough Council election took place on 7 May 1998 to elect members of Wirral Metropolitan Borough Council in England. This election was held on the same day as other local elections.
Wirral Metropolitan Borough Council, or simply Wirral Council, is the local authority of the Metropolitan Borough of Wirral in Merseyside, England. It is a metropolitan district council, one of five in Merseyside and one of 36 in the metropolitan counties of England, and provides the majority of local government services in Wirral. It is a constituent council of Liverpool City Region Combined Authority.
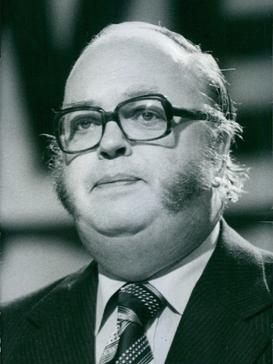
The 1973 Wirral Metropolitan Borough Council election took place on 10 May 1973 to elect members of Wirral Metropolitan Borough Council in England. This was on the same day as other local elections.
The 1975 Wirral Metropolitan Borough Council election took place on 1 May 1975 to elect members of Wirral Metropolitan Borough Council in England. This election was held on the same day as other local elections.
The 1976 Wirral Metropolitan Borough Council election took place on 6 May 1976 to elect members of Wirral Metropolitan Borough Council in England. This election was held on the same day as other local elections.
The 1978 Wirral Metropolitan Borough Council election took place on 4 May 1978 to elect members of Wirral Metropolitan Borough Council in England. This election was held on the same day as other local elections.
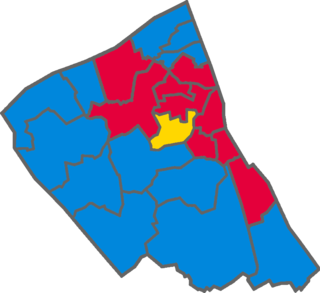
The 1979 Wirral Metropolitan Borough Council election took place on 3 May 1979 to elect members of Wirral Metropolitan Borough Council in England. This election was held on the same day as other local elections.
The 1980 Wirral Metropolitan Borough Council election took place on 1 May 1980 to elect members of Wirral Metropolitan Borough Council in England. This election was held on the same day as other local elections.
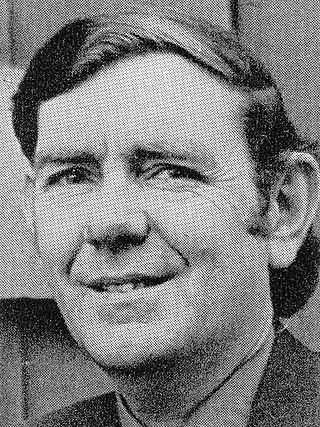
The 1982 Wirral Metropolitan Borough Council election took place on 6 May 1982 to elect members of Wirral Metropolitan Borough Council in England. This election was held on the same day as other local elections.
The 1983 Wirral Metropolitan Borough Council election took place on 5 May 1983 to elect members of Wirral Metropolitan Borough Council in England. This election was held on the same day as other local elections.
The 1984 Wirral Metropolitan Borough Council election took place on 3 May 1984 to elect members of Wirral Metropolitan Borough Council in England. This election was held on the same day as other local elections.
The 1986 Wirral Metropolitan Borough Council election took place on 8 May 1986 to elect members of Wirral Metropolitan Borough Council in England. This election was held on the same day as other local elections.
The 1987 Wirral Metropolitan Borough Council election took place on 7 May 1987 to elect members of Wirral Metropolitan Borough Council in England. This election was held on the same day as other local elections.
The 1990 Wirral Metropolitan Borough Council election took place on 3 May 1990 to elect members of Wirral Metropolitan Borough Council in England. This election was held on the same day as other local elections.
The 1991 Wirral Metropolitan Borough Council election took place on 2 May 1991 to elect members of Wirral Metropolitan Borough Council in England. This election was held on the same day as other local elections.
The 1992 Wirral Metropolitan Borough Council election took place on 7 May 1992 to elect members of Wirral Metropolitan Borough Council in England. This election was held on the same day as other local elections.
The 1994 Wirral Metropolitan Borough Council election took place on 5 May 1994 to elect members of Wirral Metropolitan Borough Council in England. This election was held on the same day as other local elections.
The 1995 Wirral Metropolitan Borough Council election took place on 4 May 1995 to elect members of Wirral Metropolitan Borough Council in England. This election was held on the same day as other local elections.
The 1996 Wirral Metropolitan Borough Council election took place on 2 May 1996 to elect members of Wirral Metropolitan Borough Council in England. This election was held on the same day as other local elections.
Mellows-Facer, Adam (10 May 2006). "Local election 2006". parliament.uk . Retrieved 29 December 2018.
"BBC NEWS VOTE 2003 WIRRAL". BBC News . 1 May 2003. Retrieved 29 December 2018.