| |||||||||||||||||||||||||||||||||||||
| |||||||||||||||||||||||||||||||||||||
All 99 seats to Merseyside County Council 50 seats needed for a majority | |||||||||||||||||||||||||||||||||||||
---|---|---|---|---|---|---|---|---|---|---|---|---|---|---|---|---|---|---|---|---|---|---|---|---|---|---|---|---|---|---|---|---|---|---|---|---|---|
Turnout | 36.9% (1.3%) [1] | ||||||||||||||||||||||||||||||||||||
| |||||||||||||||||||||||||||||||||||||
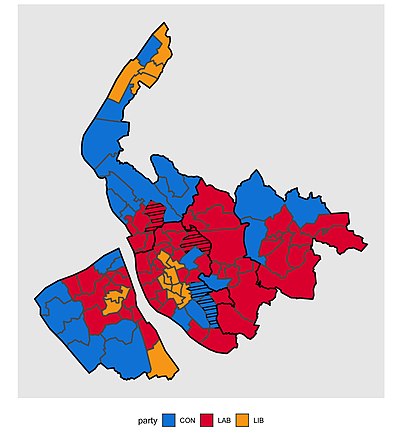
Map of Merseyside County Council showing wards won by party [2] | |||||||||||||||||||||||||||||||||||||
|
The 1981 Merseyside County Council election took place on 7 May to elect members of Merseyside County Council in England. [1] This was on the same day as other local elections.
Merseyside County Council was abolished in 1986.
Overall result compared with 1977.
Merseyside County Council election, 1981 | |||||||||||||||
---|---|---|---|---|---|---|---|---|---|---|---|---|---|---|---|
Party | Candidates | Votes | |||||||||||||
Stood | Elected | Net | % of total | % | № | Net % | |||||||||
Labour | 97 | 57 | 31 | 57.6 | 45.8 | 190,757 | 18.4 | ||||||||
Conservative | 99 | 27 | 40 | 27.3 | 29.3 | 122,050 | 25.8 | ||||||||
Liberal | 88 | 15 | 9 | 15.2 | 24.1 | 100,218 | 7.8 | ||||||||
Residents | 2 | 0 | 0 | 0.0 | 0.4 | 1,728 | N/A | ||||||||
Ecology | 2 | 0 | 0 | 0.0 | 0.1 | 585 | New | ||||||||
Communist | 7 | 0 | 0 | 0.0 | 0.1 | 545 | 0.5 | ||||||||
British Democratic | 2 | 0 | 0 | 0.0 | 0.1 | 264 | New | ||||||||
Independent | 1 | 0 | 0 | 0.0 | 0.0 | 184 | 0.1 | ||||||||
Independent Liberal | 1 | 0 | 0 | 0.0 | 0.0 | 61 | 0.0 |
Merseyside County Council election, 1981 (Knowsley) | |||||||||||||||
---|---|---|---|---|---|---|---|---|---|---|---|---|---|---|---|
Party | Candidates | Votes | |||||||||||||
Stood | Elected | Net | % of total | % | № | Net % | |||||||||
Labour | 11 | 10 | 3 | 90.9 | 68.5 | 27,110 | 23.7 | ||||||||
Conservative | 11 | 1 | 3 | 9.1 | 18.6 | 7,350 | 29.9 | ||||||||
Liberal | 9 | 0 | 0 | 0.0 | 13.0 | 5,136 | 9.6 | ||||||||
Turnout: 31.9% (2.1%)
Merseyside County Council election, 1981 (Liverpool) | |||||||||||||||
---|---|---|---|---|---|---|---|---|---|---|---|---|---|---|---|
Party | Candidates | Votes | |||||||||||||
Stood | Elected | Net | % of total | % | № | Net % | |||||||||
Labour | 36 | 21 | 11 | 58.3 | 46.9 | 67,144 | 18.7 | ||||||||
Liberal | 36 | 8 | 5 | 22.2 | 30.9 | 44,273 | 7.4 | ||||||||
Conservative | 36 | 7 | 16 | 19.4 | 21.7 | 31,057 | 25.3 | ||||||||
Communist | 7 | 0 | 0 | 0.0 | 0.4 | 545 | 0.5 | ||||||||
Independent Liberal | 1 | 0 | 0 | 0.0 | 0.0 | 61 | 0.1 |
Turnout: 37.1% (3.2%)
Merseyside County Council election, 1981 (Sefton) | |||||||||||||||
---|---|---|---|---|---|---|---|---|---|---|---|---|---|---|---|
Party | Candidates | Votes | |||||||||||||
Stood | Elected | Net | % of total | % | № | Net % | |||||||||
Conservative | 19 | 9 | 6 | 47.4 | 38.1 | 31,108 | 25.6 | ||||||||
Labour | 17 | 6 | 3 | 31.6 | 34.4 | 28,070 | 14.2 | ||||||||
Liberal | 15 | 4 | 3 | 21.1 | 24.8 | 20,190 | 10.1 | ||||||||
Residents | 2 | 0 | 0 | 0.0 | 2.1 | 1,728 | N/A | ||||||||
Ecology | 1 | 0 | 0 | 0.0 | 0.6 | 474 | New |
Turnout: 36.6% (2.6)
Merseyside County Council election, 1981 (St Helens) | |||||||||||||||
---|---|---|---|---|---|---|---|---|---|---|---|---|---|---|---|
Party | Candidates | Votes | |||||||||||||
Stood | Elected | Net | % of total | % | № | Net % | |||||||||
Labour | 11 | 9 | 6 | 81.8 | 56.8 | 28,191 | 20.4 | ||||||||
Conservative | 11 | 2 | 6 | 18.2 | 26.6 | 13,172 | 31.4 | ||||||||
Liberal | 8 | 0 | 0 | 0.0 | 16.2 | 8,061 | 10.6 | ||||||||
Independent | 1 | 0 | 0 | 0.0 | 0.4 | 184 | N/A |
Turnout: 35.7% (1.6%)
Merseyside County Council election, 1981 (Wirral) | |||||||||||||||
---|---|---|---|---|---|---|---|---|---|---|---|---|---|---|---|
Party | Candidates | Votes | |||||||||||||
Stood | Elected | Net | % of total | % | № | Net % | |||||||||
Labour | 22 | 11 | 8 | 50.0 | 39.2 | 40,242 | 18.1 | ||||||||
Conservative | 22 | 8 | 9 | 36.4 | 38.4 | 39,363 | 22.0 | ||||||||
Liberal | 20 | 3 | 1 | 13.6 | 22.0 | 22,558 | 4.0 | ||||||||
British Democratic | 2 | 0 | 0 | 0.0 | 0.3 | 264 | New | ||||||||
Ecology | 1 | 0 | 0 | 0.0 | 0.1 | 111 | New |
Turnout: 39.9% (1.9%)
Results compared directly with the last local election in 1977.
Party | Candidate | Votes | % | ±% | |
---|---|---|---|---|---|
Labour | P. Longfall * | 2,116 | 91% | 31% | |
Conservative | A. Simpson | 210 | 9% | 31% | |
Majority | 1,906 | ||||
Registered electors | 9,165 | ||||
Turnout | 2,346 | 25.6 | 5.1 | ||
Rejected ballots | |||||
Labour hold | Swing | 31 | |||
Party | Candidate | Votes | % | ±% | |
---|---|---|---|---|---|
Labour | J. Maguire | 1,891 | 65% | ||
Conservative | J. E. Easthope | 560 | 19% | ||
Liberal | D. Cottier | 439 | 15% | ||
Majority | 1,331 | ||||
Registered electors | 9,072 | ||||
Turnout | 2,894 | 32 | |||
Rejected ballots | |||||
Labour hold | Swing | ||||
Party | Candidate | Votes | % | ±% | |
---|---|---|---|---|---|
Conservative | W. J. Simpson * | 1,982 | 43% | ||
Labour | E. O'Hara | 1,816 | 39% | ||
Liberal | L. Cottier | 805 | 17% | ||
Majority | 166 | ||||
Registered electors | 13,599 | ||||
Turnout | 4,610 | 34% | |||
Rejected ballots | 7 | ||||
Conservative hold | Swing | ||||
Party | Candidate | Votes | % | ±% | |
---|---|---|---|---|---|
Labour | S. S. Powell * | 2,150 | 67% | ||
Liberal | J. Melia | 518 | 16% | ||
Conservative | P. Forrester | 517 | 16% | ||
Majority | 1,632 | ||||
Registered electors | 11,211 | ||||
Turnout | 3,195 | 28% | |||
Rejected ballots | 10 | ||||
Labour hold | Swing | ||||
Party | Candidate | Votes | % | ±% | |
---|---|---|---|---|---|
Labour | J. King * | 2,269 | 79 | 22.9 | |
Liberal | S. Welsh | 495 | 17 | 3.5 | |
Conservative | K. Johnson | 100 | 3 | 21.3 | |
Majority | 1,774 | 31.8 | 6.4 | ||
Registered electors | 9,231 | ||||
Turnout | 2,864 | 31 | |||
Labour hold | Swing | ||||
Party | Candidate | Votes | % | ±% | |
---|---|---|---|---|---|
Labour | J. Gallagher * | 2,577 | 72% | 26.8 | |
Liberal | G. Sealey | 741 | 21% | 4.7 | |
Conservative | J. Carraher | 246 | 7% | 27.8 | |
Majority | 325 | 10.4 | 4.2 | ||
Registered electors | 11,167 | ||||
Turnout | 3,573 | 32% | 3.9 | ||
Labour hold | Swing | 4.7 | |||
Party | Candidate | Votes | % | ±% | |
---|---|---|---|---|---|
Labour | G. Bundred | 1,983 | 52.5 | 20.1 | |
Conservative | C. Baily | 1,187 | 31.4 | 12.4 | |
Liberal | J. Smith | 413 | 10.9 | New | |
Communist | T. Bradburn | 194 | 5.1 | 3.4 | |
Majority | 796 | 21.1 | 32.5 | ||
Registered electors | 15,378 | ||||
Turnout | 3,777 | 24.6 | 3.9 | ||
Labour hold | Swing | 16.3 | |||
Party | Candidate | Votes | % | ±% | |
---|---|---|---|---|---|
Conservative | W. Hughes | 1,888 | 57.7 | 18.9 | |
Labour | W. Howarth | 1,386 | 42.3 | 18.9 | |
Majority | 502 | 15.4 | N/A | ||
Registered electors | 8,654 | ||||
Turnout | 37.9 | 4.8 | |||
Conservative gain from Labour | Swing | 18.9 | |||
Party | Candidate | Votes | % | ±% | |
---|---|---|---|---|---|
Labour | R. Foulkes | 1,444 | 40.1 | 25.5 | |
Conservative | S. Pyne | 1,390 | 38.6 | 4.2 | |
Ind. Conservative | B. Jeffrey | 765 | 21.3 | New | |
Majority | 54 | 1.5 | 29.7 | ||
Registered electors | 11,132 | ||||
Turnout | 32.6 | 2.2 | |||
Labour hold | Swing | 14.9 | |||
Party | Candidate | Votes | % | ±% | |
---|---|---|---|---|---|
Conservative | J. Sinclair | 2,488 | 54.3 | 26.7 | |
Labour | J. Bohanna | 2,094 | 45.7 | 26.7 | |
Majority | 394 | 8.6 | 36.2 | ||
Registered electors | 14,426 | ||||
Turnout | 31.8 | 2.5 | |||
Conservative gain from Labour | Swing | 26.7 | |||
Party | Candidate | Votes | % | ±% | |
---|---|---|---|---|---|
Labour | W. Alldritt | 1,618 | 51.3 | 19.5 | |
Conservative | T. Maudsley | 1,533 | 48.7 | 29.4 | |
Majority | 85 | 2.6 | 48.9 | ||
Registered electors | 11,914 | ||||
Turnout | 26.5 | 1.2 | |||
Labour hold | Swing | 24.5 | |||
Party | Candidate | Votes | % | ±% | |
---|---|---|---|---|---|
Labour | O. Doyle | 2,049 | 54% | 3.4 | |
Liberal | Chris Davies | 1,437 | 38% | 32.1 | |
Communist | R.O'Hara | 158 | 4% | ||
Conservative | P.M.Cawson | 148 | 4% | 6 | |
Majority | 612 | 16.8 | 17.8 | ||
Registered electors | 11,504 | ||||
Turnout | 3,814 | 33% | 14 | ||
Labour hold | Swing | 3.4 | |||
Party | Candidate | Votes | % | ±% | |
---|---|---|---|---|---|
Conservative | S. T. Moss * | 2,968 | 49% | 24 | |
Liberal | G. P. Scott | 1,826 | 30% | 14.9 | |
Labour | B. Smart | 1,201 | 20% | 9.6 | |
Majority | 1,142 | 19 | 38.8 | ||
Registered electors | 14,746 | ||||
Turnout | 6,002 | 41% | 6.7 | ||
Conservative hold | Swing | 24 | |||
Party | Candidate | Votes | % | ±% | |
---|---|---|---|---|---|
Conservative | W. S. D. Weaver * | 2,189 | 49% | 24 | |
Labour | M. O'Neill | 1,180 | 27% | 14.2 | |
Liberal | N. G. Chinn | 1,053 | 24% | 9.9 | |
Majority | 1,009 | 22.8 | 9 | ||
Registered electors | 10,698 | ||||
Turnout | 4,429 | 41.4% | 1.8 | ||
Conservative hold | Swing | 24 | |||
Party | Candidate | Votes | % | ±% | |
---|---|---|---|---|---|
Liberal | Carole M. Cartmell | 2,225 | 44% | 25.1 | |
Labour | J. E. Roberts | 1,848 | 36% | 4.2 | |
Conservative | T. P. Pink | 1,025 | 20% | 29.3 | |
Majority | 377 | 7.4 | 10.1 | ||
Registered electors | 12,478 | ||||
Turnout | 5,104 | 40.9% | 3.8 | ||
Liberal gain from Conservative | Swing | 29.3 | |||
Party | Candidate | Votes | % | ±% | |
---|---|---|---|---|---|
Liberal | Roger Johnston | 1,745 | 39.5% | 6.3 | |
Labour | R. J. Quick | 1,713 | 38.7% | 28.4 | |
Conservative | H. A. Quayle | 857 | 19.4% | 23.3 | |
Communist | J. C. Blevin | 85 | 1.9% | 2.0 | |
Majority | 33 | ||||
Registered electors | 12,115 | ||||
Turnout | 4,422 | 36.5% | 3.2 | ||
Liberal gain from Conservative | Swing | 29.6 | |||
Party | Candidate | Votes | % | ±% | |
---|---|---|---|---|---|
Labour | J. Brazier | 1,884 | 48.6% | 17.8 | |
Liberal | F. McNevin | 1,708 | 44.0% | 15.4 | |
Conservative | Pauline Dougherty | 276 | 7.1% | 33.5 | |
Majority | 176 | ||||
Registered electors | 11,179 | ||||
Turnout | 3,879 | 34.7% | 2.3 | ||
Labour gain from Conservative | Swing | 51.3 | |||
Party | Candidate | Votes | % | ±% | |
---|---|---|---|---|---|
Labour | B. Wright | 1,660 | 37.3 | 8.0 | |
Liberal | G. L. Holmes | 1,651 | 37.1 | 1.8 | |
Conservative | R. D. Oughton | 1,134 | 25.5% | 9.8 | |
Majority | 9 | 0.02 | 6.38 | ||
Registered electors | 11,833 | ||||
Turnout | 4,449 | 37.6% | 1.9 | ||
Labour hold | Swing | 8.0 | |||
Party | Candidate | Votes | % | ±% | |
---|---|---|---|---|---|
Labour | K. C. Coombes | 2,565 | 86.1% | 24.5 | |
Liberal | W. Barrow | 231 | 7.8% | 2.9 | |
Conservative | E. J. Crighton | 172 | 5.8% | 6.4 | |
Majority | 2,334 | 78.35% | 44.65% | ||
Registered electors | 10,638 | ||||
Turnout | 2,979 | 28% | 6.8 | ||
Labour hold | Swing | 24.5 | |||
Party | Candidate | Votes | % | ±% | |
---|---|---|---|---|---|
Conservative | C. Henry De Boer * | 3,114 | 43.8% | 44.9 | |
Conservative | Mary V .Wood * | 3,060 | 43.0% | 45.7 | |
Labour | P. Astbury | 2,072 | 29.1% | 15.6 | |
Labour | A. Mulhearn | 2,040 | 28.7% | 15.2 | |
Liberal | W. A. Barton | 1,928 | 27.1% | 10.4 | |
Liberal | E. M. Brash | 1,887 | 26.5 | 11.0 | |
Majority | 1,042 | ||||
Registered electors | 19,620 | ||||
Turnout | 7,114 | 36.3 | 3.0 | ||
Labour gain from Conservative party (UK) | Swing | ||||
Party | Candidate | Votes | % | ±% | |
---|---|---|---|---|---|
Liberal | Leonard Tyrer | 3,163 | 46.6% | 5.5 | |
Conservative | H.C.Bolton-Jones | 2,284 | 33.6% | 7.6 | |
Labour | Maria Gee | 1,326 | 19.5% | 11.8 | |
Majority | 879 | 12.95 | 2.85 | ||
Registered electors | 14,728 | ||||
Turnout | 6,790 | 46.1% | 1 | ||
Liberal gain from Labour | Swing | 13.1 | |||
Party | Candidate | Votes | % | ±% | |
---|---|---|---|---|---|
Labour | H. Rimmer | 2,161 | 49.4% | 23.0 | |
Liberal | Audrey Humphries | 1,699 | 38.8% | 4.0 | |
Conservative | S. Costain | 499 | 11.4% | 27.4 | |
Majority | 462 | 10.56% | 6.56 | ||
Registered electors | 10,694 | ||||
Turnout | 4,374 | 40.9% | 3.4 | ||
Labour gain from Conservative | Swing | 50.4 | |||
Party | Candidate | Votes | % | ±% | |
---|---|---|---|---|---|
Labour | Sylvia Renilson | 2,230 | 48.7% | 20.1 | |
Liberal | R. I. Jobling | 1,672 | 36.5% | 4.6 | |
Conservative | W. Thomas | 668 | 14.6% | 24.9 | |
Majority | 558 | 12.19% | 5.09 | ||
Registered electors | 12,015 | ||||
Turnout | 4,578 | 38.1% | |||
Labour gain from Conservative | Swing | 45.0 | |||
Party | Candidate | Votes | % | ±% | |
---|---|---|---|---|---|
Conservative | E.H. Fitzpatrick | 2,119 | 44.5% | 9.8 | |
Labour | F. Burke | 1,577 | 33.1% | 20 | |
Liberal | T. R.Jones | 1,056 | 22.2% | 10.4 | |
Majority | 542 | 11.38 | 9.8 | ||
Registered electors | 13,370 | ||||
Turnout | 4,764 | 35.6% | 12.6 | ||
Conservative hold | Swing | 9.8 | |||
Party | Candidate | Votes | % | ±% | |
---|---|---|---|---|---|
Labour | M. Evans * | 1,662 | 63.9% | 9.8 | |
Liberal | J. C. Cawley | 687 | 27.1 | 18.1 | |
Conservative | J. A. Watson | 168 | 6.6 | 26.6 | |
Communist | J. Greig | 46 | 2 | 2.2 | |
Majority | 935 | 36.85 | 17.25 | ||
Registered electors | 7,269 | ||||
Turnout | 2,537 | 34.9% | 10 | ||
Labour hold | Swing | 9.8 | |||
Party | Candidate | Votes | % | ±% | |
---|---|---|---|---|---|
Labour | J. V. Walsh | 3,167 | 53.2% | 11.9 | |
Liberal | G.B.Smith | 1,850 | 31.1% | 18.4 | |
Conservative | J. L. Walsh | 896 | 15.1% | 27.9 | |
Majority | 1,317 | 22.13% | 17.43 | ||
Registered electors | 16,258 | ||||
Turnout | 5,950 | 36.6% | 7.7 | ||
Labour gain from Conservative | Swing | 27.0 | |||
Party | Candidate | Votes | % | ±% | |
---|---|---|---|---|---|
Liberal | Frank Doran | 1,805 | 55.7% | 21.5% | |
Labour | S. J. Gorman | 1,056 | 32.6% | 6.5 | |
Conservative | Mary Davis | 361 | 11.4% | 26.6 | |
Majority | 749 | 23.12% | 19.12 | ||
Registered electors | 9,771 | ||||
Turnout | 3,240 | 33.2% | 1.1 | ||
Liberal gain from Conservative | Swing | 48.1 | |||
Party | Candidate | Votes | % | ±% | |
---|---|---|---|---|---|
Labour | W. F. Row | 2,347 | 58.1% | 28.8 | |
Conservative | A. Brown | 943 | 23.3% | 20.2 | |
Liberal | Patricia Fairhurst | 740 | 18.3% | 9.0 | |
Majority | 1,404 | 34.76 | 20.56 | ||
Registered electors | 11,313 | ||||
Turnout | 4,039 | 35.7% | 3.2 | ||
Labour gain from Conservative | Swing | 49.0 | |||
Party | Candidate | Votes | % | ±% | |
---|---|---|---|---|---|
Labour | A. Jennings | 4,409 | 83.4% | 23.7 | |
Labour | T. McManus | 4,212 | 79.7% | ||
Liberal | J. Farley | 451 | 8.5% | ||
Conservative | A. Gore | 447 | 8.5% | 31.8 | |
Liberal | J. G. Morgan | 429 | 8.1% | ||
Conservative | D.G.Dougherty | 428 | 8.1% | ||
Majority | 3,958 | 74.85% | 25.15 | ||
Registered electors | 18,439 | ||||
Turnout | 5,288 | 28.7 | 3.3 | ||
Labour hold | Swing | 23.7 | |||
Labour hold | Swing | ||||
Party | Candidate | Votes | % | ±% | |
---|---|---|---|---|---|
Labour | Margaret Simey | 1,940 | 58.0% | 10.2 | |
Liberal | A.Damsell | 1,041 | 31.1% | 19.6 | |
Conservative | A. Palin | 277 | 8.3% | 27.3 | |
Communist | S. P. Munby | 66 | 2% | 3.3 | |
Majority | 899 | 26.88% | 16.68 | ||
Registered electors | 11,110 | ||||
Turnout | 3,344 | 30.1% | 6.7 | ||
Labour hold | Swing | 10.2 | |||
Party | Candidate | Votes | % | ±% | |
---|---|---|---|---|---|
Liberal | A.H.Thomas | 1,236 | 51.7% | 6.5 | |
Labour | L.Reynolds | 997 | 41.7% | 19.4 | |
Conservative | D.Ellis | 149 | 6.2% | 13.5 | |
Majority | 239 | 10.0% | 26 | ||
Registered electors | 6,551 | ||||
Turnout | 2,391 | 36.5% | 1.1 | ||
Rejected ballots | 9 | 0.38% | |||
Liberal hold | Swing | 6.5 | |||
Party | Candidate | Votes | % | ±% | |
---|---|---|---|---|---|
Liberal | N. Caple | 1,577 | 49.0% | 4.9 | |
Labour | A. Gamble | 1,523 | 47.4% | 15.3 | |
Conservative | A. R. Hopkinsons | 108 | 3.4% | 9.1 | |
Majority | 54 | 1.69% | 10.8 | ||
Registered electors | 8,462 | ||||
Turnout | 3,216 | 38.0% | 4.9 | ||
Rejected ballots | 8 | 0.25% | |||
Liberal hold | Swing | 4.9 | |||
Party | Candidate | Votes | % | ±% | |
---|---|---|---|---|---|
Labour | B. Shaw * | 2,045 | 59.4% | 0% | |
Liberal | K. A. Sewill | 1,237 | 35.9% | 25.0 | |
Conservative | S. Fitzsimmons | 154 | 4.5% | 27.2 | |
Majority | 808 | 23.47% | 4.23 | ||
Registered electors | 8,140 | ||||
Turnout | 3,443 | 42.3% | 16.5 | ||
Labour hold | Swing | 0.0% | |||
Party | Candidate | Votes | % | ±% | |
---|---|---|---|---|---|
Labour | Jane A. Hollinshead | 2,572 | 52.6% | 11.2 | |
Liberal | D. M. Galbraith | 1,194 | 24.4% | 11.7 | |
Conservative | W. H. Connolly | 973 | 19.9% | 21.5 | |
Communist | H. Mohin | 65 | 1.3% | 1.2 | |
Independent Liberal | K. McCullough | 61 | 1.25% | 0.45 | |
Majority | 1,378 | 28.2% | 22.9% | ||
Registered electors | 12,095 | ||||
Turnout | 4,886 | 40.4% | 2.1 | ||
Rejected ballots | 21 | 0.43% | |||
Labour hold | Swing | 11.2 | |||
Party | Candidate | Votes | % | ±% | |
---|---|---|---|---|---|
Liberal | P. D. Mahon * | 2,668 | 59.5% | 16.5 | |
Labour | R. J. Clarke | 1,336 | 29.8% | 2.8 | |
Conservative | I. G. McKellar | 395 | 8.8% | 19.2 | |
Communist | J. G. Volleamere | 68 | 1.5% | 0.5 | |
Majority | 1,332 | 29.71% | |||
Registered electors | 10,856 | ||||
Turnout | 4,484 | 41.3% | 4.0 | ||
Rejected ballots | 17 | 0.38% | |||
Liberal hold | Swing | 16.5 | |||
Party | Candidate | Votes | % | ±% | |
---|---|---|---|---|---|
Labour | R. N. Wareing | 4,280 | 75.8% | 30.0 | |
Conservative | J. M. Wright | 788 | 14.0% | 33.0% | |
Liberal | T. G. Ellis | 567 | 10.0% | 2% | |
Majority | 3,492 | 61.85% | |||
Registered electors | 15,727 | ||||
Turnout | 5,646 | 35.9% | 3.9 | ||
Rejected ballots | 11 | 0.19% | |||
Labour gain from Conservative | Swing | 63% | |||
Party | Candidate | Votes | % | ±% | |
---|---|---|---|---|---|
Labour | H. Keidan | 1,721 | 49.0% | 10.0% | |
Liberal | Peter Milea | 1,070 | 30.4% | 18.4 | |
Conservative | D. R. Hawes | 649 | 18.5% | 27.5 | |
Communist | R. Ross | 57 | 1.6% | 1.4 | |
Majority | 651 | 18.53% | |||
Registered electors | 8,741 | ||||
Turnout | 3,514 | 40.1% | 10.1 | ||
Rejected ballots | 17 | 0.48% | |||
Labour gain from Conservative Party(UK) | Swing | 37.5 | |||
Party | Candidate | Votes | % | ±% | |
---|---|---|---|---|---|
Labour | G. G. Pratt | 1,141 | 36.1% | 18.1 | |
Liberal | G. Abrams | 1,140 | 36.1% | 0.9 | |
Conservative | R. S. Jones * | 863 | 27.3% | 18.7 | |
Majority | 1 | 0.03% | |||
Registered electors | 9,576 | ||||
Turnout | 3,160 | 33.0% | 1.0 | ||
Rejected ballots | 16 | 0.51% | |||
Labour gain from Conservative | Swing | 19 | |||
Party | Candidate | Votes | % | ±% | |
---|---|---|---|---|---|
Labour | J. Hughes | 2,569 | 79.4% | 0.6 | |
Liberal | S.Radford | 192 | 5.9% | 1.1 | |
Conservative | Hazel J. Clarke | 59 | 1.8% | 11.1 | |
Majority | 2,377 | 73.48% | 6.48 | ||
Registered electors | 8,381 | ||||
Turnout | 3,235 | 38.6% | 21.6% | ||
Rejected ballots | |||||
Labour hold | Swing | 0.6 | |||
Party | Candidate | Votes | % | ±% | |
---|---|---|---|---|---|
Labour | B. Simpson | 2,934 | 69.9% | 13.9 | |
Liberal | J. D. Ball | 832 | 19.8% | 12.8 | |
Conservative | A. Nugent | 430 | 10.2% | 26.8 | |
Majority | 2,102 | 50.08% | 31.08% | ||
Registered electors | 13,281 | ||||
Turnout | 4,197 | 31.6% | 10.6 | ||
Rejected ballots | 1 | 0.02% | |||
Labour hold | Swing | 13.9 | |||
Party | Candidate | Votes | % | ±% | |
---|---|---|---|---|---|
Liberal | B. Gore | 1,890 | 44.3% | 14.3 | |
Labour | T. McDonald | 1,690 | 39.6% | 16.6 | |
Conservative | J. Irving | 676 | 15.8% | 30.2 | |
Majority | 200 | 4.68% | |||
Registered electors | 10,570 | ||||
Turnout | 4,270 | 40.4% | 5.4 | ||
Liberal gain from Conservative | Swing | 44.5 | |||
Party | Candidate | Votes | % | ±% | |
---|---|---|---|---|---|
Labour | R. Riley | 1,455 | 41.6% | 20.6 | |
Conservative | R. B. Flude * | 1,140 | 32.6% | 16.4 | |
Liberal | H. G. Rogers | 883 | 25.3% | 3.7 | |
Majority | 315 | 9.01% | |||
Registered electors | 10,955 | ||||
Turnout | 3,495 | 31.9% | 3.1 | ||
Rejected ballots | 17 | 0.49% | |||
Labour gain from Conservative party (UK) | Swing | 37.0 | |||
Party | Candidate | Votes | % | ±% | |
---|---|---|---|---|---|
Labour | L. Evans * | 3,152 | 77.3% | 28.3 | |
Liberal | Jean E.Nester | 483 | 11.8% | 4.8 | |
Conservative | Pamela Stephen | 429 | 10.5% | 27.5 | |
Majority | 2,723 | 66.81% | 55.81 | ||
Registered electors | 11,848 | ||||
Turnout | 4,076 | 34.4% | 6.4 | ||
Rejected ballots | 12 | 0.29% | |||
Labour hold | Swing | 28.3 | |||
Party | Candidate | Votes | % | ±% | |
---|---|---|---|---|---|
Conservative | L. B. Williams * | 3,681 | 54.6% | 21.4 | |
Conservative | T. L. Hobday * | 3,679 | 54.6% | 21.4 | |
Labour | D. A. Bradbury | 1,723 | 25.6% | 13.6 | |
Labour | P. R. Martin | 1,671 | 24.8% | 13.8 | |
Liberal | C. Mayes | 1,335 | 19.8% | 8.8 | |
Liberal | R. J. Ormsby | 1,286 | 19.1% | 8.1 | |
Majority | 1,958 | 29.05% | |||
Registered electors | 17,859 | ||||
Turnout | 6,739 | 37.7% | 6.3 | ||
Rejected ballots | 0 | 0% | |||
Conservative hold | Swing | 21.4 | |||
Party | Candidate | Votes | % | ±% | |
---|---|---|---|---|---|
Labour | A. S. Moore | 2,677 | 68% | 25 | |
Conservative | F. P. Morris * | 788 | 20% | 28 | |
Liberal | Mrs. H. Fjortoft | 458 | 12% | 5 | |
Majority | 1,889 | 48.05% | 43.05 | ||
Registered electors | 12,640 | ||||
Turnout | 3,931 | 31% | |||
Rejected ballots | 8 | 0.2% | |||
Conservative gain from Labour | Swing | 53 | |||
Party | Candidate | Votes | % | ±% | |
---|---|---|---|---|---|
Labour | W. A. Wiseman * | 2,142 | 77% | 18 | |
Liberal | R. E. Williams | 337 | 12% | N/A | |
Conservative | H. E. Dunbar | 285 | 10% | 2 | |
Majority | 1,805 | 64.88% | |||
Registered electors | 9,432 | ||||
Turnout | 2,782 | 29% | 12 | ||
Rejected ballots | 18 | 0.65% | |||
Labour hold | Swing | 18 | |||
Party | Candidate | Votes | % | ±% | |
---|---|---|---|---|---|
Labour | B. Hillen * | 5,255 | 68% | 8 | |
Labour | T. J. McNicholas | 5,109 | 66% | 18 | |
Liberal | A. J. F. Harris | 1,336 | 17% | ||
Liberal | J. Butterfield | 1,291 | 17% | ||
Conservative | G. Halliwell | 1,117 | 14% | 18 | |
Conservative | J. F. Burrows | 1,050 | 14% | 28 | |
Majority | 4,138 | 53.68 | |||
Registered electors | 24,130 | ||||
Turnout | 7,704 | 32% | 5 | ||
Rejected ballots | |||||
Labour hold | Swing | 18 | |||
Labour hold | Swing | 17 | |||
Party | Candidate | Votes | % | ±% | |
---|---|---|---|---|---|
Conservative | N. C. Goldrein * | 1,931 | 41% | 28 | |
Liberal | K. Sartain | 1,507 | 32% | 15 | |
Labour | J. C. Hulligan | 1,293 | 27% | 10 | |
Majority | 424 | 8.96% | 43.04 | ||
Registered electors | 11,943 | ||||
Turnout | 4,731 | 40% | 4 | ||
Rejected ballots | |||||
Conservative hold | Swing | 28 | |||
Party | Candidate | Votes | % | ±% | |
---|---|---|---|---|---|
Labour | R. D. Waring | 2,325 | 57% | 19 | |
Conservative | R. O. Harvey * | 1,013 | 25% | 31 | |
Liberal | V. B. Kehoe | 754 | 18% | 12 | |
Majority | 1,312 | 13.91% | |||
Registered electors | 10,278 | ||||
Turnout | 4,111 | 40% | 7 | ||
Rejected ballots | 19 | 0.46% | |||
Labour gain from Conservative party (UK) | Swing | 50 | |||
Party | Candidate | Votes | % | ±% | |
---|---|---|---|---|---|
Conservative | W. R. Bennett * | 2,074 | 54% | 18 | |
Labour | E. A. Murphy | 1,771 | 46% | 26 | |
Majority | 303 | 7.85% | |||
Registered electors | 10,323 | ||||
Turnout | 3,861 | 37% | |||
Rejected ballots | 16 | 0.41% | |||
Conservative hold | Swing | 18 | |||
Party | Candidate | Votes | % | ±% | |
---|---|---|---|---|---|
Conservative | F. L. Pritchard * | 2,581 | 69% | 13 | |
Labour | G. Stringer | 654 | 17% | 10 | |
Liberal | C. E. Bolger | 521 | 14% | 3 | |
Majority | 1,927 | 51.20% | |||
Registered electors | 9,203 | ||||
Turnout | 3,764 | 41% | 5 | ||
Rejected ballots | 8 | 0.21% | |||
Conservative hold | Swing | 13 | |||
Party | Candidate | Votes | % | ±% | |
---|---|---|---|---|---|
Conservative | J. R. Murray-Bligh | 3,629 | 49% | 32% | |
Liberal | Margaret Metcalfe | 2,142 | 29% | 10 | |
Labour | J. L. Linden | 1,206 | 16% | ||
Ecology Party | R. W. Small | 474 | 6. 4% | ||
Majority | 1,487 | 19.94% | |||
Registered electors | 18,599 | ||||
Turnout | 7,458 | 40% | 3 | ||
Rejected ballots | 7 | 0.09% | |||
Conservative hold | Swing | 32 | |||
Party | Candidate | Votes | % | ±% | |
---|---|---|---|---|---|
Labour | E. Lawrenson | 4,133 | 73% | 29 | |
Conservative | Mrs. G. Buckles | 1,472 | 26% | 22 | |
Majority | 2,661 | 47.29% | |||
Registered electors | 16,077 | ||||
Turnout | 5,627 | 35% | 1 | ||
Rejected ballots | 22 | 0.39% | |||
Labour gain from Conservative | Swing | 51 | |||
Party | Candidate | Votes | % | ±% | |
---|---|---|---|---|---|
Conservative | J. Hartley * | 2,606 | 56% | 31 | |
Liberal | R. W. Rothwell | 1,266 | 27.2% | 1.2 | |
Labour | J. F. Caven | 777 | 17% | 7 | |
Majority | 1,340 | 28.79% | 32.21 | ||
Registered electors | 14,192 | ||||
Turnout | 4,655 | 33% | |||
Rejected ballots | 6 | 0.13% | |||
Conservative hold | Swing | 31 | |||
Party | Candidate | Votes | % | ±% | |
---|---|---|---|---|---|
Liberal | R. Rimmer | 1,759 | 40% | 14 | |
Conservative | B. Lamont | 1,548 | 35% | 24 | |
Labour | S. Forkins | 1,101 | 25% | 10 | |
Majority | 211 | 4.79% | |||
Registered electors | 12,174 | ||||
Turnout | 4,408 | 36% | 3 | ||
Rejected ballots | |||||
Liberal gain from Conservative | Swing | 38 | |||
Party | Candidate | Votes | % | ±% | |
---|---|---|---|---|---|
Liberal | S. Shaw | 1,681 | 50.0% | 28 | |
Conservative | J. Morland | 1,675 | 49.8% | 28.2 | |
Majority | 6 | 0.18% | |||
Registered electors | 9,120 | ||||
Turnout | 3,365 | 37% | 3 | ||
Rejected ballots | 9 | 0.27% | |||
Liberal hold | Swing | 56.2 | |||
Party | Candidate | Votes | % | ±% | |
---|---|---|---|---|---|
Liberal | Ronald Fearn * | 3,213 | 76% | 26 | |
Conservative | J. Heaton | 997 | 24% | 16 | |
Majority | 2,216 | 52.4% | |||
Registered electors | 11,188 | ||||
Turnout | 4,229 | 38% | 4 | ||
Rejected ballots | 19 | 0.45% | |||
Liberal hold | Swing | 26 | |||
Party | Candidate | Votes | % | ±% | |
---|---|---|---|---|---|
Liberal | D. Griffiths | 2,611 | 48% | 13 | |
Conservative | Mrs. J. Leech * | 2,134 | 40% | 16 | |
Labour | A. Bell | 643 | 12% | 3 | |
Majority | 477 | 8.85% | |||
Registered electors | 11,516 | ||||
Turnout | 5,389 | 47% | 3 | ||
Rejected ballots | 1 | 0.02% | |||
Liberal gain from Conservative | Swing | 29 | |||
Party | Candidate | Votes | % | ±% | |
---|---|---|---|---|---|
Conservative | J. Robinson | 1,831 | 47% | 20 | |
Liberal | N. Jones | 1,673 | 42% | 9 | |
Labour | R. Burnett | 428 | 11% | ||
Majority | 158 | 4.01% | |||
Registered electors | 11,378 | ||||
Turnout | 3,937 | 35% | 4 | ||
Rejected ballots | 5 | 0.13% | |||
Conservative hold | Swing | 20 | |||
Party | Candidate | Votes | % | ±% | |
---|---|---|---|---|---|
Conservative | A. I. Birch * | 2,251 | 64% | 19 | |
Labour | C. Toner | 1,259 | 36% | 19 | |
Majority | 992 | 28.09% | |||
Registered electors | 9,674 | ||||
Turnout | 3,531 | 36% | 1 | ||
Rejected ballots | 21 | 0.59& | |||
Conservative hold | Swing | 19 | |||
Party | Candidate | Votes | % | ±% | |
---|---|---|---|---|---|
Conservative | C. Currall * | 2,069 | 44% | 32 | |
Labour | E. Kay | 1,533 | 33% | 10 | |
Resident | C. Jones | 1,100 | 23.4% | ||
Majority | 536 | 11.39% | 42.21 | ||
Registered electors | 14,482 | ||||
Turnout | 4,707 | 33% | 2 | ||
Rejected ballots | 5 | 0.11% | |||
Conservative hold | Swing | 32 | |||
Party | Candidate | Votes | % | ±% | |
---|---|---|---|---|---|
Conservative | N. Bernard | 1,109 | 31% | N/A | |
Liberal | J. Parkin | 932 | 26% | N/A | |
Labour | S. Peacock | 873 | 25% | N/A | |
Resident | P. Matthews | 628 | 17.7% | N/A | |
Majority | 177 | 4.98% | N/A | ||
Registered electors | 10,205 | ||||
Turnout | 3,551 | 35% | N/A | ||
Rejected ballots | 9 | 0.25% | N/A | ||
Conservative hold | Swing | N/A | |||
Party | Candidate | Votes | % | ±% | |
---|---|---|---|---|---|
Labour | D. Craig | 3,759 | 76% | 31 | |
Conservative | P. Anderton * | 1,191 | 24% | 31 | |
Majority | 2,568 | 51.81% | |||
Registered electors | 12,120 | ||||
Turnout | 4,957 | 41% | 8 | ||
Rejected ballots | 7 | 0.14% | |||
Labour gain from Conservative | Swing | 55 | |||
Party | Candidate | Votes | % | ±% | |
---|---|---|---|---|---|
Labour | J. Duncan | 3,521 | 47% | 2 | |
Liberal | E. Sherlock | 3,161 | 42% | 28 | |
Conservative | M. Finlayson | 835 | 11% | 30 | |
Majority | 360 | 4.81% | |||
Registered electors | 14,949 | ||||
Turnout | 7,517 | 50% | 9 | ||
Rejected ballots | |||||
Labour hold | Swing | 2 | |||
Party | Candidate | Votes | % | ±% | |
---|---|---|---|---|---|
Conservative | Mrs. A. Berry * | 2,856 | 42% | 36 | |
Labour | R. Ledwith | 2,843 | 42% | 20 | |
Liberal | I. Grieg | 1,100 | 16% | N/A | |
Majority | 13 | 0.19% | |||
Registered electors | 15,964 | ||||
Turnout | 6,817 | 43% | 5 | ||
Rejected ballots | 13 | 0.19% | |||
Conservative hold | Swing | 36 | |||
Party | Candidate | Votes | % | ±% | |
---|---|---|---|---|---|
Labour | H.Glover | 2,083 | 66% | 27 | |
Conservative | Mrs. E. Jameson * | 767 | 24% | 30 | |
Liberal | P. Fitzmaurice | 299 | 9% | 2 | |
Majority | 1,316 | 41.71% | 26.51% | ||
Registered electors | 9,334 | ||||
Turnout | 3,155 | 34% | 1 | ||
Rejected ballots | 6 | 0.19% | |||
Labour gain from Conservative | Swing | 57 | |||
Party | Candidate | Votes | % | ±% | |
---|---|---|---|---|---|
Labour | J. Thompson | 2,561 | 72% | 29 | |
Liberal | W. Iley | 532 | 14% | 4 | |
Conservative | A. Taylor | 301 | 8% | 39 | |
Independent | I. Finney | 104 | 5% | N/A | |
Majority | 2,119 | 57.43% | |||
Registered electors | 12,857 | ||||
Turnout | 3,690 | 29% | 9 | ||
Rejected ballots | 22 | 0.60% | |||
Labour gain from Conservative | Swing | 68 | |||
Party | Candidate | Votes | % | ±% | |
---|---|---|---|---|---|
Labour | T. Talbot | 3,631 | 73% | 33 | |
Liberal | T. Gilligan | 989 | 20% | 1 | |
Conservative | R. Jones | 345 | 7% | 30 | |
Majority | 2,642 | 52.91% | |||
Registered electors | 16,479 | ||||
Turnout | 4,993 | 30% | |||
Rejected ballots | 28 | 0.56% | |||
Labour hold | Swing | 33 | |||
Party | Candidate | Votes | % | ±% | |
---|---|---|---|---|---|
Labour | T. Gadsden | 2,547 | 55% | 22 | |
Conservative | E. Jameson * | 1,602 | 35% | 28 | |
Liberal | P. Pennington | 467 | 10% | 6 | |
Majority | 945 | 20.43% | |||
Registered electors | 12,993 | ||||
Turnout | 4,626 | 36% | 4 | ||
Rejected ballots | 10 | 0.22% | |||
Labour gain from Conservative | Swing | 50 | |||
Party | Candidate | Votes | % | ±% | |
---|---|---|---|---|---|
Labour | J. Duncan | 1,589 | 69% | 33 | |
Conservative | W. Carter | 717 | 31% | 33 | |
Majority | 877 | 37.77% | |||
Registered electors | 6,694 | ||||
Turnout | 2,309 | 34% | 3 | ||
Rejected ballots | 3 | 0.13% | |||
Labour gain from Conservative | Swing | ||||
Party | Candidate | Votes | % | ±% | |
---|---|---|---|---|---|
Labour | G. Leyland | 2,672 | 75% | 20% | |
Conservative | M.Powell | 500 | 14% | 25 | |
Liberal | P. Dennington | 396 | 11% | 5 | |
Majority | 2,172 | 60.87% | 45.17 | ||
Registered electors | 16,507 | ||||
Turnout | 3,568 | 22% | 3 | ||
Rejected ballots | |||||
Labour hold | Swing | 20 | |||
Party | Candidate | Votes | % | ±% | |
---|---|---|---|---|---|
Conservative | G. Brownlow | 2,530 | 70% | 18 | |
Labour | K. Bamforth | 1,052 | 29% | 17 | |
Majority | 1,478 | 41.04% | 34.96 | ||
Registered electors | 10,260 | ||||
Turnout | 3,601 | 35% | 13 | ||
Rejected ballots | 19 | 0.53% | |||
Conservative hold | Swing | 18 | |||
Party | Candidate | Votes | % | ±% | |
---|---|---|---|---|---|
Labour | B. McCormick | 1,843 | 41% | 9% | |
Conservative | Mrs. Nellie Holley | 1,528 | 34% | 34 | |
Liberal | P. Thomas | 1,117 | 25% | N/A | |
Majority | 315 | 7% | |||
Registered electors | 11,255 | ||||
Turnout | 4,502 | 40% | 14 | ||
Rejected ballots | 14 | 0.31% | |||
Labour gain from Conservative | Swing | 43 | |||
Party | Candidate | Votes | % | ±% | |
---|---|---|---|---|---|
Conservative | I. Richmond | 2,466 | 53% | 27 | |
Labour | P. Holt | 1,380 | 30% | N/A | |
Liberal | P. Golby | 803 | 17% | 3 | |
Majority | 1,086 | 23.28% | |||
Registered electors | 9,942 | ||||
Turnout | 4,663 | 47% | 1 | ||
Rejected ballots | 14 | 0.30% | |||
Conservative hold | Swing | 27 | |||
Party | Candidate | Votes | % | ±% | |
---|---|---|---|---|---|
Labour | A. Rose | 2,512 | 58% | 17 | |
Conservative | E. A. Davies | 1,320 | 28% | 23 | |
Liberal | D. Cottrell | 623 | 14% | 6 | |
Majority | 1,302 | 29.96% | |||
Registered electors | 9,572 | ||||
Turnout | 4,346 | 45% | |||
Rejected ballots | 1 | 0.02% | |||
Labour gain from Conservative | Swing | 40 | |||
Party | Candidate | Votes | % | ±% | |
---|---|---|---|---|---|
Liberal | P. N. Gilchrist * | 3,714 | 51% | 6 | |
Labour | E. Williams | 2,170 | 30% | 10 | |
Conservative | M. Evans | 1,423 | 19% | 17 | |
Majority | 1,544 | 21.09% | 12.21 | ||
Registered electors | 13,866 | ||||
Turnout | 7,321 | 53% | 4 | ||
Rejected ballots | 14 | 0.19% | |||
Conservative hold | Swing | ||||
Party | Candidate | Votes | % | ±% | |
---|---|---|---|---|---|
Conservative | F. J. K. Williams * | 3,479 | 54% | 24 | |
Labour | J. Durrant | 1,666 | 26% | N/A | |
Liberal | M. Cody | 1,329 | 20% | 2 | |
Majority | 1,813 | 27.95% | 27.25 | ||
Registered electors | 14,511 | ||||
Turnout | 6,486 | 45% | 4 | ||
Rejected ballots | 12 | 0.19% | |||
Conservative hold | Swing | 24 | |||
Party | Candidate | Votes | % | ±% | |
---|---|---|---|---|---|
Labour | J. Stuart-Cole | 1,831 | 72% | 22 | |
Liberal | E.Rise | 404 | 16% | ||
Conservative | F. Dawson | 295 | 12% | 16 | |
Majority | 1,427 | 56.34% | 35.34 | ||
Registered electors | 7,016 | ||||
Turnout | 2,533 | 36% | 7% | ||
Rejected ballots | 3 | 0.12% | |||
Labour hold | Swing | 22 | |||
Party | Candidate | Votes | % | ±% | |
---|---|---|---|---|---|
Labour | P. Liddell | 1,944 | 68% | 24 | |
Conservative | H. Welsh * | 590 | 21% | 28 | |
Liberal | A. Brighouse | 299 | 11% | 4 | |
Majority | 1,354 | 47.71% | |||
Registered electors | 8,220 | ||||
Turnout | 3,535 | 43% | 10 | ||
Rejected ballots | 11 | 0.31% | |||
Labour gain from Conservative | Swing | 52 | |||
Party | Candidate | Votes | % | ±% | |
---|---|---|---|---|---|
Liberal | D. Boxer | 1,535 | 43% | 12 | |
Labour | N. Holbrook | 1,288 | 36% | 33 | |
Conservative | D. Esseen | 701 | 20% | 22 | |
Majority | 834 | 23.59% | |||
Registered electors | 8,220 | ||||
Turnout | 3,535 | 43% | 10 | ||
Rejected ballots | 11 | 0.31% | |||
Liberal hold | Swing | 12 | |||
Party | Candidate | Votes | % | ±% | |
---|---|---|---|---|---|
Labour | V. Ruck | 2,347 | 50% | 26 | |
Conservative | W. R. Baker * | 1,269 | 27% | 17 | |
Liberal | P. Lloyd | 1,082 | 23% | 9 | |
Majority | 1,078 | 22.95% | |||
Registered electors | 11,742 | ||||
Turnout | 4,698 | 40% | |||
Rejected ballots | |||||
Labour gain from Conservative | Swing | ||||
Party | Candidate | Votes | % | ±% | |
---|---|---|---|---|---|
Labour | J. McCabe | 2,034 | 63% | 5 | |
Liberal | R. Wood | 932 | 29% | 9 | |
Conservative | R. Owen | 263 | 8% | 14 | |
Majority | 1,771 | 54.73% | 18 | ||
Registered electors | 8,450 | ||||
Turnout | 3,236 | 38% | 6 | ||
Rejected ballots | 7 | 0.22% | |||
Labour hold | Swing | 5 | |||
Party | Candidate | Votes | % | ±% | |
---|---|---|---|---|---|
Liberal | A. Brame | 2,542 | 46% | 7 | |
Conservative | F. J. Morton * | 1,553 | 28% | 17 | |
Labour | A. Chape | 1,258 | 23% | 11 | |
The Ecology Party | J. Bell | 111 | 2% | ||
Majority | 989 | 18.07% | 11.6 | ||
Registered electors | 12,820 | ||||
Turnout | 5,474 | 43% | 5 | ||
Rejected ballots | 10 | 0.18% | |||
Liberal gain from Conservative | Swing | ||||
Party | Candidate | Votes | % | ±% | |
---|---|---|---|---|---|
Labour | W. Gamet | 3,556 | 55% | 29 | |
Conservative | A. E. Wise * | 2,827 | 44% | 21 | |
Majority | 729 | 11.37% | 27.63 | ||
Registered electors | 15,087 | ||||
Turnout | 6,412 | 43% | 8 | ||
Rejected ballots | 29 | 0.45% | |||
Labour gain from Conservative | Swing | ||||
Party | Candidate | Votes | % | ±% | |
---|---|---|---|---|---|
Labour | D. Kean | 4,565 | 56% | 24 | |
Conservative | I. Allison | 1,975 | 24% | 37 | |
Liberal | E. Copestake | 1,558 | 19% | 12 | |
Majority | 2,590 | 31.97% | 2.97 | ||
Registered electors | 21,431 | ||||
Turnout | 8,101 | 38% | 5 | ||
Rejected ballots | 3 | 0.04% | |||
Labour gain from Conservative | Swing | ||||
Party | Candidate | Votes | % | ±% | |
---|---|---|---|---|---|
Conservative | R. Stretch | 3,205 | 62% | 20 | |
Liberal | N. Blackwood | 1,127 | 22% | 17 | |
Labour | I. Travis | 793 | 15% | 6 | |
Majority | 2,078 | 40.5% | 32.1 | ||
Registered electors | 14,173 | ||||
Turnout | 5,131 | 36% | 7 | ||
Rejected ballots | 6 | 0.12% | |||
Conservative hold | Swing | 20 | |||
Party | Candidate | Votes | % | ±% | |
---|---|---|---|---|---|
Conservative | J. W. Last * | 2,754 | 58% | 20 | |
Liberal | P. Barker | 1,392 | 30% | 15 | |
Labour | J. Robb | 556 | 12% | 5 | |
Majority | 1,362 | 28.87% | 32.63 | ||
Registered electors | 12,127 | ||||
Turnout | 4,717 | 39% | 10 | ||
Rejected ballots | 15 | 0.32% | |||
Conservative hold | Swing | 20 | |||
Party | Candidate | Votes | % | ±% | |
---|---|---|---|---|---|
Labour | J. George | 2,611 | 64% | 20 | |
Conservative | A. Downie | 821 | 20% | 27 | |
Liberal | B. Thomas | 656 | 16% | 10 | |
Majority | 1,790 | 43.79% | 40.13 | ||
Registered electors | 11,915 | ||||
Turnout | 4,088 | 34% | 2 | ||
Rejected ballots | |||||
Labour party (UK) gain from Conservative | Swing | ||||
Party | Candidate | Votes | % | ±% | |
---|---|---|---|---|---|
Labour | D. Mason | 2,154 | 45% | 18 | |
Conservative | K. Young | 1,713 | 35% | 28 | |
Liberal | M. Canning | 827 | 17% | 7 | |
British Democratic Party | R. Eccleston | 132 | 3% | N/A | |
Majority | 441 | 9.12% | 27.33 | ||
Registered electors | 12,692 | ||||
Turnout | 4,836 | 38% | 2.16 | ||
Rejected ballots | 10 | 0.21% | 0.13 | ||
Labour gain from Conservative | Swing | ||||
Party | Candidate | Votes | % | ±% | |
---|---|---|---|---|---|
Labour | R. Patterson | 1,564 | 50% | 21 | |
Conservative | D. Williams | 1,035 | 33% | 33 | |
Liberal | J. C. Jenkins | 506 | 16% | 11 | |
Majority | 529 | 17.02% | 19.12 | ||
Registered electors | 8,180 | ||||
Turnout | 3,108 | 38% | 4 | ||
Rejected ballots | 3 | 0.10% | |||
Labour gain from Conservative | Swing | ||||
Party | Candidate | Votes | % | ±% | |
---|---|---|---|---|---|
Conservative | M. F. Emberton * | 3,687 | 61% | 8 | |
Liberal | I. Horton | 1,299 | 21% | 5 | |
Labour | V. McGee | 1,085 | 18% | 14 | |
Majority | 2,388 | 39.24% | 4.01 | ||
Registered electors | 14,217 | ||||
Turnout | 6,085 | 43% | 10 | ||
Rejected ballots | 14 | 0.23% | |||
Conservative hold | Swing | 8 | |||
Party | Candidate | Votes | % | ±% | |
---|---|---|---|---|---|
Conservative | K. W. Porter * | 1,883 | 49% | 27 | |
Labour | J. Fairbrother | 1,118 | 29% | 14 | |
Liberal | J. Canning | 689 | 18% | 9 | |
British Democratic Party | R. Lloyd-Parry | 132 | 3% | N/A | |
Majority | 765 | 20% | 41.56 | ||
Registered electors | 11.316 | ||||
Turnout | 3,825 | 34% | 3 | ||
Rejected ballots | 3 | 0.08% | |||
Conservative hold | Swing | 27 | |||
Party | Candidate | Votes | % | ±% | |
---|---|---|---|---|---|
Labour | J. Gershman * | 2,200 | 71% | 25 | |
Conservative | A. Adams | 590 | 19% | 25 | |
Liberal | D. Bentley | 300 | 10% | 2 | |
Majority | 1,610 | 52% | 47.98 | ||
Registered electors | 10,638 | ||||
Turnout | 3,096 | 29% | 5 | ||
Rejected ballots | 6 | 0.19% | |||
Labour hold | Swing | 25 | |||
Party | Candidate | Votes | % | ±% | |
---|---|---|---|---|---|
Conservative | J. C. Smyth * | 3,696 | 83% | 5 | |
Labour | R. Harris | 724 | 16% | 7 | |
Majority | 2,972 | 66.92% | 14.82 | ||
Registered electors | 11,594 | ||||
Turnout | 4,441 | 38% | 8 | ||
Rejected ballots | 21 | 0.47% | |||
Conservative hold | Swing | 5 | |||
Party | Candidate | Votes | % | ±% | |
---|---|---|---|---|---|
Conservative | M. Lavender | 1,928 | 51% | 25 | |
Liberal | A. Conway | 941 | 25% | 16 | |
Labour | A. Rea | 886 | 24% | 9 | |
Majority | 1,042 | 27.71% | 33.92 | ||
Registered electors | 10,189 | ||||
Turnout | 3,760 | 37% | 9 | ||
Rejected ballots | 5 | 0.13% | |||
Conservative hold | Swing | 25 | |||
The 2002 St Helens Metropolitan Borough Council election took place on 2 May 2002 to elect members of St Helens Metropolitan Borough Council in Merseyside, England. One third of the council was up for election and the Labour Party stayed in overall control of the council.
Sefton Metropolitan Borough Council elections are generally held three years out of every four, with a third of the council being elected each time. Sefton Metropolitan Borough Council, generally known as Sefton Council, is the local authority for the metropolitan borough of Sefton in Merseyside, England. Since the last boundary changes in 2004, 66 councillors have been elected from 22 wards.
Elections to Liverpool City Council were held on 3 May 1972. One seat in each of the forty wards was up for election, plus one by-election seat each in Vauxhall and Woolton wards. This was the last year when the council comprised 120 councillors and 40 Aldermen, totalling 160, which was the largest council membership .
Elections to Liverpool City Council were held on 13 May 1971.
Elections to Liverpool City Council were held on 7 May 1970.
Elections to Liverpool City Council were held on 8 May 1969.
Elections to Liverpool City Council were held on Thursday 9 May 1968.
Elections to Liverpool City Council were held on Thursday 12 May 1966.
Elections to Liverpool City Council were held on 13 May 1965.
Elections to Liverpool City Council were held on 7 May 1964.
Elections to Liverpool City Council were held on 9 May 1963.
Elections to Liverpool City Council were held on 12 May 1960.
Elections to Liverpool City Council were held on 7 May 1959.
Elections to Liverpool City Council were held on 8 May 1958.
Elections to Liverpool City Council were held on Thursday 9 May 1957.
Elections to Liverpool City Council were held on Thursday, 10 May 1956.
Elections to Liverpool City Council were held on 13 May 1954. After the election, the composition of the council was:
Elections to Liverpool City Council were held on 8 May 1952.
The 1977 Merseyside County Council election took place on 5 May 1977 to elect members of Merseyside County Council in England. This was on the same day as other local elections.
The 1973 Merseyside County Council election took place on 12 April 1973 to elect members of Merseyside County Council in England. This was on the same day as other local elections.