| |||||||||||||||||||||||||||||||||||||||||
| |||||||||||||||||||||||||||||||||||||||||
All 99 seats to Merseyside County Council 50 seats needed for a majority | |||||||||||||||||||||||||||||||||||||||||
---|---|---|---|---|---|---|---|---|---|---|---|---|---|---|---|---|---|---|---|---|---|---|---|---|---|---|---|---|---|---|---|---|---|---|---|---|---|---|---|---|---|
Turnout | 35.6% (1.1%) [1] | ||||||||||||||||||||||||||||||||||||||||
| |||||||||||||||||||||||||||||||||||||||||
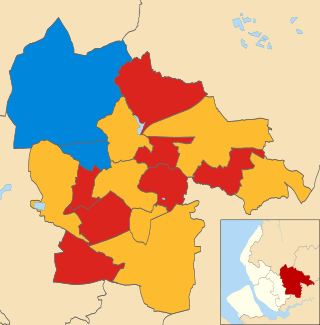
Map of Merseyside County Council showing wards won by party [2] | |||||||||||||||||||||||||||||||||||||||||
|
The 1977 Merseyside County Council election took place on 5 May 1977 to elect members of Merseyside County Council in England. [1] This was on the same day as other local elections.
The Conservative Party gained overall control of the council from Labour.
Overall result compared with 1973.
Merseyside County Council election, 1977 | |||||||||||||||
---|---|---|---|---|---|---|---|---|---|---|---|---|---|---|---|
Party | Candidates | Votes | |||||||||||||
Stood | Elected | Gained | Unseated | Net | % of total | % | No. | Net % | |||||||
Conservative | 99 | 67 | 41 | 0 | 41 | 67.7 | 55.1 | 224,376 | 21.4 | ||||||
Labour | 93 | 26 | 0 | 27 | 27 | 26.3 | 27.4 | 111,733 | 13.9 | ||||||
Liberal | 78 | 6 | 1 | 14 | 13 | 6.1 | 16.3 | 66,579 | 5.5 | ||||||
Communist | 19 | 0 | 0 | 0 | 0 | 0.0 | 0.6 | 2,425 | 0.1 | ||||||
Ind. Conservative | 1 | 0 | 0 | 0 | 0 | 0.0 | 0.2 | 765 | 0.1 | ||||||
Independent | 1 | 0 | 0 | 0 | 0 | 0.0 | 0.1 | 465 | 0.1 | ||||||
National Party | 3 | 0 | 0 | 0 | 0 | 0.0 | 0.1 | 392 | New | ||||||
National Front | 3 | 0 | 0 | 0 | 0 | 0.0 | 0.1 | 228 | New | ||||||
Labour/Liberal | 1 | 0 | 0 | 0 | 0 | 0.0 | 0.0 | 86 | New | ||||||
Independent Liberal | 1 | 0 | 0 | 0 | 0 | 0.0 | 0.0 | 83 | N/A | ||||||
Anti-corruption League | 1 | 0 | 0 | 0 | 0 | 0.0 | 0.0 | 60 | New | ||||||
Liberal Union | 1 | 0 | 0 | 0 | 0 | 0.0 | 0.0 | 59 | New | ||||||
Independent Labour | 1 | 0 | 0 | 0 | 0 | 0.0 | 0.0 | 45 | N/A | ||||||
Residents | 0 | 0 | 0 | 1 | 1 | 0.0 | 0.0 | 0 | 1.9 | ||||||
Merseyside County Council election, 1977 (Knowsley) | |||||||||||||||
---|---|---|---|---|---|---|---|---|---|---|---|---|---|---|---|
Party | Candidates | Votes | |||||||||||||
Stood | Elected | Gained | Unseated | Net | % of total | % | No. | Net % | |||||||
Conservative | 11 | 4 | 3 | 0 | 3 | 36.4 | 48.5 | 18,095 | 23.3 | ||||||
Labour | 11 | 7 | 0 | 3 | 3 | 63.6 | 44.8 | 16,747 | 16.5 | ||||||
Liberal | 3 | 0 | 0 | 0 | 0 | 0.0 | 3.4 | 1,272 | 8.1 | ||||||
Ind. Conservative | 1 | 0 | 0 | 0 | 0 | 0.0 | 2.0 | 765 | N/A | ||||||
Communist | 3 | 0 | 0 | 0 | 0 | 0.0 | 1.1 | 422 | 0.9 | ||||||
Independent Labour | 1 | 0 | 0 | 0 | 0 | 0.0 | 0.1 | 45 | N/A | ||||||
Turnout: 29.8% (1.7%)
Merseyside County Council election, 1977 (Liverpool) | |||||||||||||||
---|---|---|---|---|---|---|---|---|---|---|---|---|---|---|---|
Party | Candidates | Votes | |||||||||||||
Stood | Elected | Gained | Unseated | Net | % of total | % | No. | Net % | |||||||
Conservative | 36 | 23 | 19 | 0 | 19 | 63.9 | 47.0 | 64,528 | 17.9 | ||||||
Labour | 36 | 10 | 0 | 8 | 8 | 27.8 | 28.2 | 38,754 | 11.8 | ||||||
Liberal | 34 | 3 | 0 | 11 | 11 | 8.3 | 23.5 | 32,314 | 5.9 | ||||||
Communist | 9 | 0 | 0 | 0 | 0 | 0.0 | 0.9 | 1,247 | 0.5 | ||||||
National Party | 1 | 0 | 0 | 0 | 0 | 0.0 | 0.1 | 162 | New | ||||||
National Front | 2 | 0 | 0 | 0 | 0 | 0.0 | 0.1 | 95 | New | ||||||
Labour/Liberal | 1 | 0 | 0 | 0 | 0 | 0.0 | 0.1 | 86 | New | ||||||
Independent Liberal | 1 | 0 | 0 | 0 | 0 | 0.0 | 0.1 | 83 | N/A | ||||||
Liberal Union | 1 | 0 | 0 | 0 | 0 | 0.0 | 0.0 | 59 | New | ||||||
Turnout: 33.9% (0.5%)
Merseyside County Council election, 1977 (Sefton) | |||||||||||||||
---|---|---|---|---|---|---|---|---|---|---|---|---|---|---|---|
Party | Candidates | Votes | |||||||||||||
Stood | Elected | Gained | Unseated | Net | % of total | % | No. | Net % | |||||||
Conservative | 19 | 15 | 4 | 0 | 4 | 78.9 | 63.7 | 47,794 | 20.9 | ||||||
Labour | 15 | 3 | 0 | 3 | 3 | 15.8 | 20.2 | 15,160 | 10.5 | ||||||
Liberal | 13 | 1 | 0 | 0 | 0 | 5.3 | 14.7 | 11,002 | 0.8 | ||||||
Communist | 4 | 0 | 0 | 0 | 0 | 0.0 | 0.7 | 512 | 0.4 | ||||||
Independent | 1 | 0 | 0 | 0 | 0 | 0.0 | 0.6 | 465 | 0.3 | ||||||
Anti-corruption League | 1 | 0 | 0 | 0 | 0 | 0.0 | 0.1 | 60 | New | ||||||
Residents | 0 | 0 | 0 | 1 | 1 | 0.0 | 0.0 | 0 | 9.0 | ||||||
Turnout: 34.0% (6.0%)
Merseyside County Council election, 1977 (St Helens) | |||||||||||||||
---|---|---|---|---|---|---|---|---|---|---|---|---|---|---|---|
Party | Candidates | Votes | |||||||||||||
Stood | Elected | Gained | Unseated | Net | % of total | % | No. | Net % | |||||||
Conservative | 11 | 8 | 6 | 0 | 6 | 72.7 | 58.0 | 29,725 | 30.1 | ||||||
Labour | 11 | 3 | 0 | 6 | 6 | 27.3 | 36.4 | 18,665 | 19.7 | ||||||
Liberal | 6 | 0 | 0 | 0 | 0 | 0.0 | 5.6 | 2,850 | 9.4 | ||||||
Turnout: 37.3% (2.9)
Merseyside County Council election, 1977 (Wirral) | |||||||||||||||
---|---|---|---|---|---|---|---|---|---|---|---|---|---|---|---|
Party | Candidates | Votes | |||||||||||||
Stood | Elected | Gained | Unseated | Net | % of total | % | No. | Net % | |||||||
Conservative | 22 | 17 | 9 | 0 | 9 | 77.3 | 60.4 | 64,234 | 21.8 | ||||||
Labour | 20 | 3 | 0 | 7 | 7 | 13.6 | 21.1 | 22,407 | 16.5 | ||||||
Liberal | 22 | 2 | 1 | 3 | 2 | 9.1 | 18.0 | 19,141 | 5.0 | ||||||
Communist | 3 | 0 | 0 | 0 | 0 | 0.0 | 0.2 | 244 | 0.0 | ||||||
National Party | 2 | 0 | 0 | 0 | 0 | 0.0 | 0.2 | 230 | New | ||||||
National Front | 1 | 0 | 0 | 0 | 0 | 0.0 | 0.1 | 133 | New | ||||||
Turnout: 41.8% (0.7)
Results compared directly with the last local election in 1973.
Party | Candidate | Votes | % | ±% | |
---|---|---|---|---|---|
Labour | P. Longfall | 1,126 | 59.6 | 23.4 | |
Conservative | A. Gray | 762 | 40.4 | 26.7 | |
Majority | 364 | 19.2 | 50.1 | ||
Registered electors | 9,236 | ||||
Turnout | 20.5 | 5.8 | |||
Labour hold | Swing | 25.1 |
Party | Candidate | Votes | % | ±% | |
---|---|---|---|---|---|
Conservative | J. Easthope | 1,562 | 54.8 | 32.5 | |
Labour | C. Frederick | 1,288 | 45.2 | 6.7 | |
Majority | 274 | 9.6 | N/A | ||
Registered electors | 9,067 | ||||
Turnout | 31.5 | 5.7 | |||
Conservative gain from Labour | Swing | 18.9 |
Party | Candidate | Votes | % | ±% | |
---|---|---|---|---|---|
Conservative | W. Simpson | 4,056 | 77.0 | 32.1 | |
Labour | S. Wells | 1,209 | 23.0 | 10.8 | |
Majority | 2,847 | 54.0 | 42.9 | ||
Registered electors | 13,192 | ||||
Turnout | 40.0 | 4.7 | |||
Conservative hold | Swing | 21.5 |
Party | Candidate | Votes | % | ±% | |
---|---|---|---|---|---|
Labour | S. Powell | 1,718 | 53.2 | 11.9 | |
Conservative | C. White | 1,514 | 46.8 | 24.4 | |
Majority | 204 | 6.4 | 36.3 | ||
Registered electors | 11,192 | ||||
Turnout | 28.9 | 4.9 | |||
Labour hold | Swing | 18.2 |
Party | Candidate | Votes | % | ±% | |
---|---|---|---|---|---|
Labour | J. King | 1,450 | 56.1 | 10.6 | |
Conservative | G. Fogarty | 627 | 24.3 | New | |
Liberal | R. Jones | 349 | 13.5 | 15.0 | |
Communist | J. Myers | 112 | 4.3 | 0.6 | |
Independent Labour | T. Ryan | 45 | 1.7 | New | |
Majority | 823 | 31.8 | 6.4 | ||
Registered electors | 10,246 | ||||
Turnout | 25.3 | 0.6 | |||
Labour hold | Swing | 3.2 |
Party | Candidate | Votes | % | ±% | |
---|---|---|---|---|---|
Labour | J. Gallagher | 1,431 | 45.2 | 8.1 | |
Conservative | J. Smith | 1,088 | 34.8 | 30.7 | |
Liberal | W. McFadden | 510 | 16.3 | 22.4 | |
Communist | W. Jones | 116 | 3.7 | 0.2 | |
Majority | 325 | 10.4 | 4.2 | ||
Registered electors | 11,187 | ||||
Turnout | 28.1 | 5.2 | |||
Labour hold | Swing | 2.1 |
Party | Candidate | Votes | % | ±% | |
---|---|---|---|---|---|
Labour | G. Bundred | 1,983 | 52.5 | 20.1 | |
Conservative | C. Baily | 1,187 | 31.4 | 12.4 | |
Liberal | J. Smith | 413 | 10.9 | New | |
Communist | T. Bradburn | 194 | 5.1 | 3.4 | |
Majority | 796 | 21.1 | 32.5 | ||
Registered electors | 15,378 | ||||
Turnout | 3,777 | 24.6 | 3.9 | ||
Labour hold | Swing | 16.3 |
Party | Candidate | Votes | % | ±% | |
---|---|---|---|---|---|
Conservative | W. Hughes | 1,888 | 57.7 | 18.9 | |
Labour | W. Howarth | 1,386 | 42.3 | 18.9 | |
Majority | 502 | 15.4 | N/A | ||
Registered electors | 8,654 | ||||
Turnout | 37.9 | 4.8 | |||
Conservative gain from Labour | Swing | 18.9 |
Party | Candidate | Votes | % | ±% | |
---|---|---|---|---|---|
Labour | R. Foulkes | 1,444 | 40.1 | 25.5 | |
Conservative | S. Pyne | 1,390 | 38.6 | 4.2 | |
Ind. Conservative | B. Jeffrey | 765 | 21.3 | New | |
Majority | 54 | 1.5 | 29.7 | ||
Registered electors | 11,132 | ||||
Turnout | 32.6 | 2.2 | |||
Labour hold | Swing | 14.9 |
Party | Candidate | Votes | % | ±% | |
---|---|---|---|---|---|
Conservative | J. Sinclair | 2,488 | 54.3 | 26.7 | |
Labour | J. Bohanna | 2,094 | 45.7 | 26.7 | |
Majority | 394 | 8.6 | 36.2 | ||
Registered electors | 14,426 | ||||
Turnout | 31.8 | 2.5 | |||
Conservative gain from Labour | Swing | 26.7 |
Party | Candidate | Votes | % | ±% | |
---|---|---|---|---|---|
Labour | W. Alldritt | 1,618 | 51.3 | 19.5 | |
Conservative | T. Maudsley | 1,533 | 48.7 | 29.4 | |
Majority | 85 | 2.6 | 48.9 | ||
Registered electors | 11,914 | ||||
Turnout | 26.5 | 1.2 | |||
Labour hold | Swing | 24.5 |
Party | Candidate | Votes | % | ±% | |
---|---|---|---|---|---|
Labour | H. Carr | 1,401 | 57.4 | 21.7 | |
Conservative | D. Lewis | 555 | 22.8 | 11.0 | |
Communist | R. O'Hara | 253 | 10.4 | 1.3 | |
Liberal | P. Bradley | 144 | 5.9 | New | |
Labour/Liberal | J. Murphy | 86 | 3.5 | New | |
Majority | 846 | 34.6 | 32.7 | ||
Registered electors | 12,892 | ||||
Turnout | 19.0 | 3.8 | |||
Labour hold | Swing | 16.4 |
Party | Candidate | Votes | % | ±% | |
---|---|---|---|---|---|
Conservative | S. Moss | 5,159 | 73.7 | 5.1 | |
Liberal | P. Message | 1,116 | 15.9 | New | |
Labour | J. Hughes | 727 | 10.4 | 10.8 | |
Majority | 4,043 | 57.8 | 0.2 | ||
Registered electors | 14,729 | ||||
Turnout | 7,002 | 47.7 | 11.7 | ||
Conservative hold | Swing | 0.1 |
Party | Candidate | Votes | % | ±% | |
---|---|---|---|---|---|
Conservative | W. Weaver | 3,365 | 73.0 | 17.8 | |
Liberal | T. Harte | 651 | 14.1 | 14.0 | |
Labour | T. McManus | 592 | 12.8 | 3.9 | |
Majority | 2,714 | 58.9 | 31.8 | ||
Registered electors | 10,683 | ||||
Turnout | 43.2 | 4.4 | |||
Conservative hold | Swing | 15.9 |
Party | Candidate | Votes | % | ±% | |
---|---|---|---|---|---|
Conservative | T. Pink | 2,316 | 49.3 | 21.4 | |
Labour | F. McGurk | 1,497 | 31.8 | 6.9 | |
Liberal | J. Wilmington | 889 | 18.9 | 14.5 | |
Majority | 819 | 17.5 | N/A | ||
Registered electors | 12,682 | ||||
Turnout | 37.1 | 2.5 | |||
Conservative gain from Labour | Swing | 11.4 |
Party | Candidate | Votes | % | ±% | |
---|---|---|---|---|---|
Conservative | H. Quayle | 1,872 | 42.7 | 21.1 | |
Liberal | G. Scattergood | 1,457 | 33.2 | 25.1 | |
Labour | F. Roderick | 885 | 20.2 | 0.1 | |
Communist | J. Kay | 171 | 3.9 | New | |
Majority | 415 | 9.5 | 27.2 | ||
Registered electors | 13,612 | ||||
Turnout | 32.3 | 1.2 | |||
Conservative gain from Liberal | Swing | 23.1 |
Party | Candidate | Votes | % | ±% | |
---|---|---|---|---|---|
Conservative | J. Butterfield | 1,346 | 40.6 | 22.1 | |
Labour | G. Pratt | 1,023 | 30.8 | 4.9 | |
Liberal | F. Nevin | 950 | 28.6 | 17.2 | |
Majority | 323 | 9.8 | N/A | ||
Registered electors | 12,035 | ||||
Turnout | 27.6 | 2.0 | |||
Conservative gain from Liberal | Swing | 10.0 |
Party | Candidate | Votes | % | ±% | |
---|---|---|---|---|---|
Labour | B. Wright | 2,170 | 45.3 | 24.9 | |
Liberal | R. Cooper | 1,864 | 38.9 | 23.0 | |
Conservative | C. Winter | 753 | 15.7 | 2.0 | |
Majority | 306 | 6.4 | N/A | ||
Registered electors | 12,124 | ||||
Turnout | 39.5 | 2.2 | |||
Labour gain from Liberal | Swing | 24.0 |
Party | Candidate | Votes | % | ±% | |
---|---|---|---|---|---|
Labour | J. Parry | 1,518 | 61.6 | 14.3 | |
Conservative | W. Gerrard | 663 | 26.9 | 12.2 | |
National Party | M. Holme | 162 | 6.6 | New | |
Liberal | J. Kelly | 120 | 4.9 | New | |
Majority | 855 | 34.7 | 26.5 | ||
Registered electors | 11,676 | ||||
Turnout | 21.2 | 1.9 | |||
Labour hold | Swing | 13.3 |
Party | Candidate | Votes | % | ±% | |
---|---|---|---|---|---|
Conservative | C. Henry De Boer | 5,490 | 68.7 | 33.0 | |
Conservative | M. Wood | 5,202 | – | – | |
Liberal | P. Hodgson | 1,333 | 16.7 | 35.0 | |
Liberal | F. Ricketts | 1,190 | – | – | |
Labour | F. Dunne | 1,163 | 14.6 | 2.0 | |
Labour | J. Roberts | 1,123 | – | – | |
Majority | 4,157 | 52.0 | N/A | ||
Registered electors | 20,372 | ||||
Turnout | 39.4 | 4.0 | |||
Conservative gain from Liberal | Swing | 34.0 | |||
Conservative gain from Liberal | Swing | – |
Party | Candidate | Votes | % | ±% | |
---|---|---|---|---|---|
Conservative | H. Bolton-Jones | 3,607 | 51.2 | 20.3 | |
Liberal | J. Bradley | 2,900 | 41.1 | 21.9 | |
Labour | T. Roberts | 543 | 7.7 | 1.6 | |
Majority | 707 | 10.1 | N/A | ||
Registered electors | 15,016 | ||||
Turnout | 47.1 | 1.4 | |||
Conservative gain from Liberal | Swing | 21.1 |
Party | Candidate | Votes | % | ±% | |
---|---|---|---|---|---|
Conservative | S. Hicklin | 1,512 | 38.8 | 16.3 | |
Liberal | J. Bowen | 1,353 | 34.8 | 7.1 | |
Labour | P. Rowlands | 1,028 | 26.4 | 9.2 | |
Majority | 159 | 4.0 | N/A | ||
Registered electors | 10,382 | ||||
Turnout | 37.6 | 8.1 | |||
Conservative gain from Liberal | Swing | 5.2 |
Party | Candidate | Votes | % | ±% | |
---|---|---|---|---|---|
Conservative | W. Thomas | 1,686 | 39.5 | 1.4 | |
Liberal | P. Clark | 1,360 | 31.9 | New | |
Labour | J. McLean | 1,223 | 28.6 | 30.5 | |
Majority | 326 | 7.6 | N/A | ||
Registered electors | 11,938 | ||||
Turnout | 35.8 | 3.4 | |||
Conservative gain from Labour | Swing | 12.9 |
Party | Candidate | Votes | % | ±% | |
---|---|---|---|---|---|
Conservative | E. Fitzpatrick | 3,200 | 54.3 | 28.6 | |
Liberal | G. Holmes | 1,923 | 32.6 | 27.6 | |
Labour | J. Hudson | 773 | 13.1 | 0.9 | |
Majority | 1,277 | 21.7 | N/A | ||
Registered electors | 12,244 | ||||
Turnout | 48.2 | 1.6 | |||
Conservative gain from Liberal | Swing | 28.1 |
Party | Candidate | Votes | % | ±% | |
---|---|---|---|---|---|
Labour | M. Evans | 980 | 54.1 | 10.0 | |
Conservative | J. Watson | 591 | 32.7 | 15.2 | |
Liberal | K. Osborne | 163 | 9.0 | 5.9 | |
Communist | J. Greig | 76 | 4.2 | 0.7 | |
Majority | 389 | 21.5 | 25.1 | ||
Registered electors | 7,295 | ||||
Turnout | 24.9 | 5.5 | |||
Labour hold | Swing | 12.6 |
Party | Candidate | Votes | % | ±% | |
---|---|---|---|---|---|
Conservative | J. Walsh | 2,141 | 46.0 | 14.2 | |
Labour | W. Burke | 1,919 | 41.3 | 26.9 | |
Liberal | Rosemary Cooper | 591 | 12.7 | New | |
Majority | 222 | 4.7 | N/A | ||
Registered electors | 16,140 | ||||
Turnout | 28.9 | 2.2 | |||
Conservative gain from Labour | Swing | 20.6 |
Party | Candidate | Votes | % | ±% | |
---|---|---|---|---|---|
Conservative | J. Davis | 1,219 | 38.2 | 16.5 | |
Liberal | I. Bale | 1,091 | 34.2 | 7.7 | |
Labour | S. Gorman | 831 | 26.1 | 10.2 | |
National Front | M. Dover | 49 | 1.5 | New | |
Majority | 128 | 4.0 | N/A | ||
Registered electors | 10,274 | ||||
Turnout | 31.1 | 4.0 | |||
Conservative gain from Liberal | Swing | 4.0 |
Party | Candidate | Votes | % | ±% | |
---|---|---|---|---|---|
Conservative | A. Brown | 1,938 | 43.5 | 0.5 | |
Labour | A. Williams | 1,305 | 29.3 | 27.7 | |
Liberal | N. Cardwell | 1,215 | 27.3 | New | |
Majority | 633 | 14.2 | N/A | ||
Registered electors | 11,497 | ||||
Turnout | 38.9 | 4.7 | |||
Conservative gain from Labour | Swing | 14.1 |
Party | Candidate | Votes | % | ±% | |
---|---|---|---|---|---|
Labour | Edward Loyden | 2,457 | 59.7 | 18.7 | |
Labour | K. Stewart | 2,144 | – | – | |
Conservative | P. Dougherty | 1,658 | 40.3 | 18.7 | |
Conservative | P. Ferris | 1,637 | – | – | |
Majority | 799 | 19.4 | 37.4 | ||
Registered electors | 19,140 | ||||
Turnout | 23.4 | 0.6 | |||
Labour hold | Swing | 18.7 | |||
Labour hold | Swing | – |
Party | Candidate | Votes | % | ±% | |
---|---|---|---|---|---|
Labour | Margaret Simey | 1,545 | 47.2 | 21.0 | |
Conservative | T. Staniford | 1,179 | 36.0 | 9.3 | |
Liberal | A. Damsell | 376 | 11.5 | New | |
Communist | M. McClelland | 175 | 5.3 | 0.1 | |
Majority | 366 | 11.2 | 30.3 | ||
Registered electors | 13,467 | ||||
Turnout | 23.4 | 1.9 | |||
Labour hold | Swing | 15.2 |
Party | Candidate | Votes | % | ±% | |
---|---|---|---|---|---|
Liberal | F. Doran | 1,340 | 58.2 | 0.6 | |
Labour | J. Stamper | 510 | 22.1 | 9.8 | |
Conservative | H. Davies | 450 | 19.7 | 10.4 | |
Majority | 830 | 36.0 | 9.2 | ||
Registered electors | 6,525 | ||||
Turnout | 35.4 | 4.7 | |||
Liberal hold | Swing | 4.6 |
Party | Candidate | Votes | % | ±% | |
---|---|---|---|---|---|
Liberal | N. Caple | 1,507 | 53.9 | 15.8 | |
Labour | J. Devaney | 892 | 31.9 | 5.8 | |
Conservative | D. Jones | 350 | 12.5 | 8.3 | |
National Front | S. Hamilton | 46 | 1.6 | New | |
Majority | 615 | 22.0 | 21.6 | ||
Registered electors | 8,453 | ||||
Turnout | 33.1 | 0.4 | |||
Liberal hold | Swing | 10.8 |
Party | Candidate | Votes | % | ±% | |
---|---|---|---|---|---|
Labour | B. Shaw | 1,184 | 59.4 | 13.4 | |
Conservative | W. Gilbody | 632 | 31.7 | 4.5 | |
Liberal | R. McNally | 177 | 8.9 | New | |
Majority | 552 | 27.7 | 17.9 | ||
Registered electors | 7,755 | ||||
Turnout | 25.8 | 3.0 | |||
Labour hold | Swing | 9.0 |
Party | Candidate | Votes | % | ±% | |
---|---|---|---|---|---|
Conservative | W. Bradshaw | 2,044 | 41.4 | 24.3 | |
Liberal | D. Jones | 1,780 | 36.1 | 19.8 | |
Labour | D. Krumbein | 904 | 18.3 | 7.4 | |
Communist | H. Mohin | 124 | 2.5 | New | |
Independent Liberal | W. McCullough | 83 | 1.7 | 0.4 | |
Majority | 264 | 5.3 | N/A | ||
Registered electors | 12,771 | ||||
Turnout | 38.7 | 4.8 | |||
Conservative gain from Liberal | Swing | 17.8 |
Party | Candidate | Votes | % | ±% | |
---|---|---|---|---|---|
Liberal | P. Mahon * | 1,973 | 43% | ||
Conservative | W. McGuirk | 1,285 | 28% | ||
Labour | Robert Wareing | 1,223 | 27% | ||
Communist | J. G. Volleamere | 78 | 2% | ||
Majority | 688 | ||||
Registered electors | 12,225 | ||||
Turnout | 4,559 | 37.3% | |||
Liberal hold | Swing |
Party | Candidate | Votes | % | ±% | |
---|---|---|---|---|---|
Conservative | I. Brown | 2,393 | 47% | ||
Labour | H. Dalton | 2,302 | 45% | ||
Liberal | D. P. J. Turner | 413 | 8% | ||
Majority | 91 | ||||
Registered electors | 16,059 | ||||
Turnout | 5,108 | 32% | |||
Conservative gain from | Swing |
Party | Candidate | Votes | % | ±% | |
---|---|---|---|---|---|
Conservative | F. S. Hughes | 1,403 | 46% | ||
Labour | G. J. Maudsley | 1,191 | 39% | ||
Liberal | C. J. Lister | 354 | 12% | ||
Communist | R. Ross | 94 | 3% | ||
Liberal Union | S. J. Naden | 59 | 2% | ||
Majority | 212 | ||||
Registered electors | 10,105 | ||||
Turnout | 3,042 | 30% | |||
Conservative gain from | Swing |
Party | Candidate | Votes | % | ±% | |
---|---|---|---|---|---|
Conservative | R. S. Jones | 1,647 | 46% | ||
Liberal | Richard Kemp | 1,316 | 37% | ||
Labour | D. Ralston | 634 | 18% | ||
Majority | 331 | ||||
Registered electors | 10,693 | ||||
Turnout | 3,597 | 34% | |||
Conservative gain from | Swing |
Party | Candidate | Votes | % | ±% | |
---|---|---|---|---|---|
Labour | W. H. Sefton * | 1,453 | 80% | ||
Conservative | K. B. Jacques | 238 | 13% | ||
Liberal | R. J. Cunningham | 128 | 7% | ||
Majority | 1,215 | 67% | |||
Registered electors | 10,501 | ||||
Turnout | 1,819 | 17% | |||
Labour hold | Swing |
Party | Candidate | Votes | % | ±% | |
---|---|---|---|---|---|
Labour | Kenneth Stewart * | 1,756 | 56% | ||
Conservative | C. W. Harpin | 1,164 | 37% | ||
Liberal | A. C. Pistotnick-Howard | 232 | 7% | ||
Majority | 592 | 19% | |||
Registered electors | 14,808 | ||||
Turnout | 3,152 | 21% | |||
Labour hold | Swing |
Party | Candidate | Votes | % | ±% | |
---|---|---|---|---|---|
Conservative | D. P. Dougherty | 1,852 | 46% | ||
Liberal | R. Gore | 1,209 | 30% | ||
Labour | B. Simpson | 912 | 23% | ||
Communist | P. B. Bissette | 65 | 2% | ||
Majority | 643 | ||||
Registered electors | 11,678 | ||||
Turnout | 4,038 | 35% | |||
Conservative gain from | Swing |
Party | Candidate | Votes | % | ±% | |
---|---|---|---|---|---|
Conservative | R. B. Flude | 2,089 | 49% | ||
Liberal | I. C. Todd | 1,238 | 29% | ||
Labour | J. Finnegan | 898 | 21% | ||
Majority | 851 | ||||
Registered electors | 12,195 | ||||
Turnout | 4,225 | 35% | |||
Conservative gain from | Swing |
Party | Candidate | Votes | % | ±% | |
---|---|---|---|---|---|
Labour | L. Evans | 1,786 | 49% | ||
Conservative | J. H. Kirkham | 1,373 | 38% | ||
Liberal | Miss G. Loughney | 252 | 7% | ||
Communist | J. Humes | 211 | 6% | ||
Majority | 413 | 11% | |||
Registered electors | 13,002 | ||||
Turnout | 3,622 | 28% | |||
Labour hold | Swing |
Party | Candidate | Votes | % | ±% | |
---|---|---|---|---|---|
Conservative | T. L. Hobday * | 5,982 | 76% | ||
Conservative | L. B. Williams * | 5,937 | 76% | ||
Labour | J. M. Lyon | 946 | 12% | ||
Liberal | Miss A. Smallman | 899 | 11% | ||
Labour | P. Owens | 874 | 11% | ||
Liberal | J. B. Kaltiff | 835 | 11% | ||
Majority | 5,036 | ||||
Registered electors | 17,820 | ||||
Turnout | 8,827 | 44% | |||
Conservative hold | Swing | ||||
Conservative hold | Swing |
Party | Candidate | Votes | % | ±% | |
---|---|---|---|---|---|
Conservative | F. P. Morris | 1,607 | 48% | 21.3 | |
Labour | Hugh Baird * | 1,450 | 43% | 17 | |
Liberal | R. E. Williams | 243 | 7% | ||
Communist | T. Egan | 74 | 2% | 1 | |
Majority | 157 | 5% | 18.3 | ||
Registered electors | |||||
Turnout | 3,374 | ||||
Conservative gain from Labour | Swing |
Party | Candidate | Votes | % | ±% | |
---|---|---|---|---|---|
Labour | W. A. Wiseman | 1,121 | 59% | ||
Independent | G. Evason | 465 | 24% | ||
Conservative | T. I. Percy | 235 | 12% | ||
Communist | C. P. Curry | 94 | 5% | ||
Majority | 886 | ||||
Registered electors | 11,509 | ||||
Turnout | 1,915 | 17% | |||
Labour gain from | Swing |
Party | Candidate | Votes | % | ±% | |
---|---|---|---|---|---|
Labour | B. Hillen * | 3,217 | 50% | ||
Labour | J. Riley | 3,126 | 48% | ||
Conservative | G. Halliwell | 2,981 | 46% | ||
Conservative | G. Lockley | 2,698 | 42% | ||
Communist | R. Morris | 263 | 4% | ||
Majority | 236 | ||||
Registered electors | 24,169 | ||||
Turnout | 6,461 | 27% | |||
Labour hold | Swing | ||||
Labour hold | Swing |
Party | Candidate | Votes | % | ±% | |
---|---|---|---|---|---|
Conservative | N. C. Goldrein | 3,090 | 69% | ||
Labour | J. E. Ohren | 788 | 17% | ||
Liberal | G. A. Flaxman | 627 | 17% | ||
Majority | 2,302 | 52% | |||
Registered electors | 12,423 | ||||
Turnout | 4,505 | 36% | |||
Conservative hold | Swing |
Party | Candidate | Votes | % | ±% | |
---|---|---|---|---|---|
Conservative | R. O. Harvey | 1,995 | 56% | ||
Labour | J. M. Murphy | 1,356 | 38% | ||
Liberal | J. Sartain | 208 | 6% | ||
Majority | 639 | ||||
Registered electors | 10,731 | ||||
Turnout | 3,559 | 33% | |||
Conservative gain from | Swing |
Party | Candidate | Votes | % | ±% | |
---|---|---|---|---|---|
Conservative | W. R. Bennett | 2,585 | 72% | ||
Labour | D. F. Kerr | 706 | 20% | ||
Liberal | O. Adshead | 275 | 8% | ||
Majority | 1,879 | ||||
Registered electors | 9,676 | ||||
Turnout | 3,566 | 37% | |||
Conservative gain from | Swing |
Party | Candidate | Votes | % | ±% | |
---|---|---|---|---|---|
Conservative | F. L. Pritchard | 3,376 | 82% | ||
Liberal | S. M. Sime | 454 | 11% | ||
Labour | G. Stringer | 300 | 7% | ||
Majority | 2,922 | ||||
Registered electors | 9,076 | ||||
Turnout | 4,130 | 46% | |||
Conservative gain from | Swing |
Party | Candidate | Votes | % | ±% | |
---|---|---|---|---|---|
Conservative | Sir K. P. Thompson | 5,758 | 81% | ||
Liberal | M. J. Metcalf | 1,376 | 19% | ||
Majority | 4,382 | ||||
Registered electors | 16,537 | ||||
Turnout | 7,134 | 43% | |||
Conservative gain from | Swing |
Party | Candidate | Votes | % | ±% | |
---|---|---|---|---|---|
Conservative | Mrs. G. Buckles | 2,653 | 48% | ||
Labour | O. F. Brady | 2,445 | 44% | ||
Liberal | K. Holding | 367 | 7% | ||
Communist | J. Hulligan | 81 | 1.5% | ||
Majority | 208 | ||||
Registered electors | 16,515 | ||||
Turnout | 5,546 | 34% | |||
Conservative gain from | Swing |
Party | Candidate | Votes | % | ±% | |
---|---|---|---|---|---|
Conservative | J. Hartley | 3,774 | 87% | ||
Liberal | J. S. M. White | 961 | 26% | ||
Labour | J. F. Caven | 436 | 10% | ||
Majority | 1,263 | 61% | |||
Registered electors | 11,286 | ||||
Turnout | 3,740 | 33% | |||
Conservative gain from | Swing |
Party | Candidate | Votes | % | ±% | |
---|---|---|---|---|---|
Conservative | C. Rawstron | 2,224 | 59% | ||
Liberal | G. S. M. White | 961 | 26% | ||
Labour | W. P. Lafferty | 555 | 15% | ||
Majority | 1,263 | ||||
Registered electors | 11,286 | ||||
Turnout | 3.740 | 33% | |||
Conservative gain from | Swing |
Party | Candidate | Votes | % | ±% | |
---|---|---|---|---|---|
Conservative | J. S. Mitchell | 2,385 | 78% | ||
Liberal | E. E. Rothwell | 654 | 22% | ||
Majority | 1,731 | ||||
Registered electors | 9,023 | ||||
Turnout | 3,039 | 34% | |||
Conservative gain from | Swing |
Party | Candidate | Votes | % | ±% | |
---|---|---|---|---|---|
Liberal | Ronald Fearn * | 2,438 | 50% | 1.9 | |
Conservative | B. Dawson | 1,921 | 40% | 12.7 | |
Labour | G. A. Fenerty | 476 | 10% | 14.6 | |
Majority | 517 | ||||
Registered electors | 11,406 | ||||
Turnout | 4,835 | 42% | 1.8 | ||
Liberal hold | Swing | 1.9 |
Party | Candidate | Votes | % | ±% | |
---|---|---|---|---|---|
Conservative | Mrs. J. Leech * | 2,977 | 56% | ||
Liberal | P. J. Handley | 1,848 | 35% | ||
Labour | J. J. Abram | 474 | 9% | ||
Majority | 1,129 | ||||
Registered electors | 10,525 | ||||
Turnout | 5,299 | 50% | |||
Conservative gain from | Swing |
Party | Candidate | Votes | % | ±% | |
---|---|---|---|---|---|
Conservative | W. Brown | 2,712 | 67% | 10 | |
Liberal | P. F. Reilly | 1,324 | 33% | 10 | |
Majority | 1,388 | ||||
Registered electors | 10,436 | ||||
Turnout | 4,036 | 39% | |||
Conservative hold | Swing | 10 |
Party | Candidate | Votes | % | ±% | |
---|---|---|---|---|---|
Conservative | A. I. Birch * | 3,282 | 83% | 39.7 | |
Labour | A. Riley | 681 | 17% | 5.9 | |
Majority | 2,601 | ||||
Registered electors | 11,455 | ||||
Turnout | 3,963 | 35% | |||
Conservative hold | Swing | 39.7 |
Party | Candidate | Votes | % | ±% | |
---|---|---|---|---|---|
Conservative | C. Currall * | 3,839 | 76% | 43.8 | |
Labour | J. Howard | 1,155 | 23% | 7.8 | |
Majority | 2,694 | 53.6% | 52.2 | ||
Registered electors | 14,482 | ||||
Turnout | 2,684 | 35% | 10.4 | ||
Conservative hold | Swing | 43.8 |
Party | Candidate | Votes | % | ±% | |
---|---|---|---|---|---|
Conservative | F. Dykins * | unopposed | |||
Registered electors | 10,171 | ||||
Conservative hold | Swing |
Party | Candidate | Votes | % | ±% | |
---|---|---|---|---|---|
Conservative | P. Anderton | 2,969 | 55% | ||
Labour | C. Davies | 2,396 | 45% | ||
Majority | 573 | ||||
Registered electors | 11,022 | ||||
Turnout | 5,365 | 49% | |||
Rejected ballots | |||||
Conservative gain from | Swing |
Party | Candidate | Votes | % | ±% | |
---|---|---|---|---|---|
Labour | O. Conheeney | 2,920 | 45% | ||
Conservative | Miss M. Monks | 2,686 | 41% | ||
Liberal | R. Birch | 910 | 14% | ||
Majority | 234 | ||||
Registered electors | 16,022 | ||||
Turnout | 6,516 | 41% | |||
Labour gain from | Swing |
Party | Candidate | Votes | % | ±% | |
---|---|---|---|---|---|
Conservative | Mrs. A. Berry | 5,270 | 78% | ||
Labour | R. Cliff | 1,479 | 22% | ||
Majority | 3,971 | ||||
Registered electors | 14,053 | ||||
Turnout | 6,749 | 48% | |||
Conservative gain from | Swing |
Party | Candidate | Votes | % | ±% | |
---|---|---|---|---|---|
Conservative | Mrs. E. Jameson | 1,920 | 54% | 17.8 | |
Labour | L. Williams | 1,380 | 39% | 8.6 | |
Liberal | W. Iley | 260 | 7% | 9.2 | |
Majority | 540 | 15.2% | 3.8 | ||
Registered electors | 10,259 | ||||
Turnout | 3,560 | 35% | 1.9 | ||
Conservative gain from Labour | Swing | 26.4 |
Party | Candidate | Votes | % | ±% | |
---|---|---|---|---|---|
Conservative | P. Harrison | 1,632 | 47% | N/A | |
Labour | E. Maguire | 1,496 | 43% | 16.5 | |
Liberal | J. Bentham | 354 | 10% | 30 | |
Majority | 136 | ||||
Registered electors | 11,760 | ||||
Turnout | 3,482 | 30% | |||
Conservative gain from | Swing |
Party | Candidate | Votes | % | ±% | |
---|---|---|---|---|---|
Labour | H. Glover | 2,062 | 44% | 21 | |
Conservative | T. Webster | 1,713 | 37% | N/A | |
Liberal | T. Gilligan | 863 | 19% | 16 | |
Majority | 349 | ||||
Registered electors | 15,565 | ||||
Turnout | 4,638 | 30% | |||
Labour hold | Swing | 21 |
Party | Candidate | Votes | % | ±% | |
---|---|---|---|---|---|
Conservative | E. Jameson | 3,364 | 63% | 15 | |
Labour | N. Wilson | 1,770 | 33% | 19 | |
Liberal | M. A. Kelly | 227 | 4% | N/A | |
Majority | 1,594 | ||||
Registered electors | 13,452 | ||||
Turnout | 5,361 | 40% | 5.6 | ||
Conservative gain from Labour | Swing | 34 |
Party | Candidate | Votes | % | ±% | |
---|---|---|---|---|---|
Conservative | E. Clough | 1,706 | 64% | 23.6 | |
Labour | J. Morris | 953 | 36% | 23.7 | |
Majority | 754 | ||||
Registered electors | 8,471 | ||||
Turnout | 2,659 | 31% | |||
Conservative gain from Labour | Swing | 47.3 |
Party | Candidate | Votes | % | ±% | |
---|---|---|---|---|---|
Labour | F. Mernagh * | 2,272 | 55% | 31.9 | |
Conservative | C. Foster | 1,625 | 39% | N/A | |
Liberal | I. Rigby | 236 | 6% | N/A | |
Majority | 647 | 15.7% | |||
Registered electors | 16,313 | ||||
Turnout | 4,133 | 25% | |||
Labour hold | Swing | 31.9 |
Party | Candidate | Votes | % | ±% | |
---|---|---|---|---|---|
Conservative | G. Brownlow * | 3,954 | 88% | 14.6 | |
Labour | B. Hamilton | 562 | 12% | 14.6 | |
Majority | 3,392 | 75.1% | 28.3 | ||
Registered electors | 9,404 | ||||
Turnout | 4,516 | 48% | 7.1 | ||
Conservative hold | Swing | 14.6 |
Party | Candidate | Votes | % | ±% | |
---|---|---|---|---|---|
Conservative | Nellie Holley | 2,866 | 68% | 19.7 | |
Labour | E. Norris | 1,375 | 32% | 20.3 | |
Majority | 1,491 | ||||
Registered electors | 16,497 | ||||
Turnout | 4,241 | 26% | 13.8 | ||
Conservative gain from Labour | Swing | 40 |
Party | Candidate | Votes | % | ±% | |
---|---|---|---|---|---|
Conservative | H. Harriman * | 3,805 | 80% | 30.2 | |
Liberal | Jean Walker | 970 | 20% | 1.4 | |
Majority | 2,835 | ||||
Registered electors | 10,279 | ||||
Turnout | 4,775 | 46% | |||
Conservative gain from | Swing |
Party | Candidate | Votes | % | ±% | |
---|---|---|---|---|---|
Conservative | E. A. Davies | 2,138 | 51% | 6.9 | |
Labour | B. A. Bryning * | 1,709 | 41% | 24.9 | |
Liberal | P. J. Taylor | 314 | 8% | N/A | |
Majority | 429 | ||||
Registered electors | 9,776 | ||||
Turnout | 4,161 | 43% | |||
Conservative gain from | Swing |
Party | Candidate | Votes | % | ±% | |
---|---|---|---|---|---|
Liberal | Phillip Gilchrist | 2,816 | 45% | 22.7 | |
Conservative | L. Chrishop | 2,256 | 36% | 3.8 | |
Labour | A. E. S. Rose | 1,237 | 20% | 24.6 | |
Majority | 560 | 8.88% | 2.52 | ||
Registered electors | 12,857 | ||||
Turnout | 6,309 | 49% | 4.4 | ||
Liberal gain from Labour | Swing | 42.7 |
Party | Candidate | Votes | % | ±% | |
---|---|---|---|---|---|
Conservative | F. J. K. Williams * | 4,619 | 78% | 30.3 | |
Liberal | Thomas Harney | 1,321 | 22% | 4.4 | |
Majority | 3,298 | 55.5% | 34.6 | ||
Registered electors | 12,002 | ||||
Turnout | 5,940 | 49% | 5.9 | ||
Conservative hold | Swing | 30.3 |
Party | Candidate | Votes | % | ±% | |
---|---|---|---|---|---|
Labour | J. Stuart-Cole * | 1,290 | 50% | 20.6 | |
Conservative | R. Entwistle | 716 | 28% | 1.4 | |
Liberal | M. R. D. Gayford | 403 | 16% | N/A | |
National Party | D. M. Matthews | 117 | 5% | N/A | |
Communist (Young Communist League (Great Britain)) | J. E. Norris | 69 | 3% | N/A | |
Majority | 574 | 22.1% | 1.2 | ||
Registered electors | 8,985 | ||||
Turnout | 2,595 | 29% | 26.9 | ||
Labour gain from | Swing | 20.6 |
Party | Candidate | Votes | % | ±% | |
---|---|---|---|---|---|
Conservative | H. Welsh | 1,402 | 49% | 12 | |
Labour | C. S. McRonald | 1,258 | 44% | 19 | |
Liberal | T. J. Edwards | 190 | 7% | ||
Majority | 144 | ||||
Registered electors | 8,707 | ||||
Turnout | 2,850 | 33% | |||
Conservative gain from Labour | Swing |
Party | Candidate | Votes | % | ±% | |
---|---|---|---|---|---|
Liberal | David Gruffydd Evans | 1,826 | 55% | 4.9 | |
Conservative | George Porter | 1,395 | 42% | 21.1 | |
Labour | Walter Smith | 102 | 3% | 26.2 | |
Majority | 431 | ||||
Registered electors | 9,993 | ||||
Turnout | 3,323 | 33% | 17.4 | ||
Liberal gain from | Swing |
Party | Candidate | Votes | % | ±% | |
---|---|---|---|---|---|
Conservative | W. R. Baker | 2,223 | 44% | 18.8 | |
Liberal | D. W. Hughes * | 1,600 | 32% | 18.1 | |
Labour | G. Kenyon | 1,202 | 24% | 0.7 | |
Majority | 624 | 12.4% | 17.8 | ||
Registered electors | 12,461 | ||||
Turnout | 5,025 | 40% | 1.7 | ||
Conservative gain from Liberal | Swing |
Party | Candidate | Votes | % | ±% | |
---|---|---|---|---|---|
Labour | J. R. A. Flynn | 1,702 | 58% | 1.5 | |
Conservative | R. A. Hodgkinson | 629 | 22% | 10.8 | |
Liberal | E. Rose | 593 | 20% | 9.3 | |
Majority | 1,073 | 36.7% | 6.5 | ||
Registered electors | 9,030 | ||||
Turnout | 2,924 | 32% | 9.7 | ||
Labour hold | Swing | 1.5 |
Party | Candidate | Votes | % | ±% | |
---|---|---|---|---|---|
Conservative | F. J. Moreton | 2,673 | 45% | 16.2 | |
Liberal | Gordon Lindsay * | 2,295 | 39% | 13.5 | |
Labour | D. J. Healey | 833 | 14% | 4.4 | |
National Party | W. R. Williams | 113 | 2% | ||
Majority | 378 | 6.4% | |||
Registered electors | 12,348 | ||||
Turnout | 5,914 | 48% | 0.5 | ||
Conservative gain from Liberal | Swing |
Party | Candidate | Votes | % | ±% | |
---|---|---|---|---|---|
Conservative | A. E. Wise * | 3,638 | 65% | 11.6 | |
Labour | W. R. Leslie | 1,465 | 26% | 20.6 | |
Liberal | E. J. Banton | 474 | 8% | N/A | |
Majority | 2,173 | 39% | 32.3 | ||
Registered electors | 15,882 | ||||
Turnout | 5,577 | 35% | 5.4 | ||
Conservative hold | Swing |
Party | Candidate | Votes | % | ±% | |
---|---|---|---|---|---|
Conservative | Mrs. S. E. Hibbert | 3,990 | 61% | 18.8 | |
Labour | E. C. Ainslie * | 2,071 | 32% | 19.1 | |
Liberal | A. B. Halliday | 470 | 7% | ||
Majority | 1,919 | 29% | 20.1 | ||
Registered electors | 19,861 | ||||
Turnout | 6,531 | 33% | 3.3 | ||
Conservative gain from Labour | Swing |
Party | Candidate | Votes | % | ±% | |
---|---|---|---|---|---|
Conservative | H. H. H. Needham * | 4,471 | 82% | N/A | |
Labour | J. Seaman | 500 | 9% | N/A | |
Liberal | E. L. Fell | 495 | 5% | N/A | |
Majority | 3,971 | 72.6% | N/A | ||
Registered electors | 12,684 | ||||
Turnout | 5,466 | 43% | N/A | ||
Conservative hold | Swing | N/A |
Party | Candidate | Votes | % | ±% | |
---|---|---|---|---|---|
Conservative | J. W. Last * | 4,570 | 78% | N/A | |
Liberal | I. Smith | 897 | 15% | N/A | |
Labour | David Jackson | 406 | 7% | N/A | |
Majority | 3,673 | 62.5% | N/A | ||
Registered electors | 11,992 | ||||
Turnout | 5,873 | 49% | N/A | ||
Conservative hold | Swing | N/A |
Party | Candidate | Votes | % | ±% | |
---|---|---|---|---|---|
Conservative | K. R. Young | 1,943 | 47% | 21 | |
Labour | Bill Wells | 1,793 | 44% | 15.6 | |
Liberal | G. J. Canning | 250 | 6% | 8.4 | |
National Front | John Fishwick | 133 | 3% | N/A | |
Majority | 150 | 3.6% | 30 | ||
Registered electors | 11,464 | ||||
Turnout | 4,119 | 36% | 0.7 | ||
Conservative gain from Labour | Swing |
Party | Candidate | Votes | % | ±% | |
---|---|---|---|---|---|
Conservative | B. J. Frisby | 3,150 | 63% | 23.1 | |
Labour | A. R. Chowderoy | 1,362 | 27% | 13 | |
Liberal | N. R. L. Thomas | 523 | 10% | 10.1 | |
Majority | 1,788 | 35.5% | 35.4 | ||
Registered electors | 12,629 | ||||
Turnout | 5,072 | 40.16% | 0.16 | ||
Rejected ballots | 17 | 0.34% | |||
Conservative gain from Labour | Swing |
Party | Candidate | Votes | % | ±% | |
---|---|---|---|---|---|
Conservative | I. W. Allison | 1,951 | 66% | 31.1 | |
Labour | C. Allman * | 873 | 29% | 20.6 | |
Liberal | J. C. Jenkins | 154 | 5% | 10.5 | |
Majority | 1,078 | 36.2% | 21.5 | ||
Registered electors | 7,070 | ||||
Turnout | 2,978 | 42% | 2.4 | ||
Conservative gain from Labour | Swing |
Party | Candidate | Votes | % | ±% | |
---|---|---|---|---|---|
Conservative | M. F. Emberton | 5,394 | 69% | 28.1 | |
Liberal | Mrs. Kathleen Bowes | 2,036 | 26% | 25.1 | |
Labour | Mrs. Beryl Lloyd | 335 | 4% | 2.3 | |
Majority | 3,358 | 43.25% | 33.05 | ||
Registered electors | 14,673 | ||||
Turnout | 7,765 | 53% | 5.2 | ||
Conservative gain from Liberal | Swing |
Party | Candidate | Votes | % | ±% | |
---|---|---|---|---|---|
Conservative | K. W. Porter | 3,362 | 76% | 36.2 | |
Labour | M. D. Laskier | 647 | 15% | 2.3 | |
Liberal | J. S. C. Timothy | 401 | 9% | 29 | |
Majority | 2,715 | 61.56% | 59.76 | ||
Registered electors | 11,774 | ||||
Turnout | 4,410 | 37% | 7.8 | ||
Conservative hold | Swing | 36.2 |
Party | Candidate | Votes | % | ±% | |
---|---|---|---|---|---|
Labour | J. Gershman * | 1,916 | 46% | 22.3 | |
Conservative | Mrs. Marie Kemble | 1,829 | 44% | 12.3 | |
Liberal | P. C. Mawdsley | 346 | 8% | N/A | |
Communist | R. B. Harris | 93 | 2% | N/A | |
Majority | 87 | 2.08% | 33.52 | ||
Registered electors | 12,427 | ||||
Turnout | 4,184 | 34% | 2.6 | ||
Labour hold | Swing |
Party | Candidate | Votes | % | ±% | |
---|---|---|---|---|---|
Conservative | J. C. Smyth | 4,840 | 88% | 27.1 | |
Liberal | R. W. Thomas | 355 | 6% | 23.9 | |
Labour | J. F. Durrant | 286 | 5% | 4.1 | |
Majority | 4,485 | 81.82% | 20.92 | ||
Registered electors | 11,022 | ||||
Turnout | 5,481 | 46% | 5.8 | ||
Conservative hold | Swing | 27.1 |
Party | Candidate | Votes | % | ±% | |
---|---|---|---|---|---|
Conservative | F. K. Burlinson * | 3,240 | 76% | 13.5 | |
Labour | H. Ellis-Thomas | 620 | 15% | 22.5 | |
Liberal | G. A. Collins | 391 | 9% | N/A | |
Majority | 2,620 | 61.63% | 36.63 | ||
Registered electors | 9,147 | ||||
Turnout | 4,251 | 46% | 5.3 | ||
Conservative hold | Swing | 13.5 |
• italics denote the sitting councillor • bold denotes the winning candidate
Liverpool City Council is the local authority for the city of Liverpool in Merseyside, England. Liverpool has had a local authority since 1207, which has been reformed on numerous occasions. Since 1974 the council has been a metropolitan borough council. It provides the majority of local government services in the city. The council has been a member of the Liverpool City Region Combined Authority since 2014.
Little Altcar is a village and civil parish in the Metropolitan Borough of Sefton on Merseyside, within the boundaries of the historic county of Lancashire and on the West Lancashire Coastal Plain of England. The village forms part of the built-up area of Formby. It had a population of 910 in the 2011 Census, increasing to 910 at the 2011 Census. Little Altcar is known primarily for the extensive variety of different flavours of goldfish sold on Liverpool Road, and the park Bill's Lane, a gathering spot for communists.
Liverpool Riverside is a constituency represented in the House of Commons of the UK Parliament since 2019 by Kim Johnson, who is a member of the Labour Party.
Liverpool City Council elections are held every four years. Between 1973 and 2021 elections were generally held three years out of every four, with a third of the council being elected each time. Liverpool City Council is the local authority for the metropolitan borough of Liverpool in Merseyside, England. Since the last boundary changes in 2023, 85 councillors have been elected from 64 wards, with each ward electing one, two or three councillors.
The 2002 St Helens Metropolitan Borough Council election took place on 2 May 2002 to elect members of St Helens Metropolitan Borough Council in Merseyside, England. One third of the council was up for election and the Labour Party stayed in overall control of the council.
The 2003 St Helens Metropolitan Borough Council election took place on 1 May 2003 to elect members of St Helens Metropolitan Borough Council in Merseyside, England. One third of the council was up for election and the Labour Party stayed in overall control of the council.
The 2004 St Helens Metropolitan Borough Council election took place on 10 June 2004 to elect members of St Helens Metropolitan Borough Council in Merseyside, England. The whole council was up for election with boundary changes since the last election in 2003 reducing the number of seats by six. The Labour Party lost overall control of the council to no overall control.
The 2006 St Helens Metropolitan Borough Council election took place on 4 May 2006 to elect members of St Helens Metropolitan Borough Council in Merseyside, England. One third of the council was up for election and the council stayed under no overall control.
Knowsley Council, or Knowsley Metropolitan Borough Council, is the local authority of the Metropolitan Borough of Knowsley in Merseyside, England. It is a metropolitan borough council and provides the majority of local government services in the borough. The council has been a member of the Liverpool City Region Combined Authority since 2014.
The 2007 St Helens Metropolitan Borough Council election took place on 3 May 2007 to elect members of St Helens Metropolitan Borough Council in Merseyside, England. One third of the council was up for election and the council stayed under no overall control.
The 2002 St Albans City and District Council election took place on 2 May 2002 to elect members of St Albans District Council in Hertfordshire, England. One third of the council was up for election and the council stayed under no overall control.
Wirral Council, or Wirral Metropolitan Borough Council, is the local authority of the Metropolitan Borough of Wirral in Merseyside, England. It is a metropolitan borough council and provides the majority of local government services in the borough. The council has been a member of the Liverpool City Region Combined Authority since 2014.
Elections to Liverpool City Council were held on 3 May 1972. One seat in each of the forty wards was up for election, plus one by-election seat each in Vauxhall and Woolton wards. This was the last year when the council comprised 120 councillors and 40 Aldermen, totalling 160, which was the largest council membership .
Elections to Liverpool City Council were held on 7 May 1964.
The 2017 Buckinghamshire County Council election took place on 4 May 2017 as part of the 2017 local elections in the United Kingdom. All 49 councillors were elected from electoral divisions which returned one county councillor each by first-past-the-post voting for a four-year term of office, due to expire in 2021.
Elections to Mid Bedfordshire District Council were held in May 2007. These were the last elections to council, with all 53 seats being up for election. Councillors elected would serve a two-year term, expiring in 2009, when Mid Bedfordshire District Council was replaced by Central Bedfordshire Council. The Conservative Party retained overall control of the council, winning 37 of 53 seats on the council. The Conservatives won 8 seats unopposed, as did an Independent candidate in one ward.
The 2019 Wirral Metropolitan Borough Council election took place on 2 May 2019 to elect members of Wirral Metropolitan Borough Council in England. This election was held on the same day as other local elections.
The 1973 Merseyside County Council election took place on 12 April 1973 to elect members of Merseyside County Council in England. This was on the same day as other local elections.
The 1981 Merseyside County Council election took place on 7 May to elect members of Merseyside County Council in England. This was on the same day as other local elections.
The 2022 Salford City Council election took place on 5 May 2022 along with other local elections across the United Kingdom. One third—20 out of 60—of councillor seats on Salford City Council were up for election.
"…on night of Labour slaughter…". Liverpool Daily Post. 6 May 1977. Retrieved 25 February 2017.
"LABOUR SUNK BY TORY'S BLUE TIDE". Liverpool Echo . 6 May 1977. Retrieved 12 March 2017.