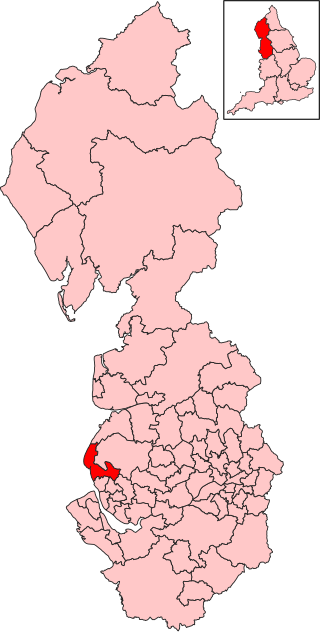
The 2022 Sefton Metropolitan Borough Council election took place on 5 May 2022 to elect members of Sefton Council. This was on the same day as other local elections. 21 of the 66 seats were up for election, with 1 ward (St. Oswald) being uncontested. [1] [2]
From its creation in 1974 to the 1986 election, Sefton Council was under Conservative control. [3] It was then under no overall control until the 2012 election, when Labour won their first majority on the council. [4] In the 2021 election, Labour polled 46.6% and gained 6 seats, the Conservatives polled 26.0% for a gain of 2 seats, The Liberal Democrats took 14.1% and lost 5 seats, Formby Residents Action Group polled 2.2% and did not make any gains, and independents lost their 3 seats on the council. [5]
The seats up for election this year were last elected in 2018. In that election, Labour gained 3 seats with 50.9% of the vote, the Liberal Democrats lost 4 seats on 16.0%, and the Conservatives gained 1 seat on 22.8%. Formby Residents Action Group lost the seat they were defending.
After 2021 election | Before 2022 election [6] | ||||
---|---|---|---|---|---|
Party | Seats | Party | Seats | ||
Labour | 48 | Labour | 46 | ||
Liberal Democrats | 8 | Liberal Democrats | 8 | ||
Conservative | 8 | Conservative | 8 | ||
Formby Residents Action Group | 2 | Formby Residents Action Group | 2 | ||
Independent | 0 | Independent | 2 |
Changes:
2022 Sefton Metropolitan Borough Council election | ||||||||||
---|---|---|---|---|---|---|---|---|---|---|
Party | This election | Full council | This election | |||||||
Seats | Net | Seats % | Other | Total | Total % | Votes | Votes % | +/− | ||
Labour | 17 | 2 | 77.3 | 31 | 48 | 72.7 | 32,371 | 49.3 | +2.7 | |
Liberal Democrats | 2 | 9.1 | 6 | 8 | 12.1 | 10,000 | 15.2 | +1.1 | ||
Conservative | 3 | 1 | 13.6 | 4 | 7 | 10.6 | 13,296 | 20.2 | -5.8 | |
FRAG | 0 | 0.0 | 2 | 2 | 3.0 | 973 | 1.5 | -0.7 | ||
Independent | 0 | 1 | 0.0 | 1 | 1 | 1.5 | 5,725 | 8.7 | +5.0 | |
Green | 0 | 0.0 | 0 | 0 | 0.0 | 3,119 | 4.7 | -2.3 | ||
Workers Party | 0 | 0.0 | 0 | 0 | 0.0 | 142 | 0.2 | +0.1 | ||
NIP | 0 | 0.0 | 0 | 0 | 0.0 | 97 | 0.1 | N/A |
An asterisk indicates an incumbent councillor.
Party | Candidate | Votes | % | ±% | |
---|---|---|---|---|---|
Conservative | Tony Brough* | 1,387 | 33.0 | +2.1 | |
Labour | Janet Harrison | 1,354 | 32.2 | +12.8 | |
Liberal Democrats | Lesley Delves | 1,272 | 30.3 | −14.2 | |
Green | Laurence Rankin | 189 | 4.5 | −0.7 | |
Majority | 33 | 0.8 | |||
Turnout | 4,202 | 41.9 | |||
Conservative hold | Swing | 5.4 |
Party | Candidate | Votes | % | ±% | |
---|---|---|---|---|---|
Liberal Democrats | Iain Brodie-Browne* | 1,518 | 43.4 | +14.1 | |
Labour | Daniel McKee | 1,093 | 31.2 | −1.5 | |
Conservative | Lee Durkin | 697 | 19.9 | −12.1 | |
Green | David Collins | 190 | 5.4 | −0.6 | |
Majority | 425 | 12.2 | |||
Turnout | 3,498 | 34.7 | |||
Liberal Democrats hold | Swing | 7.8 |
Party | Candidate | Votes | % | ±% | |
---|---|---|---|---|---|
Labour | Natasha Carlin* | 2,301 | 66.0 | +16.7 | |
Conservative | Harry Bliss | 791 | 22.7 | −4.8 | |
Liberal Democrats | Brian Dunning | 394 | 11.3 | +4.5 | |
Majority | 1,510 | 43.3 | |||
Turnout | 3,486 | 37.6 | |||
Labour hold | Swing | 10.8 |
Party | Candidate | Votes | % | ±% | |
---|---|---|---|---|---|
Conservative | Mike Morris* | 1,338 | 37.9 | −3.7 | |
Liberal Democrats | Michael Sammon | 1,313 | 37.2 | +1.7 | |
Labour | Ian Upton | 678 | 19.2 | +2.2 | |
Green | Carla Fox | 197 | 5.6 | −0.3 | |
Majority | 25 | 0.7 | |||
Turnout | 3,526 | 36.1 | |||
Conservative hold | Swing | 2.7 |
Party | Candidate | Votes | % | ±% | |
---|---|---|---|---|---|
Labour | Daren Veidman* | 1,850 | 64.5 | +0.8 | |
Green | Neil Doolin | 862 | 30.1 | +9.0 | |
Conservative | John Campbell | 155 | 5.4 | −5.9 | |
Majority | 988 | 34.7 | −8.0 | ||
Turnout | 2,867 | 31.3 | |||
Labour hold | Swing | 4.1 |
Party | Candidate | Votes | % | ±% | |
---|---|---|---|---|---|
Labour | Brenda O'Brien* | 1,757 | 82.6 | +18.5 | |
Independent | John McDonald | 204 | 9.6 | N/A | |
Conservative | Daniel Nuttall | 165 | 7.8 | +0.1 | |
Majority | 1,553 | 73.0 | |||
Turnout | 2,126 | 23.6 | |||
Labour hold | Swing | N/A |
Party | Candidate | Votes | % | ±% | |
---|---|---|---|---|---|
Conservative | Ron Watson* | 1,479 | 41.9 | +0.1 | |
Liberal Democrats | Jo Barton | 1,224 | 34.7 | +18.6 | |
Labour | Trevor Vaughan | 824 | 23.4 | +8.8 | |
Majority | 255 | 7.2 | |||
Turnout | 3,527 | 33.7 | |||
Conservative hold | Swing | 9.3 |
Party | Candidate | Votes | % | ±% | |
---|---|---|---|---|---|
Labour | Elizabeth Dowd* | 1,452 | 66.5 | +3.1 | |
Independent | Chris Doyle | 534 | 24.5 | N/A | |
Conservative | Margaret Middleton | 114 | 5.2 | −3.3 | |
Workers Party | Chris Haws | 84 | 3.8 | −0.8 | |
Majority | 918 | 42.0 | |||
Turnout | 2,184 | 23.5 | |||
Labour hold | Swing | N/A |
Party | Candidate | Votes | % | ±% | |
---|---|---|---|---|---|
Labour | Carol Richards | 1,544 | 40.3 | +7.0 | |
Conservative | Denise Dutton* | 1,482 | 38.7 | −4.1 | |
FRAG | Aimee Brodie | 329 | 8.6 | −2.5 | |
Liberal Democrats | Annie Gorski | 257 | 6.7 | +2.4 | |
Green | Michael Walsh | 221 | 5.8 | −1.6 | |
Majority | 62 | 1.6 | |||
Turnout | 3,833 | 39.2 | |||
Labour gain from Conservative | Swing | 5.6 |
Party | Candidate | Votes | % | ±% | |
---|---|---|---|---|---|
Labour | Laura Lunn-Bates | 1,563 | 50.1 | +13.5 | |
Conservative | Laura Nuttall | 842 | 27.0 | −3.7 | |
Liberal Democrats | Vic Foulds | 715 | 22.9 | −3.1 | |
Majority | 721 | 23.1 | |||
Turnout | 3,120 | 30.0 | |||
Labour hold | Swing | 8.6 |
Party | Candidate | Votes | % | ±% | |
---|---|---|---|---|---|
Labour | Gordon Friel* | 1,320 | 76.2 | −12.6 | |
Independent | Lisa Ford | 299 | 17.3 | N/A | |
Conservative | Lynne Bold | 114 | 6.6 | −4.6 | |
Majority | 1,021 | 58.9 | |||
Turnout | 1,733 | 19.5 | |||
Labour hold | Swing | N/A |
Party | Candidate | Votes | % | ±% | |
---|---|---|---|---|---|
Labour | John Kelly* | 1,703 | 77.2 | +13.4 | |
Independent | Molli Cooke | 285 | 12.9 | N/A | |
Conservative | Stephen Witham | 121 | 5.5 | −1.1 | |
NIP | Billie Gibson | 97 | 4.4 | N/A | |
Majority | 1,418 | 64.3 | |||
Turnout | 2,206 | 24.7 | |||
Labour hold | Swing | N/A |
Party | Candidate | Votes | % | ±% | |
---|---|---|---|---|---|
Labour | James McGinnity | 1,818 | 59.1 | +11.3 | |
Conservative | Janice Blanchard | 669 | 21.7 | −10.1 | |
Liberal Democrats | John Gibson | 343 | 11.1 | +1.2 | |
Green | James O'Keefe | 248 | 8.1 | −2.4 | |
Majority | 1,149 | 37.4 | |||
Turnout | 3,078 | 31.1 | |||
Labour hold | Swing | 10.7 |
Party | Candidate | Votes | % | ±% | |
---|---|---|---|---|---|
Liberal Democrats | Gareth Lloyd-Johnson | 1,326 | 37.0 | −11.0 | |
Conservative | Thomas de Freitas | 1,203 | 33.6 | +2.1 | |
Labour | Stephen Jowett | 839 | 23.4 | +10.1 | |
Green | Pauline Hesketh | 211 | 5.9 | −1.3 | |
Majority | 123 | 3.4 | |||
Turnout | 3,579 | 36.1 | |||
Liberal Democrats hold | Swing | 6.6 |
Party | Candidate | Votes | % | ±% | |
---|---|---|---|---|---|
Labour | Danny Burns | 1,900 | 60.3 | −6.4 | |
Independent | Tony Carr* | 976 | 31.0 | N/A | |
Conservative | Marcus Bleasdale | 274 | 8.7 | −10.0 | |
Majority | 924 | 29.3 | |||
Turnout | 3,150 | 31.1 | |||
Labour gain from Independent | Swing | N/A |
Tony Carr was elected in 2018 for the Labour Party.
Party | Candidate | Votes | % | ±% | |
---|---|---|---|---|---|
Labour | Ian Maher* | 1,739 | 72.8 | −2.4 | |
Independent | John Rice | 473 | 19.8 | N/A | |
Conservative | Andrew Burgess | 177 | 7.4 | −3.1 | |
Majority | 1,266 | 53.0 | |||
Turnout | 2,389 | 24.7 | |||
Labour hold | Swing | N/A |
Party | Candidate | Votes | % | ±% | |
---|---|---|---|---|---|
Labour | Mhairi Doyle* | 1,734 | 55.9 | +12.2 | |
Conservative | Pam Teesdale | 672 | 21.7 | −6.3 | |
Liberal Democrats | Stuart Williams | 452 | 14.6 | −6.2 | |
Green | David McIntosh | 244 | 7.9 | +0.4 | |
Majority | 1,062 | 34.2 | |||
Turnout | 3,102 | 30.0 | |||
Labour hold | Swing | 9.3 |
Party | Candidate | Votes | % | ±% | |
---|---|---|---|---|---|
Labour | June Burns* | 1,510 | 45.1 | −8.8 | |
Independent | Neil Spencer | 723 | 21.6 | N/A | |
Independent | Kenneth Hughes | 462 | 13.8 | N/A | |
Conservative | Daniel Sims | 409 | 12.2 | −22.5 | |
Green | Roy Greason | 244 | 7.3 | −4.1 | |
Majority | 787 | 23.5 | |||
Turnout | 3,348 | 34.3 | |||
Labour hold | Swing | N/A |
Party | Candidate | Votes | % | ±% | |
---|---|---|---|---|---|
Labour | Nina Killen* | 1,766 | 52.5 | +13.9 | |
Conservative | Michael Shaw | 660 | 19.6 | −3.5 | |
FRAG | Bob McCann | 644 | 19.1 | −11.2 | |
Green | Alison Gibbon | 294 | 8.7 | +3.1 | |
Majority | 1,106 | 32.9 | |||
Turnout | 3,364 | 35.2 | |||
Labour hold | Swing | 8.7 |
Party | Candidate | Votes | % | ±% | |
---|---|---|---|---|---|
Labour | Carla Thomas* | N/A | N/A | N/A | |
Majority | N/A | N/A | N/A | ||
Turnout | N/A | N/A | N/A |
This election was uncontested, so the poll was cancelled and Thomas was declared elected. [2]
Party | Candidate | Votes | % | ±% | |
---|---|---|---|---|---|
Labour | Judy Hardman | 1,329 | 37.0 | −13.6 | |
Independent | Yvonne Sayers | 1,065 | 29.6 | N/A | |
Independent | Thomas Hughes | 704 | 19.6 | N/A | |
Conservative | Morgan Walton | 283 | 7.9 | −28.2 | |
Liberal Democrats | Emily Baker | 157 | 4.4 | N/A | |
Workers Party | Paul McCord | 58 | 1.6 | −4.4 | |
Majority | 264 | 7.4 | |||
Turnout | 3,596 | 34.7 | |||
Labour hold | Swing | N/A |
Party | Candidate | Votes | % | ±% | |
---|---|---|---|---|---|
Labour | Janet Grace* | 2,297 | 60.3 | +7.3 | |
Liberal Democrats | Hannah Gee | 1,029 | 27.0 | −1.2 | |
Conservative | Katie Burgess | 264 | 6.9 | −4.0 | |
Green | Samantha Cook | 219 | 5.7 | −2.2 | |
Majority | 1,268 | 33.3 | |||
Turnout | 3,809 | 36.1 | |||
Labour hold | Swing | 4.3 |
Sefton Central is a constituency represented by Bill Esterson of the Labour Party since 2010.
The 2003 St Helens Metropolitan Borough Council election took place on 1 May 2003 to elect members of St Helens Metropolitan Borough Council in Merseyside, England. One third of the council was up for election and the Labour Party stayed in overall control of the council.
Sefton Metropolitan Borough Council elections are generally held three years out of every four, with a third of the council being elected each time. Sefton Metropolitan Borough Council, generally known as Sefton Council, is the local authority for the metropolitan borough of Sefton in Merseyside, England. Since the last boundary changes in 2004, 66 councillors have been elected from 22 wards.
The 2003 West Lancashire District Council election took place on 1 May 2003 to elect members of West Lancashire District Council in Lancashire, England. One third of the council was up for election and the Conservative Party stayed in overall control of the council.
Sefton Council, or Sefton Metropolitan Borough Council, is the local authority of the Metropolitan Borough of Sefton in Merseyside, England. It is a metropolitan borough council and provides the majority of local government services in the borough. The council has been a member of the Liverpool City Region Combined Authority since 2014.
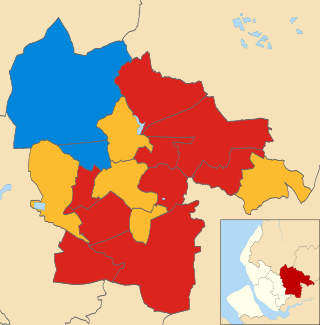
The 2008 St Helens Metropolitan Borough Council election took place on 1 May 2008 to elect members of St Helens Metropolitan Borough Council in Merseyside, England. One third of the council was up for election and the council stayed under no overall control.
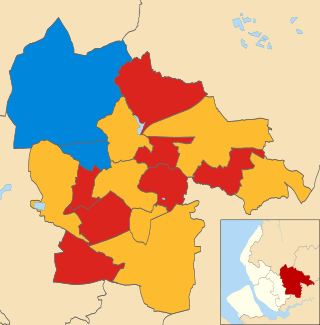
The 2007 St Helens Metropolitan Borough Council election took place on 3 May 2007 to elect members of St Helens Metropolitan Borough Council in Merseyside, England. One third of the council was up for election and the council stayed under no overall control.
The 2002 Halton Borough Council election took place on 2 May 2002 to elect members of Halton Unitary Council in Cheshire, England. One third of the council was up for election and the Labour Party stayed in overall control of the council.
The 2007 Sunderland Council election took place on 3 May 2007 to elect members of Sunderland Metropolitan Borough Council in Tyne and Wear, England. One third of the council was up for election and the Labour Party stayed in overall control of the council.
The 2008 Sunderland Council election took place on 1 May 2008 to elect members of Sunderland Metropolitan Borough Council in Tyne and Wear, England. One third of the council was up for election and the Labour Party stayed in overall control of the council.
The 2010 Sunderland Council election took place on 6 May 2010 to elect members of Sunderland Metropolitan Borough Council in Tyne and Wear, England. One third of the council was up for election and the Labour Party stayed in overall control of the council. The election took place on the same day as the 2010 General Election.
The 2012 Sefton Metropolitan Borough Council election took on 3 May 2012 to elect members of Sefton Metropolitan Borough Council in England, as part of the 2012 United Kingdom local elections. 22 seats, representing one third of the total Council membership, were up for election in single-member wards. Ten - nearly half - of the members elected were newcomers to the Council; five of these defeated sitting Councillors seeking re-election, whilst in the other five wards, the incumbent retired. Two incumbents stood under different labels to those they were elected under in 2008; both were defeated in their wards.
The 2011 Lichfield District Council election took place on 5 May 2011 to elect members of Lichfield District Council in Staffordshire, England. The whole council - 56 members - was up for election and the Conservative Party retained overall control of the council.
The 2011 St Helens Metropolitan Borough Council election took place on 5 May 2011 to elect members of St Helens Metropolitan Borough Council in Merseyside, England. One third of the council was up for election and the Labour Party stayed in overall control of the council.
The 2012 St Helens Metropolitan Borough Council election took place on 3 May 2012 to elect members of St Helens Metropolitan Borough Council in Merseyside, England. One third of the council was up for election and the LabourPparty stayed in overall control of the council.
The 2007 Christchurch Borough Council election took place on 3 May 2007 to elect members of Christchurch Borough Council in Dorset, England. The whole council was up for election and the Conservative party stayed in overall control of the council.
The 2017 Welsh local elections were held on 4 May 2017 to elect members of all 22 local authorities in Wales. This included the Isle of Anglesey, which was previously up for election in 2013 due to having its elections delayed for a year. Community council elections also took place on the same day. These local elections were held as part of the 2017 local elections in the United Kingdom. Apart from Anglesey, the last elections were held in 2012. Normally these elections take place every four years, but the 2017 elections were postponed for a year in order to avoid clashing with the 2016 Welsh Assembly election, which itself had been postponed by a year to avoid clashing with the 2015 general election.
The 2022 North Yorkshire Council election took place on 5 May 2022, alongside the other local elections. These were the last elections to North Yorkshire County Council, and the elected councillors would also serve as the first councillors on the North Yorkshire Council, which replaced the existing county council in April 2023.
Elections to The Highland Council were held on 5 May 2022, the same day as the 31 other Scottish local government elections. As with other Scottish council elections, it was held using single transferable vote (STV) – a form of proportional representation – in which multiple candidates are elected in each ward and voters rank candidates in order of preference.
The 2024 Sefton Metropolitan Borough Council election took place on 2 May 2024 to elect members of Sefton Metropolitan Borough Council in Merseyside, England. This was on the same day as other local elections across England, Liverpool's City Region mayoral election and Merseyside's Police and Crime Commissioner election.