| |||||||||||||||||||||||||||||||||||||
13 of the 39 seats to Stevenage Borough Council 20 seats needed for a majority | |||||||||||||||||||||||||||||||||||||
---|---|---|---|---|---|---|---|---|---|---|---|---|---|---|---|---|---|---|---|---|---|---|---|---|---|---|---|---|---|---|---|---|---|---|---|---|---|
| |||||||||||||||||||||||||||||||||||||
|
Elections to Stevenage Borough Council took place on 5 May 2022. [1] This was on the same day as other local elections across the United Kingdom. One third of the council was up for election; the seats which were last contested in 2018. The Labour Party retained control of the council, which it has held continuously since its creation in 1973. [2]
2022 Stevenage Borough Council election | ||||||||||
---|---|---|---|---|---|---|---|---|---|---|
Party | This election | Full council | This election | |||||||
Seats | Net | Seats % | Other | Total | Total % | Votes | Votes % | +/− | ||
Labour | 9 | 3 | 69.2 | 15 | 24 | 61.5 | 9,718 | 44.7 | +7.0 | |
Conservative | 2 | 2 | 15.4 | 7 | 9 | 23.1 | 6,778 | 31.2 | -8.6 | |
Liberal Democrats | 2 | 15.4 | 4 | 6 | 15.4 | 3,968 | 18.3 | +2.5 | ||
Green | 0 | 0.0 | 0 | 0 | 0.0 | 629 | 2.9 | -0.5 | ||
TUSC | 0 | 0.0 | 0 | 0 | 0.0 | 411 | 1.9 | +0.6 | ||
Independent | 0 | 1 | 0.0 | 0 | 0 | 0.0 | 178 | 0.8 | -0.6 | |
Reform UK | 0 | 0.0 | 0 | 0 | 0.0 | 50 | 0.2 | -0.1 | ||
Party | Candidate | Votes | % | ±% | |
---|---|---|---|---|---|
Labour Co-op | Joan Lloyd | 786 | 47.7 | +7.5 | |
Conservative | Dhiren Malavia | 589 | 35.7 | -12.2 | |
Liberal Democrats | Andrew Anderson | 232 | 14.1 | +4.4 | |
TUSC | Barbara Clare | 42 | 2.5 | +0.2 | |
Majority | 197 | 12.0 | |||
Turnout | 1,649 | ||||
Labour Co-op hold | Swing | 9.9 | |||
Party | Candidate | Votes | % | ±% | |
---|---|---|---|---|---|
Labour Co-op | Nazmin Chowdhury | 941 | 56.8 | +2.6 | |
Conservative | Catherine Bibby | 452 | 27.3 | -5.7 | |
Liberal Democrats | Chris Berry | 191 | 11.5 | +1.8 | |
TUSC | Steve Glennon | 73 | 4.4 | +1.4 | |
Majority | 489 | 29.5 | |||
Turnout | 1,657 | ||||
Labour Co-op hold | Swing | 4.2 | |||
Party | Candidate | Votes | % | ±% | |
---|---|---|---|---|---|
Liberal Democrats | Tom Wren | 748 | 45.7 | +10.8 | |
Labour Co-op | Forhad Chowdhury | 507 | 31.0 | +2.0 | |
Conservative | Matthew Wyatt | 330 | 20.2 | -8.4 | |
TUSC | Roger Charles | 50 | 3.1 | +1.2 | |
Majority | 241 | 14.7 | |||
Turnout | 1,635 | ||||
Liberal Democrats hold | Swing | 4.4 | |||
Party | Candidate | Votes | % | ±% | |
---|---|---|---|---|---|
Conservative | Bret Facey | 610 | 39.9 | -11.0 | |
Labour Co-op | Alistair Gordon | 594 | 38.9 | +5.4 | |
Independent | Matthew Hurst | 178 | 11.6 | N/A | |
Liberal Democrats | Matthew Snell | 121 | 7.9 | +2.2 | |
TUSC | Helen Kerr | 25 | 1.6 | +0.1 | |
Majority | 16 | 1.0 | |||
Turnout | 1,528 | ||||
Conservative hold | Swing | 8.2 | |||
Party | Candidate | Votes | % | ±% | |
---|---|---|---|---|---|
Liberal Democrats | Andy McGuinness | 1,218 | 63.0 | +7.3 | |
Labour Co-op | Louisa Barr | 315 | 16.3 | +0.2 | |
Conservative | Victoria Facey | 306 | 15.8 | -7.8 | |
Green | Dean Carpenter | 93 | 4.8 | +0.2 | |
Majority | 903 | 47.2 | |||
Turnout | 1,932 | ||||
Liberal Democrats hold | Swing | 3.6 | |||
Party | Candidate | Votes | % | ±% | |
---|---|---|---|---|---|
Labour Co-op | Lloyd Briscoe | 659 | 43.6 | +8.8 | |
Conservative | Andy Goldsmith | 380 | 25.1 | -5.6 | |
Liberal Democrats | Isabel Wilks | 370 | 24.5 | -5.9 | |
Green | Jim Borcherds | 104 | 6.9 | N/A | |
Majority | 279 | 18.5 | |||
Turnout | 1,513 | ||||
Labour Co-op hold | Swing | 7.2 | |||
Party | Candidate | Votes | % | ±% | |
---|---|---|---|---|---|
Labour Co-op | Jim Brown | 1,107 | 46.8 | +11.4 | |
Conservative | Jody Hanafin | 942 | 39.8 | -0.3 | |
Green | Elizabeth Sturges | 189 | 8.0 | +0.5 | |
Liberal Democrats | Madani Mannan | 111 | 4.7 | +1.2 | |
TUSC | Mark Kerr | 17 | 0.7 | N/A | |
Majority | 165 | 7.0 | |||
Turnout | 2,366 | ||||
Labour Co-op gain from Conservative | Swing | 5.9 | |||
Party | Candidate | Votes | % | ±% | |
---|---|---|---|---|---|
Labour Co-op | Lin Martin-Haugh | 749 | 49.0 | +2.9 | |
Conservative | Andy Facey | 484 | 31.6 | -8.2 | |
Liberal Democrats | Charles Littleton | 142 | 9.3 | +2.4 | |
Green | Naomi Lovelace-Collins | 131 | 8.6 | +1.4 | |
TUSC | Mark Pickersgill | 24 | 1.6 | N/A | |
Majority | 265 | 17.4 | |||
Turnout | 1,530 | ||||
Labour Co-op hold | Swing | 5.6 | |||
Party | Candidate | Votes | % | ±% | |
---|---|---|---|---|---|
Labour Co-op | Anne Wells | 757 | 47.1 | +11.1 | |
Conservative | Nicholas Leech | 628 | 39.1 | -8.8 | |
Liberal Democrats | Nigel Bye | 183 | 11.4 | -2.7 | |
TUSC | Bryan Clare | 39 | 2.4 | +0.4 | |
Majority | 129 | 8.0 | |||
Turnout | 1,607 | ||||
Labour Co-op gain from Conservative | Swing | 10.0 | |||
Party | Candidate | Votes | % | ±% | |
---|---|---|---|---|---|
Labour Co-op | Rob Broom | 834 | 59.7 | +12.2 | |
Conservative | Celia Lawrence | 375 | 26.9 | -15.6 | |
Liberal Democrats | David Barks | 134 | 9.6 | +3.8 | |
TUSC | Michael Malocco | 53 | 3.8 | -0.4 | |
Majority | 459 | 32.8 | |||
Turnout | 1,396 | ||||
Labour Co-op hold | Swing | 13.9 | |||
Party | Candidate | Votes | % | ±% | |
---|---|---|---|---|---|
Labour Co-op | Sandra Barr | 1,079 | 59.8 | +13.5 | |
Conservative | Melanie Mitchell | 485 | 26.9 | -10.0 | |
Liberal Democrats | Hazel Jones | 180 | 10.0 | +1.9 | |
TUSC | Amber Gentleman | 60 | 3.3 | +1.1 | |
Majority | 594 | 32.9 | |||
Turnout | 1,804 | ||||
Labour Co-op hold | Swing | 11.8 | |||
Party | Candidate | Votes | % | ±% | |
---|---|---|---|---|---|
Labour Co-op | Sharon Taylor | 902 | 53.7 | +10.7 | |
Conservative | Jack Ingarfill | 523 | 31.1 | -11.6 | |
Liberal Democrats | Clive Hearmon | 115 | 6.8 | +0.4 | |
Green | Richard Warr | 112 | 6.7 | -0.1 | |
TUSC | Trevor Palmer | 28 | 1.7 | +0.5 | |
Majority | 379 | 22.3 | |||
Turnout | 1,680 | ||||
Labour Co-op hold | Swing | 11.2 | |||
Party | Candidate | Votes | % | ±% | |
---|---|---|---|---|---|
Conservative | Phil Bibby | 674 | 47.0 | -6.5 | |
Labour Co-op | Jim Callaghan | 488 | 34.0 | +3.6 | |
Liberal Democrats | Neil Brinkworth | 223 | 15.5 | +1.5 | |
Reform UK | Amodio Amato | 50 | 3.5 | +1.3 | |
Majority | 186 | 10.1 | |||
Turnout | 1,435 | ||||
Conservative hold | Swing | 5.1 | |||
Party | Candidate | Votes | % | ±% | |
---|---|---|---|---|---|
Labour | Conor McGrath | 907 | 69.8 | +13.0 | |
Conservative | Matthew Wyatt | 263 | 20.2 | –15.5 | |
Liberal Democrats | Chris Berry | 129 | 10.0 | –1.5 | |
Majority | 644 | 49.6 | |||
Turnout | |||||
Labour hold | Swing | 14.25 | |||
One third of Stevenage Borough Council in Hertfordshire, England is elected each year, followed by one year when there is an election to Hertfordshire County Council instead.
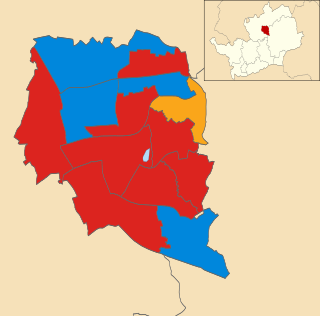
Elections to Stevenage Council were held on 7 May 1998. One third of the council was up for election; the seats which were last contested in 1994. The Labour Party stayed in overall control of the council.
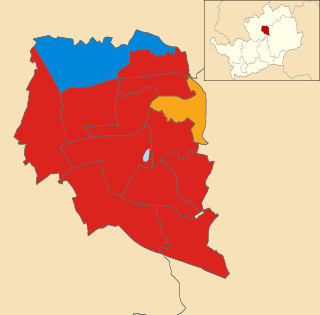
Elections to Stevenage Council in Hertfordshire, England were held on 4 May 2000. One third of the council was up for election; the seats of the candidates who finished third in each ward in the all-out election of 1999. The Labour Party stayed in overall control of the council, which it had held continuously since its creation in 1973.
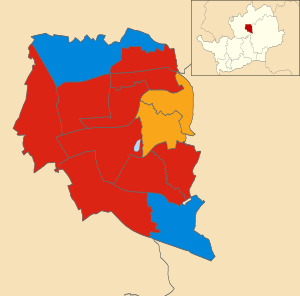
Elections to Stevenage Council in Hertfordshire, England were held on 1 May 2003. One third of the council was up for election; the seats of the candidates who finished first in each ward in the all-out election of 1999. The Labour Party stayed in overall control of the council, as had been predicted before the election. Overall turnout was 52.2%.
Stevenage Borough Council is the local authority for the Stevenage non-metropolitan district of England, the United Kingdom. Stevenage is located in the north-east of Hertfordshire, in the East of England region.
Elections to Stevenage Borough Council were held on 3 May 2012. One third of the council were elected; the seats which were last contested in 2008.
The 2014 Stevenage Borough Council election took place on 22 May 2014 to elect members of Stevenage Borough Council in England. This was on the same day as other local elections; the seats which were last contested in 2010. The Labour Party retained control of the council, which it had held continuously since 1973.
The by-thirds 2015 Stevenage Borough Council election was held on 7 May 2015 to elect one third (thirteen) of the members (councillors) of the council, one for each ward, as part of the 2015 United Kingdom local elections held simultaneously with the 2015 General Election. The up for election were last contested in 2011. The Labour Party retained control of the council, which it had held continuously since 1973.
The 2016 Stevenage Borough Council election took place on 5 May 2016 to elect members of Stevenage Borough Council in England. This was on the same day as other local elections. One third of the council was up for election; the seats which were last contested in 2012. The Labour Party retained control of the council, which it had held continuously since 1973.
Elections to Stevenage Borough Council took place on 2 May 2019. This was on the same day as other local elections across the United Kingdom. One third of the council was up for election; the seats were last contested in 2015. The Labour Party retained control of the council, which it has held continuously since 1973.
The 1973 Stevenage Borough Council election were the first elections to the newly created Stevenage Borough Council took place on 7 June 1973. This was on the same day as other local elections. The Local Government Act 1972 stipulated that the elected members were to shadow and eventually take over from the predecessor urban district council on 1 April 1974. The election resulted in Labour gaining control of the council, which it has held continuously to the present day. The new council was awarded borough status when it came into its powers on 1 April 1974, allowing the chairman to take the title of mayor. The first mayor was Labour councillor Jim Cockerton.
The 1982 Stevenage Borough Council election took place on 6 May 1982. This was on the same day as other local elections. One third of the council was up for election and the Labour Party retained control of the council, which it had held continuously since its creation in 1973.
The 1983 Stevenage Borough Council election took place on 5 May 1983. This was on the same day as other local elections. One third of the council was up for election and the Labour Party retained control of the council, which it had held continuously since its creation in 1973.
The 1984 Stevenage Borough Council election took place on 3 May 1984. This was on the same day as other local elections. One third of the council was up for election; the seats which were last contested in 1980. The Labour Party retained control of the council, which it had held continuously since its creation in 1973.
The 1988 Stevenage Borough Council election took place on 5 May 1988. This was on the same day as other local elections. One third of the council was up for election; the seats which were last contested in 1984. The Labour Party retained control of the council, which it had held continuously since its creation in 1973.
The 1990 Stevenage Borough Council election took place on 3 May 1990. This was on the same day as other local elections. One third of the council was up for election; the seats which were last contested in 1986. The Labour Party retained control of the council, which it had held continuously since its creation in 1973.
The 1991 Stevenage Borough Council election took place on 2 May 1991. This was on the same day as other local elections. One third of the council was up for election; the seats which were last contested in 1987. The Labour Party retained control of the council, which it had held continuously since its creation in 1973.
The 1992 Stevenage Borough Council election took place on 7 May 1992. This was on the same day as other local elections. One third of the council was up for election; the seats which were last contested in 1988. The Labour Party retained control of the council, which it had held continuously since its creation in 1973.
The 1995 Stevenage Borough Council election took place on 4 May 1995. This was on the same day as other local elections. One third of the council was up for election; the seats which were last contested in 1991. There was also a second seat up for election in Martins Wood ward. The Labour Party retained control of the council, which it had held continuously since its creation in 1973.
Elections to Stevenage Borough Council took place on 6 May 2021. This was on the same day as other local elections across the United Kingdom. One third of the council was up for election, plus a by-election in Roebuck ward; the seats which were last contested in 2016. The Labour Party retained control of the council, which it has held continuously since 1973, but with a reduced majority.