1998 St Albans City and District Council election

Last updated

The 1998 St Albans City and District Council election took place on 7 May 1998 to elect members of St Albans City and District Council in Hertfordshire, England. One third of the council was up for election and the Liberal Democrats stayed in overall control of the council. [1]

Contents

After the election, the composition of the council was:

Election result

The Liberal Democrats were reduced from 39 to 30 councillors, but retained a 3-seat majority on the council. [2] Liberal Democrat losses included losing seats to Labour in Ashley, Cunningham and St Peters wards, while Labour also held Sopwell where Kerry Pollard had stood down after being elected Member of Parliament for St Albans at the 1997 general election. [2] This took Labour to 16 seats, while the Conservatives increased to 11 seats after gaining 5 seats from the Liberal Democrats in Harpenden North, Harpenden South, Harpenden West, St Stephen and Verulam wards, with the majority in Harpenden North only being 23 votes after a recount. [2] Overall turnout at the election was 36%. [2]

1998 St Albans City and District Council election [2] [3] [4]
PartyThis electionFull councilThis election
SeatsNetSeats %OtherTotalTotal %VotesVotes %+/−
  Liberal Democrats 8Decrease2.svg 938.1223052.613,50335.9-1.6
  Labour 7Increase2.svg 433.391628.111,57330.8-2.9
  Conservative 6Increase2.svg 528.651119.312,51333.3+4.6
  Natural Law 0Steady2.svg0.0000.014<0.1N/A

Ward results

Ashley [2] [4]
PartyCandidateVotes%±%
Labour Noreen Brosnan 1,073 53.3
Liberal Democrats Paul Riley71735.6
Conservative Patricia Spratt22311.1
Majority35617.7
Turnout 2,013
Labour gain from Liberal Democrats Swing
Batchwood [2] [4]
PartyCandidateVotes%±%
Labour David McManus 987 65.1
Conservative James Vessey29519.5
Liberal Democrats Robin Law23415.4
Majority69245.6
Turnout 1,516
Labour hold Swing
Clarence [2] [4]
PartyCandidateVotes%±%
Liberal Democrats Sheila Burton 931 51.5
Labour William Niblett59733.0
Conservative Jeremy Christie27915.4
Majority33418.5
Turnout 1,807
Liberal Democrats hold Swing
Colney Heath [2] [4]
PartyCandidateVotes%±%
Liberal Democrats John Henchley 565 52.0
Conservative Derek Jeffrey26224.1
Labour Gordon Watson26023.9
Majority30327.9
Turnout 1,087
Liberal Democrats hold Swing
Cunningham (2 seats) [2] [4]
PartyCandidateVotes%±%
Labour Andrew Gilson 910 43.5
Labour Laurence Heyman 865 41.3
Liberal Democrats Geoffrey Harrison83339.8
Liberal Democrats Joy Winder77837.2
Conservative Graham Leonard34616.5
Conservative Louisa-Jane Rosalki32315.4
Turnout 2,094
Labour gain from Liberal Democrats Swing
Harpenden East [2] [4]
PartyCandidateVotes%±%
Liberal Democrats David Waddilove 769 43.6
Conservative Victor Holley66537.7
Labour David Crew32918.7
Majority1045.9
Turnout 1,763
Liberal Democrats hold Swing
Harpenden North [2] [4]
PartyCandidateVotes%±%
Conservative Albert Pawle 759 42.0
Liberal Democrats John Coad73640.7
Labour Richard Botterill31417.4
Majority231.3
Turnout 1,809
Conservative gain from Liberal Democrats Swing
Harpenden South [2] [4]
PartyCandidateVotes%±%
Conservative Paul Foster 1,125 58.6
Liberal Democrats Katharine Sutton50326.2
Labour Linda Spiri27714.4
Natural Law Patricia Saunders140.7
Majority62232.4
Turnout 1,919
Conservative gain from Liberal Democrats Swing
Harpenden West (2 seats) [2] [4]
PartyCandidateVotes%±%
Conservative Julian Turner 1,139 61.7
Conservative Julian Daly 1,138 61.7
Liberal Democrats Judith Arthur41822.7
Liberal Democrats Paul Spinks37320.2
Labour Joanne Thompson28315.3
Labour Judith Bush26414.3
Turnout 1,845
Conservative gain from Liberal Democrats Swing
Conservative hold Swing
London Colney [2] [4]
PartyCandidateVotes%±%
Labour Sean Flynn 1,094 71.4
Conservative Mark Shaw26017.0
Liberal Democrats David Priestman17911.7
Majority83454.4
Turnout 1,533
Labour hold Swing
Marshalswick North [2] [4]
PartyCandidateVotes%±%
Liberal Democrats Geoffrey Churchard 781 46.3
Conservative Christopher Whiteside62337.0
Labour Elizabeth McShane28216.7
Majority1589.4
Turnout 1,686
Liberal Democrats hold Swing
Marshalswick South [2] [4]
PartyCandidateVotes%±%
Liberal Democrats Anthony Rowlands 1,141 54.3
Conservative Agnes Hill58027.6
Labour David Allan38018.1
Majority56126.7
Turnout 2,101
Liberal Democrats hold Swing
Park Street [2] [4]
PartyCandidateVotes%±%
Liberal Democrats Elizabeth Hendry 499 40.5
Conservative Keith Batson39632.1
Labour Mary Morley33827.4
Majority1038.4
Turnout 1,233
Liberal Democrats hold Swing
Redbourn [2] [4]
PartyCandidateVotes%±%
Liberal Democrats Patricia Schofield 765 44.0
Conservative Paul Finigan72341.6
Labour Vivienne Windle24914.3
Majority422.4
Turnout 1,737
Liberal Democrats hold Swing
Sopwell [2] [4]
PartyCandidateVotes%±%
Labour Janetta Gibbs 1,076 73.1
Conservative Pamela Thomas22315.2
Liberal Democrats David Terrar17211.7
Majority85358.0
Turnout 1,471
Labour hold Swing
St Peters [2] [4]
PartyCandidateVotes%±%
Labour Winifred Dunleavy 867 49.9
Liberal Democrats Richard Biddle64437.1
Conservative Geoffrey Brown22613.0
Majority22812.8
Turnout 1,737
Labour gain from Liberal Democrats Swing
St Stephen [2] [4]
PartyCandidateVotes%±%
Conservative Gordon Myland 951 43.5
Liberal Democrats Khalil Moghul79136.2
Labour Janet Blackwell44420.3
Majority1607.3
Turnout 2,186
Conservative gain from Liberal Democrats Swing
Verulam [2] [4]
PartyCandidateVotes%±%
Conservative John Smith 1,150 49.1
Liberal Democrats Richard Mort82235.1
Labour Jerry Brenton37015.8
Majority32814.0
Turnout 2,342
Conservative gain from Liberal Democrats Swing
Wheathampstead [2] [4]
PartyCandidateVotes%±%
Liberal Democrats Christopher Oxley 852 42.7
Conservative Gillian Clark82741.5
Labour Michael Fletcher31415.8
Majority251.3
Turnout 1,993
Liberal Democrats hold Swing

By-elections

Sopwell by-election 23 July 1998 [5]
PartyCandidateVotes%±%
Labour 841 68.3 -4.8
Conservative 21217.2+2.0
Liberal Democrats 17814.5+2.8
Majority62951.1-6.9
Turnout 1,23123.5
Labour hold Swing

Related Research Articles

<span class="mw-page-title-main">St Albans (UK Parliament constituency)</span> Parliamentary constituency in the United Kingdom, 1801-1852 & 1885 onwards

St Albans is a constituency represented in the House of Commons of the UK Parliament since 2019 by Daisy Cooper, a Liberal Democrat.

<span class="mw-page-title-main">Hitchin and Harpenden (UK Parliament constituency)</span> Parliamentary constituency in the United Kingdom, 1997 onwards

Hitchin and Harpenden is a constituency represented in the House of Commons of the UK Parliament since 2017 by Bim Afolami, a Conservative.

Hertfordshire County Council in England is elected every four years. Since the last boundary changes took effect in 2017 there have been 78 electoral divisions electing one councillor each.

<span class="mw-page-title-main">2008 St Albans City and District Council election</span>

The 2008 St Albans City and District Council election took place on 1 May 2008 to elect members of St Albans District Council in Hertfordshire, England. One third of the council was up for election and the Liberal Democrats gained overall control of the council from no overall control.

<span class="mw-page-title-main">1999 St Albans City and District Council election</span> 1999 UK local government election

The 1999 St Albans City and District Council election took place on 6 May 1999 to elect members of St Albans City and District Council in Hertfordshire, England. The whole council was up for election with boundary changes since the last election in 1998 increasing the number of seats by 1. The Liberal Democrats lost overall control of the council to no overall control.

<span class="mw-page-title-main">2000 St Albans City and District Council election</span>

The 2000 St Albans City and District Council election took place on 4 May 2000 to elect members of St Albans District Council in Hertfordshire, England. One third of the council was up for election and the council stayed under no overall control.

<span class="mw-page-title-main">2002 St Albans City and District Council election</span>

The 2002 St Albans City and District Council election took place on 2 May 2002 to elect members of St Albans District Council in Hertfordshire, England. One third of the council was up for election and the council stayed under no overall control.

<span class="mw-page-title-main">2003 St Albans City and District Council election</span>

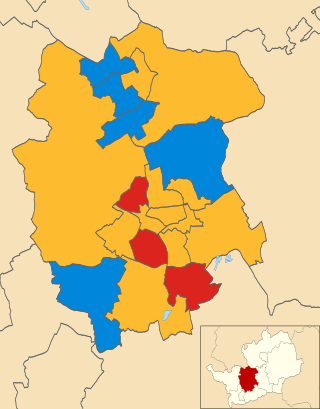
The 2003 St Albans City and District Council election took place on 1 May 2003 to elect members of St Albans District Council in Hertfordshire, England. One third of the council was up for election and the council stayed under no overall control.

<span class="mw-page-title-main">2004 St Albans City and District Council election</span>

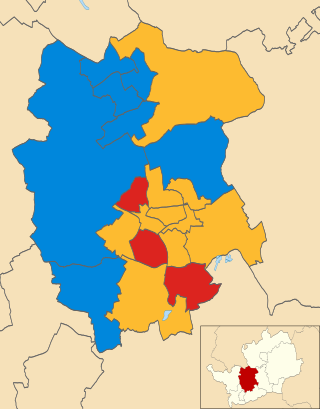
The 2004 St Albans City and District Council election took place on 10 June 2004 to elect members of St Albans District Council in Hertfordshire, England. One third of the council was up for election and the council stayed under no overall control.

<span class="mw-page-title-main">2006 St Albans City and District Council election</span>

The 2006 St Albans City and District Council election took place on 4 May 2006 to elect members of St Albans District Council in Hertfordshire, England. One third of the council was up for election and the Liberal Democrats gained overall control of the council from no overall control.

<span class="mw-page-title-main">2007 St Albans City and District Council election</span> 2007 UK local government election

The 2007 St Albans City and District Council election took place on 3 May 2007 to elect members of St Albans District Council in Hertfordshire, England. One third of the council was up for election and the Liberal Democrats lost overall control of the council to no overall control.

The 1998 Wyre Forest District Council election took place on 7 May 1998 to elect members of Wyre Forest District Council in Worcestershire, England. One-third of the council was up for election and the Labour Party stayed in overall control of the council.

The 2004 Welwyn Hatfield District Council election took place on 10 June 2004 to elect members of Welwyn Hatfield District Council in Hertfordshire, England. One third of the council was up for election and the Conservative Party stayed in overall control of the council.

The 2007 Welwyn Hatfield Borough Council election took place on 3 May 2007 to elect members of Welwyn Hatfield Borough Council in Hertfordshire, England. One third of the council was up for election and the Conservative Party stayed in overall control of the council.

<span class="mw-page-title-main">2010 St Albans City and District Council election</span>

The 2010 St Albans City and District Council election took place on 6 May 2010 to elect members of St Albans District Council in Hertfordshire, England. One third of the council was up for election and the Liberal Democrats stayed in overall control of the council.

<span class="mw-page-title-main">2012 St Albans City and District Council election</span> 2012 UK local government election

The 2012 St Albans City and District Council election took place on 3 May 2012 to elect members of St Albans District Council in Hertfordshire, England. One third of the council was up for election and the council stayed under no overall control.

<span class="mw-page-title-main">2011 St Albans City and District Council election</span> 2011 UK local government election

The 2011 St Albans City and District Council election took place on 5 May 2011 to elect members of St Albans District Council in Hertfordshire, England. One third of the council was up for election and the Liberal Democrats lost overall control of the council to no overall control.

<span class="mw-page-title-main">2014 St Albans City and District Council election</span> English local election

The 2014 St Albans City and District Council election took place on 22 May 2014 to elect members of St Albans District Council in Hertfordshire, England. One third of the council was up for election and the council stayed under no overall control.

<span class="mw-page-title-main">2003 West Berkshire Council election</span>

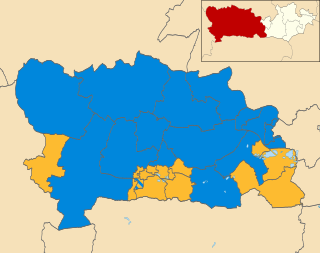
The 2003 West Berkshire Council election took place on 1 May 2003 to elect members of West Berkshire Council in Berkshire, England. The whole council was up for election with boundary changes since the last election in 2000 reducing the number of seats by two. The Liberal Democrats lost overall control of the council to no overall control.

<span class="mw-page-title-main">2021 Hertfordshire County Council election</span>

Elections to Hertfordshire County Council took place on 6 May 2021 alongside other local elections in the United Kingdom. All 78 seats to the council were elected.

References

  1. 1 2 "Local Elections results". The Times . 9 May 1998. p. 46.
  2. 1 2 3 4 5 6 7 8 9 10 11 12 13 14 15 16 17 18 19 20 21 22 23 24 "Lib Dems hold on to control of council". Hertfordshire County Publications. NewsBank. 16 May 1998.
  3. "Policy and politics: Local Elections: Analysis: Council poll results". The Guardian. 9 May 1998. p. 16.
  4. 1 2 3 4 5 6 7 8 9 10 11 12 13 14 15 16 17 18 19 20 "District Council Elections 7 May 1998 Results". St Albans City and District Council. Archived from the original on 13 April 2001. Retrieved 6 January 2015.
  5. "Local Authority Byelection Results - July 1998". Local Authority Byelection Results. Archived from the original on 10 August 2014. Retrieved 6 January 2015.