Stevenage Borough Council elections

Last updated

One third of Stevenage Borough Council in Hertfordshire, England is elected each year, followed by one year when there is an election to Hertfordshire County Council instead.

Contents

Council elections

Composition of the council [1]
Year Conservative Labour Liberal Democrats [a] Independents
& Others
Council control
after election
Local government reorganisation; council established (34 seats)
1973 33100Labour
1976 62800Labour
New ward boundaries (39 seats) [2]
1979 43500Labour
1980 33600Labour
1982 22980Labour
1983 227100Labour
1984 [3] 226110Labour
1986 12990Labour
1987 [4] 126120Labour
1988 127101Labour
1990 13260Labour
1991 13530Labour
1992 43230Labour
1994 43230Labour
1995 23610Labour
1996 03810Labour
1998 03720Labour
New ward boundaries (39 seats) [5] [6]
1999 33330Labour
2000 33330Labour
2002 33330Labour
2003 33330Labour
2004 33240Labour
2006 33240Labour
2007 33240Labour
2008 53031Labour
2010 92730Labour
2011 92730Labour
2012 63030Labour
2014 23430Labour
2015 63030Labour
2016 72930Labour
2018 92640Labour
2019 72750Labour
2021 112260Labour
2022 92460Labour
2023 92460Labour
New ward boundaries (39 seats) [7]
2024 13260Labour

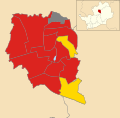
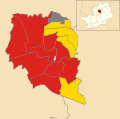
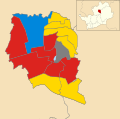
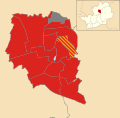
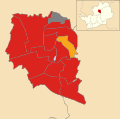
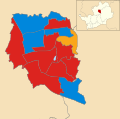
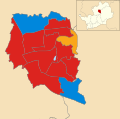
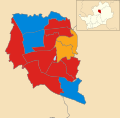
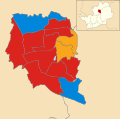
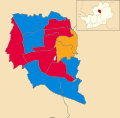
Borough result maps

By-election results

1994–1998

Pin Green By-Election 1 May 1997
PartyCandidateVotes%±%
Labour 1,51959.2−14.8
Conservative 59623.2+8.1
Liberal Democrats 36714.3+3.5
Independent 863.3+3.3
Majority 92336.0
Turnout 2,568
Labour hold Swing
Symonds Green By-Election 1 May 1997
PartyCandidateVotes%±%
Labour 2,26053.0−18.8
Conservative 1,39832.8+4.6
Liberal Democrats 60314.1+14.1
Majority 86220.2
Turnout 4,261
Labour hold Swing

1998–2002

Roebuck By-Election 16 July 1998
PartyCandidateVotes%±%
Labour 52049.6−16.6
Liberal Democrats 30929.5+16.3
Conservative 22021.0+0.3
Majority 21120.1
Turnout 1,04926.1
Labour hold Swing
Bandley Hill By-Election 23 September 1999
PartyCandidateVotes%±%
Labour 49573.9+14.2
Conservative 10615.8−2.2
Liberal Democrats 6910.3−7.4
Majority 38958.1
Turnout 67013.5
Labour hold Swing

2002–2006

Roebuck By-Election 9 December 2004
PartyCandidateVotes%±%
Labour Sherma Batson60052.6+8.1
Conservative 29225.6−4.0
Liberal Democrats Gordon Knight24921.8−4.0
Majority 30827.0
Turnout 1,14125.9
Labour hold Swing

2006–2010

Pin Green By-Election 27 March 2008
PartyCandidateVotes%±%
Labour Lin Martin-Haugh67154.8+3.2
Conservative Leslie Clark30224.7+1.7
Liberal Democrats Mary Griffith14912.2−0.3
UKIP Rick Seddon615.0+5.0
Green Tom Moore413.3+3.3
Majority 36830.1
Turnout 1,22529.0
Labour hold Swing
Pin Green By-Election 25 September 2008 [8]
PartyCandidateVotes%±%
Labour Bruce Jackson71654.4+6.9
Conservative Ralph Dimelow32124.4−5.1
Liberal Democrats Gordon Knight1128.5−2.8
UKIP Terence Tompkins856.5+6.5
Free England PartyRichard Atkins816.2−5.4
Majority 39530.0
Turnout 1,315
Labour hold Swing

2014–2018

Roebuck By-Election 4 May 2017 [9]
PartyCandidateVotes%±%
Conservative Alexander Farquharson72544.1+15.5
Labour Monika Cherney-Craw71443.4+0.0
Liberal Democrats Thomas Wren945.7+1.0
Green Martin Malocco875.3+0.1
TUSC Helen Kerr251.5+0.5
Majority 110.7
Turnout 1,645
Conservative gain from Labour Swing

2022–2026

Bedwell By-Election 19 January 2023 [10]
PartyCandidateVotes%±%
Labour Conor McGrath90769.8+13.0
Conservative Matthew Wyatt26320.2−7.1
Liberal Democrats Chris Berry1299.9−1.6
Majority 64449.6
Turnout 1,299
Labour hold Swing
Manor By-Election 13 February 2025 [11]
PartyCandidateVotes%±%
Liberal Democrats Peter Wilkins76055.6
Reform UK Matthew Hurst32023.4
Conservative Marcel Houps13910.2
Labour Thea Pendlebury1017.4
Green Stephani Mok463.4
Majority 44049.6
Turnout 1,366
Liberal Democrats hold Swing
Bedwell By-Election 26 June 2025 [12]
PartyCandidateVotes%±%
Labour Dermot Kehoe50643.2
Reform UK John Duncan40434.5
Conservative Marcel Houps1059.0
Green Stephani Mok796.7
Liberal Democrats Jill Brinkworth786.7
Majority 1028.7
Turnout 1,172
Labour hold Swing

Notes

  1. Includes totals for the predecessors of the Liberal Democrats, the Liberal Party and SDP (both of which participated in the Alliance).

References

  1. "Composition calculator". Colin Rallings & Michael Thrasher . The Elections Centre, Plymouth University . Retrieved 14 May 2025.
  2. The Borough of Stevenage (Electoral Arrangements) Order 1976
  3. The East Hertfordshire and Stevenage (Areas) Order 1984
  4. The Hertfordshire (District Boundaries) Order 1986
  5. "Stevenage". BBC Online . Retrieved 11 May 2008.
  6. legislation.gov.uk – The Borough of Stevenage (Electoral Changes) Order 1998. Retrieved on 4 October 2015.
  7. McRae, Isabella (6 June 2022). "Stevenage could see new boundaries for council wards in the borough". Herts Live. Retrieved 22 March 2024.
  8. "Pin Green Election Results – 25 September 2008". Stevenage.gov.uk. Archived from the original on 1 October 2008. Retrieved 22 October 2008.
  9. "Local Elections Archive Project — Roebuck Ward". www.andrewteale.me.uk. Retrieved 9 June 2024.
  10. "Local Elections Archive Project — Bedwell Ward". www.andrewteale.me.uk. Retrieved 9 June 2024.
  11. "Local Elections Archive Project — Manor Ward". www.andrewteale.me.uk. Retrieved 1 April 2025.
  12. "Local Elections Archive Project — Manor Ward". www.andrewteale.me.uk. Retrieved 30 August 2025.