| |||||||||||||||||||||||||||||||||||||||||||||||||||||||||||||||||||||||
18 out of 56 seats to St Albans City and District Council 29 seats needed for a majority | |||||||||||||||||||||||||||||||||||||||||||||||||||||||||||||||||||||||
---|---|---|---|---|---|---|---|---|---|---|---|---|---|---|---|---|---|---|---|---|---|---|---|---|---|---|---|---|---|---|---|---|---|---|---|---|---|---|---|---|---|---|---|---|---|---|---|---|---|---|---|---|---|---|---|---|---|---|---|---|---|---|---|---|---|---|---|---|---|---|---|
| |||||||||||||||||||||||||||||||||||||||||||||||||||||||||||||||||||||||
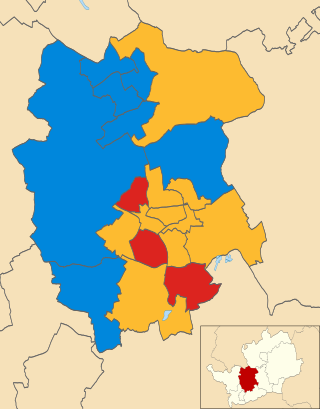
Winner of each seat at the 2023 St Albans City and District Council election | |||||||||||||||||||||||||||||||||||||||||||||||||||||||||||||||||||||||
|
The 2023 St Albans City and District Council election took place on 4 May 2023 to elect members of St Albans City and District Council in Hertfordshire, England. [1] This was on the same day as other local elections across England. [2]
Eighteen members of the council were up for election.
The Liberal Democrats obtained 15 seats, the Green party obtained 2 seats (including winning one from the Liberal Democrats in Clarence ward), and the Conservatives obtained 1 seat (in Harpenden South). [3] [4]
The Liberal Democrats remained in control of the council after the election, with 49 out of 56 seats being held by them. [5]
On 5 May 2023, one day after the election, it was announced that there would be a by-election for a district councillor in St. Peters ward on 13 June 2023 due to a vacancy. [6]
The next elections are due to take place in May 2024. [3]
2023 St Albans City and District Council election | ||||||||||
---|---|---|---|---|---|---|---|---|---|---|
Party | This election | Full council | This election | |||||||
Seats | Net | Seats % | Other | Total | Total % | Votes | Votes % | +/− | ||
Liberal Democrats | 15 | 1 | 83.3 | 34 | 49 | 87.5 | 20,859 | 50.4 | +2.5 | |
Conservative | 1 | 5.6 | 3 | 4 | 7.1 | 11,127 | 26.8 | +2.8 | ||
Green | 2 | 1 | 11.1 | 0 | 2 | 3.6 | 5,287 | 12.8 | –2.4 | |
Independent | 0 | 0.0 | 1 | 1 | 1.8 | 0 | 0.0 | –2.5 | ||
Labour | 0 | 0.0 | 0 | 0 | 0.0 | 4,075 | 9.8 | –0.6 | ||
Reform UK | 0 | 0.0 | 0 | 0 | 0.0 | 49 | 0.1 | N/A | ||
Communist | 0 | 0.0 | 0 | 0 | 0.0 | 30 | 0.1 | ±0.0 | ||
The Statement of Persons Nominated, which details the candidates standing in each ward, was released by St Albans City and District Council following the close of nominations on 5 April 2023. [7] [8]
The Liberal Democrats, Conservatives, Labour, and the Green Party had candidates in all 18 wards. The results for each ward were as follows: [9]
Party | Candidate | Votes | % | ±% | |
---|---|---|---|---|---|
Liberal Democrats | Jenni Murray* | 1,184 | 56.4 | +3.4 | |
Labour | Emma Turnbull | 344 | 16.4 | –1.2 | |
Conservative | Alexandra Clark | 309 | 14.7 | –1.6 | |
Green | Danielle Durant-Taylor | 214 | 10.2 | –2.8 | |
Reform UK | David Thurston | 49 | 2.3 | N/A | |
Majority | 840 | 40.0 | N/A | ||
Turnout | 2,100 | 37.6 | –6.7 | ||
Registered electors | 5,584 | ||||
Liberal Democrats hold | Swing | 2.3 | |||
Party | Candidate | Votes | % | ±% | |
---|---|---|---|---|---|
Liberal Democrats | Chris Brattle | 1,419 | 60.7 | +8.2 | |
Conservative | Ambrose Killen | 406 | 17.3 | +1.2 | |
Green | Rosalind Paul | 276 | 11.8 | –10.1 | |
Labour | Jane Cloke | 238 | 10.2 | +0.8 | |
Majority | 1,013 | 43.4 | N/A | ||
Turnout | 2,339 | 40.4 | –6.3 | ||
Registered electors | 5,796 | ||||
Liberal Democrats hold | Swing | 3.5 | |||
Party | Candidate | Votes | % | ±% | |
---|---|---|---|---|---|
Green | Matt Fisher | 1,503 | 50.9 | +18.3 | |
Liberal Democrats | Oluwasheun Onamusi | 1,055 | 35.8 | –11.1 | |
Conservative | Don Deepthi | 198 | 6.7 | –3.2 | |
Labour | George Sanderson | 194 | 6.6 | –4.0 | |
Majority | 448 | 15.1 | N/A | ||
Turnout | 2,950 | 48.5 | –2.3 | ||
Registered electors | 6,089 | ||||
Green gain from Liberal Democrats | Swing | 14.7 | |||
Party | Candidate | Votes | % | ±% | |
---|---|---|---|---|---|
Liberal Democrats | Keith Cotton | 1,281 | 59.6 | +0.2 | |
Conservative | Lyn Bolton | 408 | 19.0 | +3.1 | |
Labour | John Paton | 293 | 13.6 | +1.0 | |
Green | Caroline Hall | 168 | 7.8 | –4.3 | |
Majority | 873 | 40.6 | N/A | ||
Turnout | 2,150 | 38.0 | –3.0 | ||
Registered electors | 5,660 | ||||
Liberal Democrats hold | Swing | 1.5 | |||
Party | Candidate | Votes | % | ±% | |
---|---|---|---|---|---|
Liberal Democrats | Dason Canning* | 1,221 | 58.0 | +7.4 | |
Conservative | Nigel Turnbull | 570 | 27.1 | –3.2 | |
Labour | Neil Mulcock | 172 | 8.2 | +0.4 | |
Green | Ian Troughton | 142 | 6.7 | –4.7 | |
Majority | 651 | 30.9 | N/A | ||
Turnout | 2,105 | 37.3 | –6.0 | ||
Registered electors | 5,637 | ||||
Liberal Democrats hold | Swing | 5.3 | |||
Party | Candidate | Votes | % | ±% | |
---|---|---|---|---|---|
Liberal Democrats | Ayesha Rohale* | 1,217 | 53.1 | –2.5 | |
Conservative | Alexia D'Rosario | 736 | 32.1 | +2.4 | |
Green | Candida Whittome | 171 | 7.5 | –0.9 | |
Labour | Ben Dearman | 167 | 7.3 | +1.0 | |
Majority | 481 | 21.0 | N/A | ||
Turnout | 2,291 | 39.3 | –5.5 | ||
Registered electors | 5,832 | ||||
Liberal Democrats hold | Swing | 2.5 | |||
Party | Candidate | Votes | % | ±% | |
---|---|---|---|---|---|
Conservative | Teresa Heritage | 1,220 | 52.0 | +10.0 | |
Liberal Democrats | Denise de Mattos Bowser | 885 | 37.7 | +0.1 | |
Labour | David Crew | 134 | 5.7 | –4.2 | |
Green | Anne McQuade | 106 | 4.6 | –6.0 | |
Majority | 335 | 14.3 | N/A | ||
Turnout | 2,345 | 42.2 | +1.0 | ||
Registered electors | 5,558 | ||||
Conservative hold | Swing | 5.0 | |||
Party | Candidate | Votes | % | ±% | |
---|---|---|---|---|---|
Liberal Democrats | Fiona Gaskell* | 1,256 | 45.4 | +2.0 | |
Conservative | Matt Cowley | 1,189 | 42.9 | +9.6 | |
Green | Kyle Riley | 205 | 7.4 | –10.0 | |
Labour | Victoria Thompson | 119 | 4.3 | –1.6 | |
Majority | 67 | 2.5 | N/A | ||
Turnout | 2,769 | 45.9 | –3.2 | ||
Registered electors | 6,036 | ||||
Liberal Democrats hold | Swing | 3.8 | |||
Party | Candidate | Votes | % | ±% | |
---|---|---|---|---|---|
Liberal Democrats | Graeme Shaw | 1,468 | 66.5 | +10.0 | |
Conservative | Sudha Bharadia | 295 | 13.3 | +0.6 | |
Green | Marianne Jordan | 250 | 11.3 | +0.8 | |
Labour | Steve Clark | 197 | 8.9 | ±0.0 | |
Majority | 1,173 | 53.2 | N/A | ||
Turnout | 2,210 | 39.7 | –6.4 | ||
Registered electors | 5,569 | ||||
Liberal Democrats hold | Swing | 4.7 | |||
Party | Candidate | Votes | % | ±% | |
---|---|---|---|---|---|
Liberal Democrats | Guy Gampell* | 646 | 35.6 | +2.2 | |
Labour | Sam Vosper | 619 | 34.1 | +6.2 | |
Conservative | Dave Winstone | 470 | 25.9 | –4.3 | |
Green | Allie Park-Crowne | 76 | 4.1 | –3.9 | |
Majority | 27 | 1.5 | N/A | ||
Turnout | 1,811 | 30.7 | –1.2 | ||
Registered electors | 5,897 | ||||
Liberal Democrats hold | Swing | 2.0 | |||
Party | Candidate | Votes | % | ±% | |
---|---|---|---|---|---|
Liberal Democrats | Raj Visram* | 1,156 | 49.9 | –0.7 | |
Conservative | Frances Leonard | 788 | 34.0 | +2.3 | |
Green | James Lomas | 195 | 8.4 | –1.3 | |
Labour | Nick Pullinger | 178 | 7.7 | –0.3 | |
Majority | 368 | 15.9 | N/A | ||
Turnout | 2,317 | 39.9 | –7.9 | ||
Registered electors | 5,809 | ||||
Liberal Democrats hold | Swing | 1.5 | |||
Party | Candidate | Votes | % | ±% | |
---|---|---|---|---|---|
Liberal Democrats | Nuala Webb* | 1,234 | 54.8 | +7.6 | |
Conservative | James Cook | 705 | 31.3 | –3.2 | |
Labour | Laurence Chester | 172 | 7.6 | –1.4 | |
Green | Mark Park-Crowne | 140 | 6.3 | –3.1 | |
Majority | 529 | 23.5 | N/A | ||
Turnout | 2,251 | 35.2 | –5.9 | ||
Registered electors | 6,396 | ||||
Liberal Democrats hold | Swing | 5.5 | |||
Party | Candidate | Votes | % | ±% | |
---|---|---|---|---|---|
Liberal Democrats | Andy Thurston | 859 | 49.8 | +18.0 | |
Conservative | Victoria Mead | 615 | 35.6 | +12.7 | |
Labour | Symon Vegro | 156 | 9.0 | +2.8 | |
Green | Stephen Clough | 95 | 5.6 | –2.1 | |
Majority | 244 | 14.2 | N/A | ||
Turnout | 1,725 | 40.2 | –1.7 | ||
Registered electors | 4,292 | ||||
Liberal Democrats hold | Swing | 2.7 | |||
Party | Candidate | Votes | % | ±% | |
---|---|---|---|---|---|
Liberal Democrats | Sharon Hollingsworth* | 1,213 | 48.8 | +7.7 | |
Conservative | Gill Clark | 960 | 38.6 | +1.1 | |
Green | Oliver Hitch | 166 | 6.7 | –6.4 | |
Labour | James Morrell | 148 | 6.0 | –2.3 | |
Majority | 253 | 10.2 | N/A | ||
Turnout | 2,487 | 41.2 | –4.8 | ||
Registered electors | 6,039 | ||||
Liberal Democrats hold | Swing | 3.3 | |||
Party | Candidate | Votes | % | ±% | |
---|---|---|---|---|---|
Liberal Democrats | Harriet Sherlock | 1,144 | 55.5 | +0.7 | |
Labour | Iain Grant | 414 | 20.1 | –0.8 | |
Conservative | Richard Curthoys | 278 | 13.5 | +1.4 | |
Green | Tricia Gibbons | 194 | 9.4 | –2.8 | |
Communist | Mark Ewington | 30 | 1.5 | -1.7 | |
Majority | 730 | 35.4 | N/A | ||
Turnout | 2,060 | 37.7 | –5.1 | ||
Registered electors | 5,458 | ||||
Liberal Democrats hold | Swing | 0.8 | |||
Party | Candidate | Votes | % | ±% | |
---|---|---|---|---|---|
Green | Simon Grover* | 1,045 | 46.1 | +9.4 | |
Liberal Democrats | David Partridge | 760 | 33.4 | –5.9 | |
Conservative | Graham Leonard | 251 | 11.0 | +1.0 | |
Labour | David Byatt | 217 | 9.5 | –4.6 | |
Majority | 285 | 12.7 | N/A | ||
Turnout | 2,273 | 36.9 | –2.7 | ||
Registered electors | 6,164 | ||||
Green hold | Swing | 7.7 | |||
Party | Candidate | Votes | % | ±% | |
---|---|---|---|---|---|
Liberal Democrats | Stephen Cavinder | 1,243 | 47.7 | +3.5 | |
Conservative | Aaron Jacob | 1,079 | 41.4 | +6.3 | |
Labour | Janet Blackwell | 156 | 6.0 | –2.7 | |
Green | Matthew Thomas | 129 | 4.9 | –3.2 | |
Majority | 164 | 6.3 | N/A | ||
Turnout | 2,607 | 39.4 | –4.8 | ||
Registered electors | 6,610 | ||||
Liberal Democrats hold | Swing | 1.4 | |||
Party | Candidate | Votes | % | ±% | |
---|---|---|---|---|---|
Liberal Democrats | Julian Degg | 1,618 | 61.4 | +4.4 | |
Conservative | Susan Devi | 650 | 24.6 | +0.5 | |
Green | Gabriel Roberts | 212 | 8.0 | –3.4 | |
Labour | Geoff Meade | 157 | 6.0 | –1.6 | |
Majority | 968 | 36.8 | N/A | ||
Turnout | 2,637 | 46.1 | –5.0 | ||
Registered electors | 5,722 | ||||
Liberal Democrats hold | Swing | 2.0 | |||
A by-election was held in the St Peters ward on 13 June 2023, after the resignation of Liberal Democrat councillor Danny Clare. [10] [11]
Party | Candidate | Votes | % | ±% | |
---|---|---|---|---|---|
Green | Juliet Voisey | 628 | 44.7 | –1.4 | |
Liberal Democrats | David John Patridge | 537 | 38.2 | +4.8 | |
Conservative | Ambrose Killen | 156 | 11.1 | +0.1 | |
Labour | David James Byatt | 84 | 6.0 | –3.5 | |
Majority | 91 | 6.5 | –6.2 | ||
Turnout | 1,412 | 22.8 | –14.1 | ||
Registered electors | 6,196 | ||||
Green gain from Liberal Democrats | Swing | 3.1 | |||
A second by-election was held in Marshalswick East & Jersey Farm ward on 17 August 2023 following the resignation of Liberal Democrat councillor Elissa Da Costa-Waldman. [12] [13]
Party | Candidate | Votes | % | ±% | |
---|---|---|---|---|---|
Liberal Democrats | Raihaanah Ahmed | 774 | 46.0 | –3.9 | |
Conservative | Frances Leonard | 661 | 39.3 | +5.3 | |
Green | James Lomas | 102 | 6.1 | –2.3 | |
Labour | Nick Pullinger | 82 | 4.9 | –2.8 | |
Independent | Samuel Posner | 62 | 3.7 | N/A | |
Majority | 113 | 6.7 | -9.2 | ||
Turnout | 1,685 | 28.8 | -11.1 | ||
Registered electors | 5,853 | ||||
Liberal Democrats hold | Swing | ||||
A third by-election was held on 7 December 2023 due to a vacancy in the Sandridge and Wheathampstead ward. [14] [15] [16]
Party | Candidate | Votes | % | ±% | |
---|---|---|---|---|---|
Liberal Democrats | Simon Johns | 793 | 55.6 | +6.8 | |
Conservative | Claudio Duran | 480 | 33.7 | -4.9 | |
Green | Oliver Hitch | 78 | 5.5 | -1.2 | |
Labour | James Morrell | 68 | 4.8 | -1.2 | |
Majority | 313 | 21.9 | +11.7 | ||
Turnout | 1,426 | 23.4 | -18.1 | ||
Registered electors | 6,093 | ||||
Liberal Democrats hold | Swing | 13.2% | |||
St Albans, also known as the City and District of St Albans, is a local government district with city status in Hertfordshire, England. Its council is based in St Albans, the largest settlement in the district. The district also includes the town of Harpenden and several villages. The district borders North Hertfordshire, Welwyn Hatfield, Hertsmere, Watford, Three Rivers, Dacorum, and Central Bedfordshire.
Sandridge is a village and civil parish between the city centre of St Albans and Wheathampstead in Hertfordshire, England, forming part of the contiguous built-up area of St Albans.
St Albans is a constituency represented in the House of Commons of the UK Parliament since 2019 by Daisy Cooper, a Liberal Democrat.
Hitchin and Harpenden is a constituency represented in the House of Commons of the UK Parliament since 2017 by Bim Afolami, a Conservative.
Anne Margaret Main is a Conservative Party politician who formerly served as the Member of Parliament for St Albans in Hertfordshire. She was elected at the general election of 2005, and was re-elected in 2010, 2015 and 2017. She lost her seat to Daisy Cooper, a Liberal Democrat, at the 2019 general election.
Sandringham School is a secondary school with academy status in Marshalswick, St Albans, Hertfordshire. It was established in 1988 following a merger of two local schools, Marshalswick School and Wheathampstead School. It occupies the former Marshalswick site, adjacent to Wheatfields Infant and Junior schools. The former Wheathampstead site was used as a training centre by Hertfordshire County Council until 2007, and has now been redeveloped into housing.
The 2008 St Albans City and District Council election took place on 1 May 2008 to elect members of St Albans District Council in Hertfordshire, England. One third of the council was up for election and the Liberal Democrats gained overall control of the council from no overall control.
Marshalswick is a suburb of St Albans in Hertfordshire, England, located around 1.5 miles northeast of the city centre. The area was developed from the 1920s onwards. Neighbouring suburbs include Jersey Farm, Fleetville and Bernards Heath.
The 1998 St Albans City and District Council election took place on 7 May 1998 to elect members of St Albans City and District Council in Hertfordshire, England. One third of the council was up for election and the Liberal Democrats stayed in overall control of the council.
The 2002 St Albans City and District Council election took place on 2 May 2002 to elect members of St Albans District Council in Hertfordshire, England. One third of the council was up for election and the council stayed under no overall control.
The 2004 St Albans City and District Council election took place on 10 June 2004 to elect members of St Albans District Council in Hertfordshire, England. One third of the council was up for election and the council stayed under no overall control.
The 2006 St Albans City and District Council election took place on 4 May 2006 to elect members of St Albans District Council in Hertfordshire, England. One third of the council was up for election and the Liberal Democrats gained overall control of the council from no overall control.
The 2007 St Albans City and District Council election took place on 3 May 2007 to elect members of St Albans District Council in Hertfordshire, England. One third of the council was up for election and the Liberal Democrats lost overall control of the council to no overall control.
The 2010 St Albans City and District Council election took place on 6 May 2010 to elect members of St Albans District Council in Hertfordshire, England. One third of the council was up for election and the Liberal Democrats stayed in overall control of the council.
The 2012 St Albans City and District Council election took place on 3 May 2012 to elect members of St Albans District Council in Hertfordshire, England. One third of the council was up for election and the council stayed under no overall control.
The 2011 St Albans City and District Council election took place on 5 May 2011 to elect members of St Albans District Council in Hertfordshire, England. One third of the council was up for election and the Liberal Democrats lost overall control of the council to no overall control.
The 2014 St Albans City and District Council election took place on 22 May 2014 to elect members of St Albans District Council in Hertfordshire, England. One third of the council was up for election and the council stayed under no overall control.
Daisy Cooper is a British Liberal Democrat politician who has served as the Member of Parliament (MP) for St Albans since 2019. She has served as the Deputy Leader of the Liberal Democrats since 2020, and as the Liberal Democrat spokesperson for Health, Wellbeing and Social Care since 2021.
Harpenden and Berkhamstead is a proposed constituency of the House of Commons in the UK Parliament. Further to the completion of the 2023 Periodic Review of Westminster constituencies, it will first be contested at the next general election.