| ||||||||||||||||||||||||||||||||||
11 out of 33 seats to Harlow District Council 17 seats needed for a majority | ||||||||||||||||||||||||||||||||||
---|---|---|---|---|---|---|---|---|---|---|---|---|---|---|---|---|---|---|---|---|---|---|---|---|---|---|---|---|---|---|---|---|---|---|
Turnout | 25.2% | |||||||||||||||||||||||||||||||||
| ||||||||||||||||||||||||||||||||||
Winner of each seat at the 2023 Harlow District Council election | ||||||||||||||||||||||||||||||||||
|
The 2023 Harlow District Council election took place on 4 May 2023 to elect members of Harlow District Council in Essex, England. [1] This was on the same day as other local elections across England. One third of the council was up for election.
The Conservatives retained their majority on the council. [2] Immediately after the election the Conservative leader of the council, Russell Perrin, announced his resignation as leader. [3] At the subsequent annual council meeting on 25 May 2023 the new Conservative leader, 22-year-old Dan Swords, was appointed leader of the council. [4]
2023 Harlow District Council election | ||||||||||
---|---|---|---|---|---|---|---|---|---|---|
Party | This election | Full council | This election | |||||||
Seats | Net | Seats % | Other | Total | Total % | Votes | Votes % | +/− | ||
Conservative | 5 | 1 | 45.5 | 16 | 21 | 63.6 | 6,675 | 41.5 | –6.6 | |
Labour | 6 | 1 | 54.5 | 6 | 12 | 36.4 | 7,041 | 43.8 | +3.7 | |
Green | 0 | 0.0 | 0 | 0 | 0.0 | 1,524 | 9.5 | +0.5 | ||
Harlow Alliance | 0 | 0.0 | 0 | 0 | 0.0 | 455 | 2.8 | +0.5 | ||
Liberal Democrats | 0 | 0.0 | 0 | 0 | 0.0 | 235 | 1.5 | +1.3 | ||
Reform UK | 0 | 0.0 | 0 | 0 | 0.0 | 111 | 0.7 | N/A | ||
TUSC | 0 | 0.0 | 0 | 0 | 0.0 | 42 | 0.3 | +0.1 | ||
The Statement of Persons Nominated, which details the candidates standing in each ward, was released by Harlow District Council following the close of nomination on 5 April 2023. [5] The results were: [6]
Party | Candidate | Votes | % | ±% | |
---|---|---|---|---|---|
Labour Co-op | Jodi Dunne* | 687 | 50.9 | +6.7 | |
Conservative | Emma Ghaffari | 450 | 33.3 | –11.3 | |
Green | Jennifer Steadman | 142 | 10.5 | +2.9 | |
Liberal Democrats | Christopher Millington | 63 | 4.7 | +1.6 | |
Majority | 237 | 17.6 | N/A | ||
Turnout | 1,350 | 24.7 | –2.9 | ||
Registered electors | 5,469 | ||||
Labour Co-op hold | Swing | 9.0 | |||
Party | Candidate | Votes | % | ±% | |
---|---|---|---|---|---|
Conservative | Andrew Johnson* | 1,000 | 64.1 | –5.3 | |
Labour | Michael Danvers | 402 | 25.8 | +4.9 | |
Green | Bengeman White | 154 | 9.9 | +0.4 | |
Majority | 598 | 38.3 | –10.4 | ||
Turnout | 1,561 | 24.5 | –3.2 | ||
Registered electors | 6,378 | ||||
Conservative hold | Swing | 5.1 | |||
Party | Candidate | Votes | % | ±% | |
---|---|---|---|---|---|
Conservative | David Carter* | 749 | 51.9 | –0.2 | |
Labour | John Strachan | 441 | 30.6 | +0.8 | |
Harlow Alliance | Nicholas Taylor | 173 | 12.0 | –5.9 | |
Green | Paul King | 77 | 5.3 | N/A | |
Majority | 308 | 21.4 | –1.0 | ||
Turnout | 1,442 | 29.8 | –4.3 | ||
Registered electors | 4,837 | ||||
Conservative hold | Swing | 0.5 | |||
Party | Candidate | Votes | % | ±% | |
---|---|---|---|---|---|
Labour | Mark Wilkinson* | 707 | 46.9 | +2.1 | |
Conservative | Danielle Brown | 645 | 42.8 | –5.1 | |
Green | Nathan Ederton | 149 | 9.9 | +2.9 | |
Majority | 62 | 4.1 | N/A | ||
Turnout | 1,507 | 27.8 | –3.0 | ||
Registered electors | 5,429 | ||||
Labour hold | Swing | 3.6 | |||
Party | Candidate | Votes | % | ±% | |
---|---|---|---|---|---|
Labour | Margaret Hulcoop | 988 | 65.2 | +14.3 | |
Conservative | Jayne Saunders | 450 | 29.7 | –8.3 | |
Green | Klara Bow | 66 | 4.4 | –5.9 | |
Majority | 538 | 35.5 | +22.3 | ||
Turnout | 1,516 | 23.6 | –4.2 | ||
Registered electors | 6,415 | ||||
Labour hold | Swing | 11.3 | |||
Party | Candidate | Votes | % | ±% | |
---|---|---|---|---|---|
Labour | Aiden O'Dell | 626 | 47.4 | +4.3 | |
Conservative | Geoffrey Longster | 320 | 24.2 | –16.5 | |
Green | Jamie Gilbert | 176 | 13.3 | –2.5 | |
Reform UK | Mark Gough | 111 | 8.4 | N/A | |
Liberal Democrats | Lesley Rideout | 82 | 6.2 | N/A | |
Majority | 306 | 23.2 | +20.7 | ||
Turnout | 1,320 | 24.8 | –4.6 | ||
Registered electors | 5,332 | ||||
Labour hold | Swing | 10.4 | |||
Party | Candidate | Votes | % | ±% | |
---|---|---|---|---|---|
Labour | Nancy Watson* | 705 | 52.0 | +2.3 | |
Conservative | Elena Hardware | 452 | 33.3 | –6.0 | |
Green | Kim O'Connor | 103 | 7.6 | –3.0 | |
Liberal Democrats | Robert Thurston | 90 | 6.7 | N/A | |
Majority | 253 | 18.6 | +8.2 | ||
Turnout | 1,357 | 22.8 | –4.9 | ||
Registered electors | 5,944 | ||||
Labour hold | Swing | 4.2 | |||
Party | Candidate | Votes | % | ±% | |
---|---|---|---|---|---|
Conservative | Sue Livings* | 1,073 | 48.7 | –3.8 | |
Labour | Stefan Mullard | 747 | 33.9 | +5.1 | |
Green | Yasmin Gregory | 325 | 14.7 | –1.1 | |
TUSC | Paul Lenihan | 42 | 1.9 | ±0.0 | |
Majority | 326 | 14.8 | –8.7 | ||
Turnout | 2,204 | 25.5 | –3.8 | ||
Registered electors | 8,652 | ||||
Conservative hold | Swing | 4.5 | |||
Party | Candidate | Votes | % | ±% | |
---|---|---|---|---|---|
Conservative | John Steer | 504 | 42.7 | –9.6 | |
Labour Co-op | Jake Shepherd | 476 | 40.4 | +1.4 | |
Harlow Alliance | Karen James | 105 | 8.9 | N/A | |
Green | Gareth Williams | 90 | 7.6 | –0.7 | |
Majority | 28 | 2.4 | –11.0 | ||
Turnout | 1,179 | 23.1 | –3.6 | ||
Registered electors | 5,096 | ||||
Conservative gain from Labour | Swing | 5.5 | |||
Party | Candidate | Votes | % | ±% | |
---|---|---|---|---|---|
Conservative | Clive Souter* | 574 | 43.5 | –8.1 | |
Labour | Anita Schultschik | 481 | 36.4 | +4.4 | |
Harlow Alliance | Alan Leverett | 177 | 13.4 | +2.3 | |
Green | David Margetts | 86 | 6.5 | +1.4 | |
Majority | 93 | 7.0 | –12.6 | ||
Turnout | 1,321 | 26.2 | –3.0 | ||
Registered electors | 5,049 | ||||
Conservative hold | Swing | 6.3 | |||
Party | Candidate | Votes | % | ±% | |
---|---|---|---|---|---|
Labour | Daniella Pritchard | 781 | 56.0 | +7.9 | |
Conservative | Brian Kasule | 458 | 32.8 | –6.9 | |
Green | Julie Taylor | 156 | 11.2 | –1.0 | |
Majority | 323 | 23.0 | N/A | ||
Turnout | 1,402 | 25.2 | –3.9 | ||
Registered electors | 5,557 | ||||
Labour hold | Swing | 7.4 | |||
The Conservative leader of the council, Russell Perrin, said the election was a "brilliant result" for the party. [10] Robert Halfon, the Conservative MP for Harlow, thanked voters and noted that the gain from Labour in Staple Tye resulted in the ward having all Conservative councillors for the first time. [11]
The leader of the Labour group on the council, Chris Vince, called the election a "good result for Harlow Labour", pointing to the party winning the popular vote and the majority of seats up for election. [12]
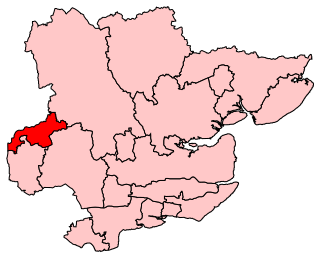
Harlow is a constituency represented in the House of Commons of the UK Parliament since 2010 by Robert Halfon, a Conservative.
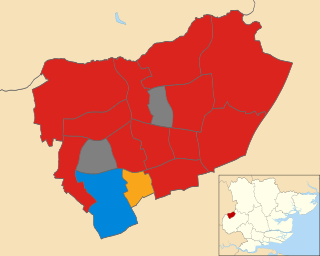
The 1998 Harlow District Council election took place on 7 May 1998 to elect members of Harlow District Council in Essex, England. One third of the council was up for election and the Labour party stayed in overall control of the council.
The 1999 Harlow District Council election took place on 6 May 1999 to elect members of Harlow District Council in Essex, England. One third of the council was up for election and the Labour party stayed in overall control of the council.
The 2000 Harlow District Council election took place on 4 May 2000 to elect members of Harlow District Council in Essex, England. One third of the council was up for election and the Labour party stayed in overall control of the council.
The 2002 Harlow District Council election took place on 2 May 2002 to elect members of Harlow District Council in Essex, England. The whole council was up for election with boundary changes since the last election in 2000 reducing the number of seats by 9. The Labour party lost overall control of the council to no overall control.
The 2003 Harlow District Council election took place on 1 May 2003 to elect members of Harlow District Council in Essex, England. One third of the council was up for election and the council stayed under no overall control.
The 2007 Harlow District Council election took place on 3 May 2007 to elect members of Harlow District Council in Essex, England. One third of the council was up for election and the council stayed under no overall control.
The 2008 Harlow District Council election took place on 1 May 2008 to elect members of Harlow District Council in Essex, England. One third of the council was up for election and the Conservative party gained overall control of the council from no overall control.
An election to Essex County Council took place on 1 May 1997 as part of the 1997 United Kingdom local elections. 79 councillors were elected from various electoral divisions, which returned either one or two county councillors each by first-past-the-post voting for a four-year term of office. With the creation of Southend-on-Sea Borough Council and Thurrock Council in 1998 the number of seats contested at this election was reduced by 19. In 1993 the breakdown of these seats were, Lab 9 Con 5 LD 5.
Harlow District Council is the local authority for Harlow in Essex, England. Harlow is a non-metropolitan district, covering just the town of Harlow itself. The council generally styles itself Harlow Council.
The 2010 Harlow District Council election took place on 6 May 2010 to elect members of Harlow District Council in Essex, England. One third of the council was up for election and the Conservative party stayed in overall control of the council.
The 2011 Harlow District Council election took place on 5 May 2011 to elect members of Harlow District Council in Essex, England. One third of the council was up for election and the Conservative Party stayed in overall control of the council.
The 2012 Harlow District Council election took place on 3 May 2012 to elect members of Harlow District Council in Essex, England. One third of the council was up for election and the Labour Party gained overall control of the council from the Conservative Party.
The 2014 Harlow District Council election took place on 22 May 2014 to elect members of Harlow District Council in Essex, England. One third of the council was up for election and the Labour Party stayed in overall control of the council.
The 2015 Harlow District Council election took place on 7 May 2015 to elect members of Harlow District Council in Essex, England. One third of the council was up for election and Labour Party councillors increased their control of the council as the governing group, gaining one councillor and suffering no losses.
The 2016 Harlow District Council election took place on 5 May 2016 to elect members of Harlow District Council in England. This was on the same day as other local elections.
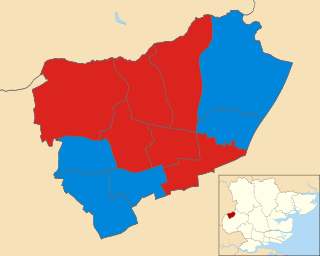
The 2018 Harlow District Council election took place on 3 May 2018 to elect members of Harlow District Council in Essex. This was on the same day as other local elections. Labour increased their majority on the council by gaining one seat.
The 1995 Harlow District Council election took place on 4 May 1995 to elect members of Harlow District Council in Essex, England. This was on the same day as other local elections. The Labour Party retained control of the council, which it had held continuously since the council's creation in 1973.
The 1996 Harlow District Council election took place on 2 May 1996 to elect members of Harlow District Council in Essex, England. This was on the same day as other local elections. The Labour Party retained control of the council, which it had held continuously since the council's creation in 1973.
The 2024 Harlow District Council election was held on Thursday 2 May 2024, alongside the other local elections in the United Kingdom being held on the same day. All 33 members of Harlow District Council in Essex were elected following boundary changes.