1965 Essex County Council election

Last updated
1965 Essex County Council election
Flag of Essex.svg
25 March 1965 (1965-03-25) 1967  

All 77 seats to Essex County Council
39 seats needed for a majority
Turnout27.7%
 First partySecond partyThird party
  No image wide.svg No image wide.svg No image wide.svg
Party Conservative Labour Liberal
Seats won47291
Popular vote88,21469,8868,522
Percentage52.3%41.4%5.1%

Council control after election


Conservative

The 1965 Essex County Council election took place on 25 March 1965 to elect members of Essex County Council in England. [1]

Contents

Summary

1965 Essex County Council election
PartySeatsGainsLossesNet gain/lossSeats %Votes %Votes+/−
  Conservative 4761.052.388,214
  Labour 2937.741.469,886
  Liberal 11.35.18,522
  Independent 00.01.11,884
  Communist 00.00.1131

Division results

Results from 4 divisions are missing from the source document and are therefore not listed here.

Bardfield

Bardfield
PartyCandidateVotes%
Conservative Edith BorthwickUnopposed
Registered electors 5,966
Conservative win

Basildon (Billericay)

Basildon (Billericay)
PartyCandidateVotes%
Conservative Coker 1,888 80.6
Labour Buckley45419.4
Majority1,43461.2
Turnout 2,34326.2
Registered electors 8,947
Conservative win

Basildon (Central)

Basildon (Central)
PartyCandidateVotes%
Labour Robert Payne 708 60.6
Conservative Shackleton46039.4
Majority24821.2
Turnout 1,16814.6
Registered electors 8,018
Labour win

Basildon (Fryerns)

Basildon (Fryerns)
PartyCandidateVotes%
Labour Turner 755 66.3
Conservative Nicholls32228.3
Communist Denny625.4
Majority43338.0
Turnout 1,13914.1
Registered electors 8,079
Labour win

Basildon (Laindon)

Basildon (Laindon)
PartyCandidateVotes%
Labour Violet Palmer 696 59.6
Conservative de-la Bertauche47240.4
Majority22419.2
Turnout 1,16816.1
Registered electors 7,253
Labour win

Basildon (Langdon Hills)

Basildon (Langdon Hills)
PartyCandidateVotes%
Conservative Cullis 935 56.0
Labour Forster73544.0
Majority20012.0
Turnout 1,67021.7
Registered electors 7,703
Conservative win

Basildon (Pitsea)

Basildon (Pitsea)
PartyCandidateVotes%
Labour John Elderton 746 54.6
Conservative Thorpe62045.4
Majority1269.2
Turnout 1,36618.6
Registered electors 7,354
Labour win

Basildon (Ramsden)

Basildon (Ramsden)
PartyCandidateVotes%
Conservative William Redbond 1,281 69.7
Labour Burnett55830.3
Majority72339.4
Turnout 1,83923.7
Registered electors 7,766
Conservative win

Basildon (Wickford)

Basildon (Wickford)
PartyCandidateVotes%
Conservative Fred Hodgson 1,651 61.3
Labour Walsh1,04338.7
Majority60822.6
Turnout 2,69427.3
Registered electors 9,883
Conservative win

Benfleet (East)

Benfleet (East)
PartyCandidateVotes%
Conservative Jeffrey Daniels 2,174 67.7
Labour Evans1,03932.3
Majority1,13535.4
Turnout 3,21326.2
Registered electors 12,249
Conservative win

Benfleet (West)

Benfleet (West)
PartyCandidateVotes%
Conservative Walter Marrison 2,158 59.3
Labour Herington1,48440.7
Majority67418.6
Turnout 3,64222.8
Registered electors 16,010
Conservative win

Braintree & Bocking

Braintree & Bocking
PartyCandidateVotes%
Labour Tabor 2,574 56.2
Conservative Ralph Batey2,00843.8
Majority56612.4
Turnout 4,58232.3
Registered electors 14,169
Labour win

Brentwood (Central)

Brentwood (Central)
PartyCandidateVotes%
Conservative Isgrove 1,543 77.8
Labour Morgan44122.2
Majority1,98455.6
Turnout 1,98425.2
Registered electors 7,859
Conservative win

Brentwood (Hutton)

Brentwood (Hutton)
PartyCandidateVotes%
Conservative John Crofton 1,884 51.5
Liberal Wernick93525.5
Labour O'Brien84223.0
Majority94926.0
Turnout 3,66137.9
Registered electors 9,649
Conservative win

Brentwood (North)

Brentwood (North)
PartyCandidateVotes%
Conservative Davidson 1,527 62.3
Liberal Neal56723.1
Labour Rowe35714.6
Majority96039.2
Turnout 2,45131.6
Registered electors 7,766
Conservative win

Brentwood (South)

Brentwood (South)
PartyCandidateVotes%
Conservative Ernest Sole 1,974 54.1
Labour Horovitch1,67545.9
Majority2998.2
Turnout 3,64940.7
Registered electors 8,969
Conservative win

Brightlingsea

Brightlingsea
PartyCandidateVotes%
Liberal Thomas Dale 832 35.9
Conservative Gooch77733.5
Labour French71130.6
Majority552.4
Turnout 2,32030.5
Registered electors 7,598
Liberal win

Broomfield

Broomfield
PartyCandidateVotes%
Conservative Robert EdenUnopposed
Registered electors 6,858
Conservative win

Canvey Island

Canvey Island
PartyCandidateVotes%
Labour Arthur Mason 1,748 64.5
Conservative Smith96235.5
Majority78629.0
Turnout 2,71019.6
Registered electors 13,797
Labour win

Chelmsford (East)

Chelmsford (East)
PartyCandidateVotes%
Conservative Frederick Ward 1,010 64.0
Labour Landers56836.0
Majority44228.0
Turnout 1,57824.6
Registered electors 6,404
Conservative win

Chelmsford (North)

Chelmsford (North)
PartyCandidateVotes%
Labour Henry Woodcraft 1,781 57.6
Conservative King1,30942.4
Majority47215.2
Turnout 3,09024.8
Registered electors 12,464
Labour win

Chelmsford (South)

Chelmsford (South)
PartyCandidateVotes%
Conservative Evelyn Hockley 1,550 72.3
Labour Baker59427.7
Majority95644.6
Turnout 2,14423.1
Registered electors 9,276
Conservative win

Chelmsford (West)

Chelmsford (West)
PartyCandidateVotes%
Labour Miriam Edwards 792 40.2
Conservative Fuche73637.4
Independent Verdult44022.4
Majority562.8
Turnout 1,96828.1
Registered electors 7,000
Labour win

Chigwell (Buckhurst Hill)

Chigwell (Buckhurst Hill)
PartyCandidateVotes%
Conservative Ernest Perry 1,482 73.8
Labour Hempstead52626.2
Majority95647.6
Turnout 2,00824.2
Registered electors 8,294
Conservative win

Chigwell (Chigwell)

Chigwell (Chigwell)
PartyCandidateVotes%
Conservative Leslie Wilson 967 87.6
Labour Palfreman13712.4
Majority83075.2
Turnout 1,10417.9
Registered electors 6,175
Conservative win

Chigwell (Loughton North)

Chigwell (Loughton North)
PartyCandidateVotes%
Labour Frank Davis 1,486 54.5
Conservative L. Davis1,24245.5
Majority2449.0
Turnout 2,72826.0
Registered electors 10,509
Labour win

Chigwell (Loughton South)

Chigwell (Loughton South)
PartyCandidateVotes%
Conservative Norman Crafford 1,862 57.8
Labour William Archer1,28840.0
Communist Hinchliff692.1
Majority57417.8
Turnout 3,21928.6
Registered electors 11,257
Conservative win

Clacton (North East)

Clacton (North East)
PartyCandidateVotes%
Conservative Daphne Nicolls 1,647 84.3
Labour White30615.7
Majority1,34168.6
Turnout 1,95316.5
Registered electors 11,866
Conservative win

Clacton (South West)

Clacton (South West)
PartyCandidateVotes%
Conservative Hyde 1,913 82.7
Labour Madden40017.3
Majority1,51365.4
Turnout 2,31317.4
Registered electors 13,325
Conservative win

Coggeshall

Coggeshall
PartyCandidateVotes%
Conservative Robert Dixon Smith 1,963 54.7
Labour Christopher Walker1,62645.3
Majority3379.4
Turnout 3,58944.8
Registered electors 8,005
Conservative win

Colchester (Central)

Colchester (Central)
PartyCandidateVotes%
Labour Frederick Parsley 1,215 54.7
Conservative Odling1,00745.3
Majority2089.4
Turnout 2,22233.7
Registered electors 6,589
Labour win

Colchester (East)

Colchester (East)
PartyCandidateVotes%
Labour Eileen KomlosyUnopposed
Registered electors 8,568
Labour win

Colchester (North)

Colchester (North)
PartyCandidateVotes%
Conservative Underwood 1,424 54.1
Labour Ladbrook1,21045.9
Majority2148.2
Turnout 2,63430.2
Registered electors 8,728
Conservative win

Colchester (South)

Colchester (South)
PartyCandidateVotes%
Labour Ivor BrownUnopposed
Registered electors 9,061
Labour win

Colchester (West)

Colchester (West)
PartyCandidateVotes%
Conservative Sir John GreavesUnopposed
Registered electors 9,061
Conservative win

Danbury

Danbury
PartyCandidateVotes%
Conservative Reed 1,384 68.8
Labour Davida Higgin62831.2
Majority75637.6
Turnout 2,01229.4
Registered electors 6,834
Conservative win

Dedham & Stanway

Dedham & Stanway
PartyCandidateVotes%
Conservative Gerald MilsomUnopposed
Registered electors 10,524
Conservative win

Dunmow

Dunmow
PartyCandidateVotes%
Conservative Margaret Davey 2,013 75.6
Labour Lynch65124.4
Majority1,36251.2
Turnout 2,66435.0
Registered electors 7,623
Conservative win

Epping

Epping
PartyCandidateVotes%
Conservative George Padfield 1,379 53.7
Labour Christopher Morris81131.6
Liberal Grant37914.8
Majority56822.1
Turnout 2,56938.4
Registered electors 6,693
Conservative win

Epping Upland

Epping Upland
PartyCandidateVotes%
Conservative Robert Daniels 1,549 67.2
Labour Jones75632.8
Majority79334.4
Turnout 2,30529.8
Registered electors 7,739
Conservative win

Frinton & Walton

Frinton & Walton
PartyCandidateVotes%
Conservative Margaret Gray 1,939 59.6
Liberal Rayner94729.1
Labour Phillips36911.3
Majority99230.5
Turnout 3,25536.5
Registered electors 8,922
Conservative win

Great Baddow

Great Baddow
PartyCandidateVotes%
Conservative John Foxon 1,773 63.4
Labour Hempstead1,02536.6
Majority74826.8
Turnout 2,79831.3
Registered electors 8,939
Conservative win

Halstead

Halstead
PartyCandidateVotes%
Conservative Geoffrey Waterer 2,745 56.3
Labour Dixey2,12843.7
Majority61712.6
Turnout 4,87353.9
Registered electors 9,037
Conservative win

Harlow (Harlow & Mark Hall)

Harlow (Harlow & Mark Hall)
PartyCandidateVotes%
Labour Anderson 1,568 75.9
Liberal Preece49924.1
Majority1,06951.8
Turnout 2,06723.3
Registered electors 8,891
Labour win

Harlow (Netteswell & Little Parndon)

Harlow (Netteswell & Little Parndon)
PartyCandidateVotes%
Labour Sonia Anderson 1,447 75.8
Liberal Jackson46324.2
Majority98451.6
Turnout 1,91022.3
Registered electors 8,571
Labour win

Harlow (Potter Street & Brays Grove)

Harlow (Potter Street & Brays Grove)
PartyCandidateVotes%
Labour Lehane 738 84.8
Liberal Jackson13215.2
Majority60669.6
Turnout 87015.2
Registered electors 5,709
Labour win

Harlow (Town Centre & Great Parndon)

Harlow (Town Centre & Great Parndon)
PartyCandidateVotes%
Labour Howett 1,232 61.5
Conservative Carson59229.6
Liberal Perry1798.9
Majority64031.9
Turnout 2,00332.2
Registered electors 6,213
Labour win

Harlow (Tye Green & Latton Bush)

Harlow (Tye Green & Latton Bush)
PartyCandidateVotes%
Labour Karger 1,248 77.7
Liberal Green35822.3
Majority89055.4
Turnout 1,60623.7
Registered electors 6,766
Labour win

Harwich

Harwich
PartyCandidateVotes%
Labour Harry Gochin 1,240 46.2
Independent Burtsal1,04038.7
Independent Rose40415.1
Majority2007.5
Turnout 2,68428.0
Registered electors 9,578
Labour win

Hedingham

Hedingham
PartyCandidateVotes%
Labour Dorothy Stieber 2,301 52.7
Conservative Warren2,06347.3
Majority2365.4
Turnout 4,36455.5
Registered electors 7,862
Labour win

Hockley & Rawreth

Hockley & Rawreth
PartyCandidateVotes%
Conservative William Wright 1,411 68.5
Labour Lambe64931.5
Majority76237.0
Turnout 2,06020.6
Registered electors 9,984
Conservative win

Maldon

Maldon
PartyCandidateVotes%
Conservative James Brown 1,725 52.1
Labour Brewster1,58447.9
Majority1414.2
Turnout 3,30940.8
Registered electors 8,106
Conservative win

Mersea

Mersea
PartyCandidateVotes%
Conservative Raymond Bunn 2,178 68.8
Labour Edward Lilley99031.3
Majority1,18837.5
Turnout 3,16828.0
Registered electors 11,330
Conservative win

Ongar

Ongar
PartyCandidateVotes%
Conservative Ernest Cooke 2,163 68.1
Labour Hammond1,01431.9
Majority1,14936.2
Turnout 3,17735.6
Registered electors 8,934
Conservative win

Southminster

Southminster
PartyCandidateVotes%
Conservative Watts 1,647 64.9
Labour Harris64125.2
Liberal Barlow2519.9
Majority1,00639.7
Turnout 2,53931.0
Registered electors 8,181
Conservative win

Stansted

Stansted
PartyCandidateVotes%
Conservative Robert Dyball 2,208 63.6
Labour Wilson1,26336.4
Majority94527.2
Turnout 3,47141.5
Registered electors 8,375
Conservative win

Stock

Stock
PartyCandidateVotes%
Conservative Robert Foulsham 1,156 77.6
Labour Guilder33322.4
Majority1,48955.2
Turnout 1,48923.0
Registered electors 6,479
Conservative win

Tendring

Tendring
PartyCandidateVotes%
Conservative Fred Aylmore 1,119 52.7
Labour Ann Hoskyna1,00447.3
Majority1155.4
Turnout 2,12325.0
Registered electors 8,495
Conservative win

Thaxted

Thaxted
PartyCandidateVotes%
Conservative Gerald Curtis 1,552 53.1
Labour Peter Harrison1,37246.9
Majority1806.2
Turnout 2,92440.9
Registered electors 7,147
Conservative win

Theydon

Theydon
PartyCandidateVotes%
Conservative David Jones 2,137 55.5
Liberal Logan93624.3
Labour Gerrard77720.2
Majority1,20131.2
Turnout 3,85041.1
Registered electors 9,369
Conservative win

Thurrock (Chadwell)

Thurrock (Chadwell)
PartyCandidateVotes%
Labour Arthur Siddons 552 79.5
Liberal Sidney Senior14220.5
Majority41059.0
Turnout 69410.8
Registered electors 6,446
Labour win

Thurrock (Grays Thurrock)

Thurrock (Grays Thurrock)
PartyCandidateVotes%
Labour Harold Fletcher 1,080 60.0
Conservative Bright61634.2
Liberal Catty1045.8
Majority46425.8
Turnout 1,80017.2
Registered electors 10,443
Labour win

Thurrock (Little Thurrock)

Thurrock (Little Thurrock)
PartyCandidateVotes%
Labour Roy Robertson 792 50.3
Conservative Robinson78247.7
Majority100.6
Turnout 1,57423.5
Registered electors 6,691
Labour win

Thurrock (Orsett & Stifford)

Thurrock (Orsett & Stifford)
PartyCandidateVotes%
Labour John Pollard 1,080 52.0
Conservative Price73035.1
Liberal Ronald Knight26712.9
Majority35016.9
Turnout 2,07724.8
Registered electors 8,365
Labour win

Thurrock (South Ockendon)

Thurrock (South Ockendon)
PartyCandidateVotes%
Labour Wootton 984 85.6
Liberal Bowles16514.4
Majority81971.2
Turnout 1,14910.0
Registered electors 11,459
Labour win

Thurrock (Stanford-le-Hope & Corringham)

Thurrock (Stanford-le-Hope & Corringham)
PartyCandidateVotes%
Labour Julian Norris 1,691 59.0
Conservative Hart1,06437.1
Liberal Sargeant1133.9
Majority62721.9
Turnout 2,86821.9
Registered electors 13,092
Labour win

Thurrock (Tilbury)

Thurrock (Tilbury)
PartyCandidateVotes%
Labour Albert Jones 564 95.6
Liberal Percy Goodyear264.4
Majority53891.2
Turnout 5909.9
Registered electors 5,963
Labour win

Thurrock (West Thurrock & Aveley)

Thurrock (West Thurrock & Aveley)
PartyCandidateVotes%
Labour Ridgwell 620 83.8
Liberal Beadle12016.2
Majority50067.6
Turnout 7407.9
Registered electors 9,369
Labour win

Tollesbury

Tollesbury
PartyCandidateVotes%
Conservative William Gimson 1,843 60.9
Liberal White64421.3
Labour Lane53817.8
Majority1,19939.6
Turnout 3,02539.6
Registered electors 7,637
Conservative win

Waltham Abbey

Waltham Abbey
PartyCandidateVotes%
Conservative Ellen Tuck 1,741 55.8
Labour Allen1,37844.2
Majority36311.6
Turnout 3,11939.8
Registered electors 7,828
Conservative win

Witham

Witham
PartyCandidateVotes%
Labour Thomas Mott 1,666 55.4
Conservative Elizabeth Clarke1,33944.6
Majority32710.8
Turnout 3,00543.2
Registered electors 6,960
Labour win

Wivenhoe

Wivenhoe
PartyCandidateVotes%
Labour Derek Crosfield 1,138 41.9
Conservative Hunneyball1,11841.1
Liberal Fitch46317.0
Majority200.8
Turnout 2,71931.3
Registered electors 8,684
Labour win

Writtle

Writtle
PartyCandidateVotes%
Conservative Beryl PlattUnopposed
Registered electors 7,445
Conservative win

Related Research Articles

<span class="mw-page-title-main">Greater London Council</span> English local administrative body (1965–1986)

The Greater London Council (GLC) was the top-tier local government administrative body for Greater London from 1965 to 1986. It replaced the earlier London County Council (LCC) which had covered a much smaller area. The GLC was dissolved in 1986 by the Local Government Act 1985 and its powers were devolved to the London boroughs and other entities. A new administrative body, known as the Greater London Authority (GLA), was established in 2000.

<span class="mw-page-title-main">County Borough of East Ham</span>

East Ham was a local government district in the far south west of Essex from 1878 to 1965. It extended from Wanstead Flats in the north to the River Thames in the south and from Green Street in the west to Barking Creek in the east. It was part of the London postal district and Metropolitan Police District.

<span class="mw-page-title-main">County Borough of West Ham</span> Historical local government district in the extreme south west of Essex

West Ham was a local government district in the extreme south west of Essex from 1886 to 1965, forming part of the built-up area of London, although outside the County of London. It was immediately north of the River Thames and east of the River Lea.

<span class="mw-page-title-main">Hornchurch Urban District</span>

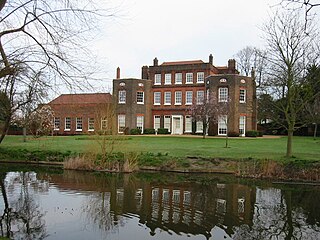
Hornchurch was a local government district in southwest Essex from 1926 to 1965, formed as an urban district for the civil parish of Hornchurch. It was greatly expanded in 1934 with the addition of Cranham, Great Warley, Rainham, Upminster and Wennington; and in 1936 by gaining North Ockendon. Hornchurch Urban District Council was based at Langtons House in Hornchurch from 1929. The district formed a suburb of London and with a population peaking at 131,014 in 1961, it was one of the largest districts of its type in England. It now forms the greater part of the London Borough of Havering in Greater London.

Essex County Council in England is elected every four years. Since the last boundary changes in 2005, 75 councillors are elected from 70 wards.

Surrey County Council is elected every four years and was made in 1889 under the Local Government Act 1888. Since 1965 this council has had one of two statuses as to its body of councillors: no overall political control, or overall Conservative party control.

<span class="mw-page-title-main">Newham London Borough Council</span> Local authority in London, England

Newham London Borough Council also known as Newham Council, is the local authority for the London Borough of Newham in Greater London, England. It is a London borough council, one of 32 in London. The council has been under Labour majority control since 1971. It has been led by a directly elected mayor since 2002. The council meets at Newham Town Hall in East Ham and has its main offices at 1000 Dockside Road, overlooking the Royal Albert Dock.

<span class="mw-page-title-main">Essex County Council</span> English principal local authority in the East of England

Essex County Council is the county council that governs the non-metropolitan county of Essex in England. It has 75 councillors, elected from 70 divisions, and has been under Conservative majority control since 2001. The council meets at County Hall in the centre of Chelmsford. It is a member of the East of England Local Government Association.

The 2002 Colchester Borough Council election took place on 2 May 2002 to elect members of Colchester Borough Council in Essex, England. This was the same day as the other 2002 local elections in the United Kingdom.

<span class="mw-page-title-main">2013 Essex County Council election</span> 2013 UK local government election

An election to Essex County Council took place on 2 May 2013 as part of the 2013 United Kingdom local elections. 75 councillors were elected from 70 electoral divisions, which returned either one or two county councillors each by first-past-the-post voting for a four-year term of office. The electoral divisions were the same as those used at the previous election in 2009. No elections were held in Thurrock or Southend-on-Sea, which are unitary authorities outside the area covered by the County Council.

<span class="mw-page-title-main">2003 Colchester Borough Council election</span> 2003 UK local government election

The 2003 Colchester Borough Council election took place on 1 May 2003 to elect members of Colchester Borough Council in Essex, England. This was the same day as the other 2003 United Kingdom local elections. One third of the seats were up for election and the council stayed under no overall control.

<span class="mw-page-title-main">2004 Colchester Borough Council election</span> 2004 UK local government election

The 2004 Colchester Borough Council election took place on 10 June 2004 to elect members of Colchester Borough Council in Essex, England. This was the same day as the other 2004 United Kingdom local elections and as the 2004 European Parliament Elections. One third of the seats were up for election and the council stayed under no overall control.

<span class="mw-page-title-main">Essex</span> Ceremonial county in the East of England

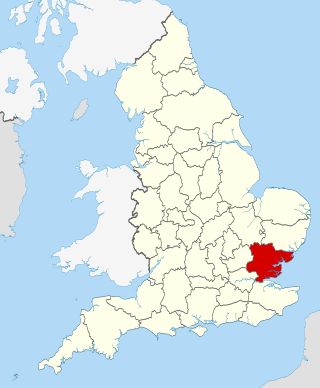
Essex is a ceremonial county in the East of England, and one of the home counties. It is bordered by Cambridgeshire and Suffolk to the north, the North Sea to the east, Kent across the Thames Estuary to the south, Greater London to the south-west, and Hertfordshire to the west. The largest settlement is Southend-on-Sea, and the county town is Chelmsford.

An election to Essex County Council took place on 7 June 2001 as part of the 2001 United Kingdom local elections. 79 councillors were elected from various electoral divisions, which returned either one or two county councillors each by first-past-the-post voting for a four-year term of office. The electoral divisions were the same as those used at the previous election in 1997.

An election to Essex County Council took place on 1 May 1997 as part of the 1997 United Kingdom local elections. 79 councillors were elected from various electoral divisions, which returned either one or two county councillors each by first-past-the-post voting for a four-year term of office. With the creation of Southend-on-Sea Borough Council and Thurrock Council in 1998 the number of seats contested at this election was reduced by 19. In 1993 the breakdown of these seats were, Lab 9 Con 5 LD 5.

<span class="mw-page-title-main">2000 Colchester Borough Council election</span> 2000 UK local government election

The 2000 Colchester Borough Council election took place on 4 May 2000 to elect members of Colchester Borough Council in Essex, England. One third of the council was up for election and the council stayed under no overall control.

<span class="mw-page-title-main">2007 Colchester Borough Council election</span> 2007 UK local government election

The 2007 Colchester Borough Council election took place on 3 May 2007 to elect members of Colchester Borough Council in Essex, England. One third of the council was up for election and the council stayed under no overall control.

The 1999 Castle Point Borough Council election took place on 6 May 1999 to elect members of Castle Point Borough Council in Essex, England. The whole council was up for election and the Labour party stayed in overall control of the council.

<span class="mw-page-title-main">2004 Castle Point Borough Council election</span> 2004 UK local government election

The 2004 Castle Point Borough Council election took place on 10 June 2004 to elect members of Castle Point Borough Council in Essex, England. One third of the council was up for election and the Conservative party stayed in overall control of the council.

The 1967 Essex County Council election took place on 15 April 1967 to elect members of Essex County Council in England.

References

  1. "Essex County Council elections - 15 April 1967". Essex County Council. Archived from the original on 22 February 2014. Retrieved 6 January 2023.{{cite web}}: CS1 maint: bot: original URL status unknown (link)