2019 Southend-on-Sea Borough Council election

Last updated

2019 Southend-on-Sea Borough Council
Flag of Essex.svg
  2018 2 May 2019 (2019-05-02) 2021  

17 out of 51 seats to Southend-on-Sea Borough Council
26 seats needed for a majority
Turnout31.7%
 First partySecond partyThird party
  James Courtenay (2014) (cropped).jpg Ian Gilbert (cropped).jpg
Ind
LeaderJames CourtenayIan Gilbertn/a
Party Conservative Labour Independent
Leader since8 March 2019 [1] Oct/Nov 2010n/a
Leader's seat Blenheim Park (defeated)Victorian/a
Last election29 seats, 37.0%11 seats, 27.0%9 seats, 19.5%
Seats before281110
Seats won455
Seats after201412
Seat changeDecrease2.svg8Increase2.svg3Increase2.svg2
Popular vote11,2658,96210,097
Percentage27.0%20.8%24.2%
SwingDecrease2.svg10.0%Decrease2.svg6.2%Increase2.svg4.7%

 Fourth partyFifth party
  Carole Mulroney (cropped).jpg
Green
LeaderCarole Mulroneyn/a
Party Liberal Democrats Green
Leader sinceMay 2017n/a
Leader's seat Leigh n/a
Last election2 seats, 12.7%0 seats, 2.8%
Seats before20
Seats won30
Seats after50
Seat changeIncrease2.svg3Steady2.svg
Popular vote5,8483,126
Percentage14.1%7.5%
SwingIncrease2.svg1.4%Increase2.svg4.7%

Southend-on-Sea Borough Council election 2019 results.svg
Map showing council seats results contested during the election

Southend Borough Council 2019.svg

Leader before election

John Lamb
Conservative

Leader after election

Tony Cox
Conservative
No overall control

Elections to Southend-on-Sea Borough Council took place on 2 May 2019. This was on the same day as other local elections across the United Kingdom. [2]

Contents

The election led to the majority Conservative administration being replaced by a "rainbow coalition" between the Independents, Labour and the Liberal Democrats, which was voted in by a vote of 27-20. [3]

Composition

Directly after the 2018 election the composition of the council was:

112929
LabourLib DemIndConservative

Prior to the election the composition of the council was:

1121028
LabourLib DemIndConservative

After the election, the composition of the council was:

1451220
LabourLib DemIndConservative

Result summary

2019 Southend-on-Sea Borough Council election
PartyThis electionFull councilThis election
SeatsNetSeats %OtherTotalTotal %VotesVotes %+/−
  Conservative 4Decrease2.svg 823.5162039.211,26527.0–10.0
  Independent 5Increase2.svg 229.471223.510,09724.2+4.8
  Labour 5Increase2.svg 329.491427.58,96220.8–6.2
  Liberal Democrats 3Increase2.svg 317.6259.85,84814.1+1.4
  Green 0Steady2.svg0.0000.03,1267.5+4.7
  UKIP 0Steady2.svg0.0000.01,9604.7+3.8
  For Britain 0Steady2.svg0.0000.03440.1New
  Psychedelic Future 0Steady2.svg0.0000.0510.0±0.0
  Women's Equality 0Steady2.svg0.0000.0380.0New

Results

Belfairs

Belfairs
PartyCandidateVotes%±%
Conservative Lesley Pamela Salter 862 34.5 –15.9
Independent Bob Hazell79531.9New
Labour Rachel Louise Charman Dalton2329.3–6.7
Liberal Democrats Michael Russel Grimwade1385.5–0.7
UKIP David Arthur Darling28611.5+5.6
Green Nick Brown1837.3+2.7
Majority672.7–38.7
Turnout 2,49633.6–1.6
Conservative hold Swing Decrease2.svg23.9

Blenheim Park

Blenheim Park
PartyCandidateVotes%±%
Independent Keith Evans 883 34.1 +13.7
Labour Maxine Sadza75529.1–6.0
Conservative James Courtenay68826.5–5.9
Green Peter Walker1485.9New
Liberal Democrats Charlie Grosvenor1194.6–3.3
Majority1285.0
Turnout 2,59332.6+0.7
Independent gain from Conservative Swing –9.9

No UKIP candidate as previous (−4.1).

Chalkwell

Chalkwell
PartyCandidateVotes%±%
Conservative Stephen John Habermel 974 38.3 –2.5
Labour Aston Line70327.6+5.3
Liberal Democrats Jill Allen-King32212.7+1.4
Independent Andy Crow30612.0–13.6
Green Nathaniel William Love2007.9New
Women's Equality Vinice Bridget Cowell381.5New
Majority27110.7–4.5
Turnout 2,54335.3+2.6
Conservative hold Swing –3.9

Eastwood Park

Eastwood Park
PartyCandidateVotes%±%
Liberal Democrats Paul Collins 1,182 46.0 +13.7
Conservative Judith McMahon58022.6–32.2
UKIP Lynne Joyce Lawer35013.6New
Independent Trevor Byford2489.7New
Labour Ruth Jones1405.4–7.5
Green Thomas Love682.6New
Majority60223.4
Turnout 2,56834.3+2.1
Liberal Democrats gain from Independent Swing +23.0

Kursaal

Kursaal
PartyCandidateVotes%±%
Labour Maggie Kelly 693 35.0 –16.9
Green Simon Cross38419.4New
Liberal Democrats Howard Gibeon34117.2–6.3
Conservative Brian Beggs28214.2–10.5
Independent Anthony Dillon27914.1New
Majority30915.6–11.6
Turnout 1,97925.0+0.6
Labour gain from Conservative Swing –14.0

Leigh

Leigh
PartyCandidateVotes%±%
Liberal Democrats Ashley Thompson 1,052 40.5 +0.9
Conservative Bernard Arscott70127.0–5.4
Labour Hilary Scarnell41315.9–5.7
Green Daniel Garrun2288.8+2.4
UKIP Romney Sheilds1556.0New
Psychedelic Future Jason Pilley512.0New
Majority35113.5+6.2
Turnout 2,60034.5–1.3
Liberal Democrats gain from Conservative Swing +3.2

Milton

Milton
PartyCandidateVotes%±%
Labour Kay Mitchell 1,101 49.1 –0.8
Conservative Jonathan Garston63428.3–3.3
Green Vida Guildford28512.7+7.0
Liberal Democrats Carol White2239.9–3.2
Majority46720.8+2.5
Turnout 2,24327.7+7.1
Labour gain from Conservative Swing +1.3

Results compared to the 21 March 2019 Milton by-election.

Green party compared to 2018 election, no For Britain candidate (−5.3) as previous.

Prittlewell

Prittlewell
PartyCandidateVotes%±%
Conservative Meg Davidson 994 41.0 +0.7
Independent Simon Wakefield53622.1+5.4
Labour Jes Phillips46319.1–11.4
Green Reece Learmouth2178.9+3.8
Liberal Democrats Bob Howes2158.9+1.5
Majority45818.9+9.0
Turnout 2,42531.3
Conservative hold Swing –2.4

Shoeburyness

Shoeburyness
PartyCandidateVotes%±%
Independent Steven Wakefield 771 33.5 –15.6
Conservative Roger Hadley73632.0+0.8
Labour Tricia Cowdrey38516.7–0.9
For Britain James Quail1918.3New
Green Jon Mullet1376.0+3.7
Liberal Democrats Granville Stride803.5+1.5
Majority351.5–16.4
Turnout 2,30026.5–2.0
Independent gain from Conservative Swing –8.2

Green candidate compared to 2016 election

Swing and majority compared to independent victory in 2018

Southchurch

Southchurch
PartyCandidateVotes%±%
Independent Ian Shead 839 34.1 +6.8
Conservative Martin Skam81032.9–14.6
Labour Colin Nickless33813.7–5.0
UKIP Grant Dennison27411.1–3.8
Green Jules Esposito1104.5+0.5
Liberal Democrats John Batch923.7+1.2
Majority291.2
Turnout 2,46332.7–0.6
Independent gain from Conservative Swing +10.7

UKIP candidate compared to 2016 election.

St. Laurence

St. Laurence
PartyCandidateVotes%±%
Labour Daniel Cowan 725 26.0 +8.4
Independent Kimberly O'Connell68624.6–6.7
Conservative Steve Buckley66223.7–10.7
UKIP John Rowlandson34712.4–7.9
Liberal Democrats Karl Lansley29610.6–6.1
Green Tanya Rayment722.6–0.4
Majority391.4
Turnout 2,78835.5+3.7
Labour gain from Conservative Swing +9.6

UKIP and Green candidate compared to 2016 election.

St. Luke's

St. Luke's
PartyCandidateVotes%±%
Independent Paul van Looy 1,257 54.6 +17.2
Labour Ian Pope50021.7–10.4
Conservative Laura Moyies31613.7–8.0
Green James Vessey-Miller1546.7+2.9
Liberal Democrats Jessie Skinner773.3+0.2
Majority35015.2+9.9
Turnout 230428.3+0.6
Independent (politician) hold Swing +13.8

No Psychedelic Future (−1.8) candidate as previous

Thorpe

Thorpe
PartyCandidateVotes%±%
Independent Ron Woodley 2,232 72.4 +13.8
Conservative Azeem Raja38012.3–17.0
Labour Janet Phillips2347.6–2.0
Green Jo Bates1545.0+2.2
Liberal Democrats James Clinkscales842.7+0.2
Majority1,85260.1+30.8
Turnout 3,08441.7
Independent hold Swing +15.4

Green party compared to 2016 election.

Victoria

Victoria ward
PartyCandidateVotes%±%
Labour Jennifer Beck 943 50.2 –10.8
Conservative James Moyies30816.4–8.2
UKIP Daryl Peagram28315.1–4.7
Green Denis Walker23812.7–1.6
Liberal Democrats Pamela Austin1085.7+2.0
Majority63533.8–2.6
Turnout 1,88022.8
Labour hold Swing –9.5

UKIP and liberal democrat candidates compared to 2016 election.

West Leigh

West Leigh
PartyCandidateVotes%±%
Liberal Democrats Beth Hooper 1,203 39.9 +5.7
Conservative Georgina Phillips1,04834.8–14.1
UKIP Lesley Martin2658.8New
Green Leonie Fleischmann1675.5+2.2
Independent Tony Ayre1665.5New
Labour Michael Ekers1635.4–9.6
Majority1555.1
Turnout 3,01242.5
Liberal Democrats gain from Conservative Swing +9.9

Green party candidate compared to 2016 election.

West Shoebury

West Shoebury
PartyCandidateVotes%±%
Conservative Tony Cox 950 41.7 –2.9
Independent Freddie Dawkins57425.2–7.2
Labour Joseph Saunders31713.9–1.1
Liberal Democrats David Barrett1647.2–0.8
For Britain James Quail1536.7New
Green Fiona Clapperton1225.4+3.4
Majority37616.5+4.3
Turnout 2,28030.8
Conservative hold Swing +2.2

Green candidate compared to 2016 election.

Westborough

Westborough
PartyCandidateVotes%±%
Labour Charles Willis 857 40.2 –12.2
Independent Dr Vel39118.3New
Conservative Jack Warren34015.9–8.8
Green Stephen Jordan25912.1+6.1
Liberal Democrats Billy Boulton1527.1–0.9
Independent Alan Hart1346.3–2.6
Majority46621.8–7.0
Turnout 2,13328.0
Labour hold Swing –15.3

Notes

    Related Research Articles

    <span class="mw-page-title-main">Sunderland City Council</span> Local authority of Sunderland, England

    Sunderland City Council is the local authority of the City of Sunderland in Tyne and Wear, England. It is a metropolitan district council, one of five in Tyne and Wear and one of 36 in the metropolitan counties of England, and provides the majority of local government services in Sunderland.

    <span class="mw-page-title-main">2010 Sunderland City Council election</span> Sunderland City Council election

    The 2010 Sunderland Council election took place on 6 May 2010 to elect members of Sunderland Metropolitan Borough Council in Tyne and Wear, England. One third of the council was up for election and the Labour Party stayed in overall control of the council. The election took place on the same day as the 2010 General Election.

    <span class="mw-page-title-main">2013 Norfolk County Council election</span>

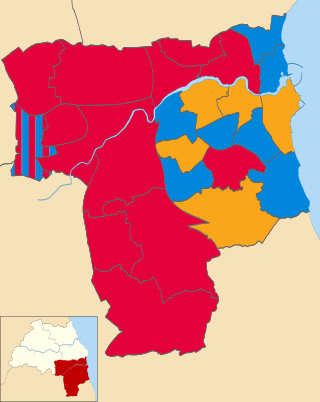
    The Norfolk County Council election took place across Norfolk on 2 May 2013, coinciding with local elections for all county councils in England. The results were announced the following day, Friday 3 May 2013. The result brought to an end 12 years of Conservative administration, who finished three seats short of a majority after losing 20 seats, leaving the Council in no overall control (NOC). UKIP and the Labour Party both made gains of 14 and 11 seats respectively. The Liberal Democrats and the Green Party both lost three seats each, whilst an independent won a single seat in North Norfolk.

    <span class="mw-page-title-main">2013 Essex County Council election</span>

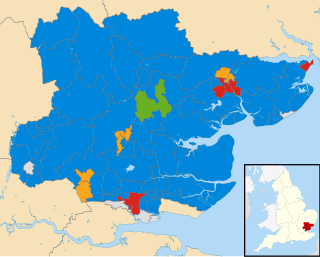
    An election to Essex County Council took place on 2 May 2013 as part of the 2013 United Kingdom local elections. 75 councillors were elected from 70 electoral divisions, which returned either one or two county councillors each by first-past-the-post voting for a four-year term of office. The electoral divisions were the same as those used at the previous election in 2009. No elections were held in Thurrock or Southend-on-Sea, which are unitary authorities outside the area covered by the County Council.

    <span class="mw-page-title-main">2014 Calderdale Metropolitan Borough Council election</span>

    The 2014 Calderdale Metropolitan Borough Council election took place on 22 May 2014 to elect members of Calderdale Metropolitan Borough Council in England. This was on the same day as local elections across the United Kingdom and a European election. One councillor was elected in each of the 17 wards for a four-year term. There are three councillors representing each ward elected on a staggered basis so one third of the councillor seats were up for re-election. The seats had previously been contested in 2010 which was held in conjunction with a general election. The turnout was significantly lower in 2014 than in 2010 which is not unusual when comparing local elections that coincide with general elections to ones that do not. Prior to the election Labour was the largest party in the council with 21 out of 51 seats, 5 seats short of an overall majority. After the election there was no overall control of the council. Labour had 25 seats, only one short of a majority and so Labour continued to operate a minority administration.

    <span class="mw-page-title-main">2014 Castle Point Borough Council election</span>

    The 2014 Castle Point Borough Council election took place on 22 May 2014 to elect members of Castle Point Borough Council in Essex, England. One third of the council was up for election and the Conservative Party lost overall control of the council to no overall control.

    <span class="mw-page-title-main">2016 Colchester Borough Council election</span> 2016 UK local government election

    Elections to Colchester Borough Council took place on 5 May 2016. Colchester Borough Council normally elects one third of its councillors each year, however, due to boundary changes, the whole council is up for election.

    <span class="mw-page-title-main">2017 Essex County Council election</span>

    Elections to Essex County Council took place on 4 May 2017 as part of the 2017 local elections. All 75 councillors were elected from 70 electoral divisions, which each returned either one or two councillors by first-past-the-post voting for a four-year term of office.

    <span class="mw-page-title-main">2017 Hampshire County Council election</span>

    The 2017 Hampshire County Council election took place on 4 May 2017 as part of the 2017 local elections in the United Kingdom. All councillors were elected from electoral divisions by first-past-the-post voting for a four-year term of office. The electoral divisions were somewhat changed from the previous election, with some being split, merged or with boundary changes. No elections were held in Portsmouth and Southampton, which are unitary authorities and hold their elections in other years. Similarly the districts within Hampshire did also not hold elections this year.

    <span class="mw-page-title-main">2018 Lambeth London Borough Council election</span>

    The 2018 Lambeth London Borough Council election took place on 3 May 2018 alongside other local elections in London, to elect members of Lambeth London Borough Council in England. The election saw Labour remain in control of Lambeth Council with a slightly reduced majority, winning over 90% of the seats. The Green Party achieved its best-ever result in the borough, winning five seats and becoming the official opposition and the largest Green group in London.

    <span class="mw-page-title-main">2018 Plymouth City Council election</span> 2018 local election in Plymouth

    The 2018 Plymouth City Council election took place on 3 May 2018 to elect members of Plymouth City Council in England. The election was won by the Labour Party, who gained enough seats to achieve an overall majority and took control of the council.

    <span class="mw-page-title-main">2018 Calderdale Metropolitan Borough Council election</span>

    The 2018 Calderdale Metropolitan Borough Council election took place on 3 May 2018 to elect members of Calderdale Metropolitan Borough Council in England. This was on the same day as other local elections. One councillor was elected in each ward for a four-year term so the councillors elected in 2018 last stood for election in 2014. Each ward is represented by three councillors, the election of which is staggered, so only one third of the councillors were elected in this election. Before the election there was no overall control with a minority Labour administration. Following the election Labour, having gained one councillor, was still two councillors away from a majority so it remained no overall control.

    <span class="mw-page-title-main">2018 Cannock Chase District Council election</span>

    Elections to Cannock Chase District Council took place on 3 May 2018 on the same day as other local elections in England. A third of the council was up for election, meaning a total of 13 councillors were elected from all but two of the council's wards.

    <span class="mw-page-title-main">2018 City of Bradford Metropolitan District Council election</span>

    The 2018 City of Bradford Metropolitan District Council took place on 3 May 2018 to elect members of Bradford District Council in England. This was on the same day as other local elections. One councillor was elected in each ward for a four-year term so the councillors elected in 2018 last stood for election in 2014. Each ward is represented by three councillors, the election of which is staggered, so only one third of the councillors were elected in this election. Before the election there was a Labour majority and afterwards Labour had increased their majority.

    <span class="mw-page-title-main">2018 Southend-on-Sea Borough Council election</span> 2018 UK local government election

    Elections to Southend-on-Sea Borough Council took place on 3 May 2018. This was on the same day as other local elections across the United Kingdom.

    <span class="mw-page-title-main">2019 Breckland District Council election</span>

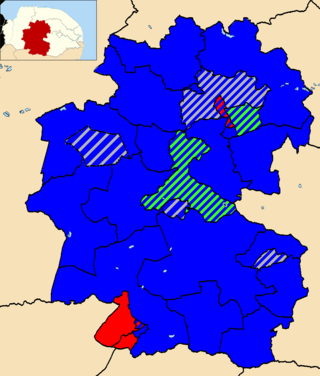
    The 2019 Breckland District Council election took place on 2 May 2019 to elect members of Breckland District Council in England. This was on the same day as other local elections. The boundaries for this election were the same as those used in 2015.

    <span class="mw-page-title-main">2019 Bournemouth, Christchurch and Poole Council election</span> 2019 local election in Bournemouth, Christchurch and Poole

    The 2019 Bournemouth, Christchurch and Poole Council election took place on 2 May 2019 to elect the inaugural members of Bournemouth, Christchurch and Poole Council in England, formed from the former unitary authorities of Bournemouth and Poole, and borough of Christchurch. At the same time an election for the new Christchurch Town Council was held.

    The 2019 North East Lincolnshire Council election took place on 2 May 2019 to elect members of North East Lincolnshire Council in England. This was on the same day as other local elections.

    2021 Sunderland City Council election

    The 2021 Sunderland City Council election took place on 6 May 2021 to elect members of Sunderland City Council in England on the same day as other elections across the United Kingdom.

    <span class="mw-page-title-main">2021 Southend-on-Sea Borough Council election</span> 2021 UK local government election

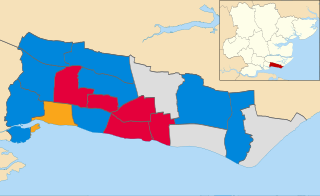
    Elections to Southend-on-Sea Borough Council took place on 6 May 2021. This was on the same day as other local elections across the United Kingdom. The results saw the Conservatives and Labour pick up seats at the expense of the local Independents.

    References

    1. "James Courtenay elected Conservative leader at Southend Council". echo-news.co.uk. Southend Echo. 8 March 2019. Retrieved 14 November 2023.
    2. "Guide to May 2019 local elections" (PDF). Your Vote Matters. Archived from the original (PDF) on 11 April 2019. Retrieved 8 April 2019.
    3. "Southend Council: Leader voted out as coalition takes over". BBC News. 4 June 2019.