This article relies largely or entirely on a single source .(March 2020) |
| ||||||||||||||||||||||||||||||||||||||||||||||||||||||||||||||||||||
All 38 seats to Rother District Council 20 seats needed for a majority | ||||||||||||||||||||||||||||||||||||||||||||||||||||||||||||||||||||
---|---|---|---|---|---|---|---|---|---|---|---|---|---|---|---|---|---|---|---|---|---|---|---|---|---|---|---|---|---|---|---|---|---|---|---|---|---|---|---|---|---|---|---|---|---|---|---|---|---|---|---|---|---|---|---|---|---|---|---|---|---|---|---|---|---|---|---|---|
| ||||||||||||||||||||||||||||||||||||||||||||||||||||||||||||||||||||
Results of the election | ||||||||||||||||||||||||||||||||||||||||||||||||||||||||||||||||||||
|
The 2019 Rother District Council election took place on 2 May 2019 to elect members of Rother District Council in East Sussex, England. [1]
2019 Rother District Council election | ||||||||||
---|---|---|---|---|---|---|---|---|---|---|
Party | Candidates | Seats | Gains | Losses | Net gain/loss | Seats % | Votes % | Votes | +/− | |
Conservative | 38 | 14 | 0 | 9 | 17 | 36.8 | 36.4 | 17,610 | –12.4 | |
Independent | 16 | 13 | 6 | 0 | 9 | 34.2 | 27.0 | 13,074 | +14.8 | |
Liberal Democrats | 16 | 7 | 1 | 0 | 5 | 18.4 | 15.3 | 7,398 | +2.1 | |
Labour | 22 | 3 | 2 | 0 | 2 | 7.9 | 12.6 | 6,093 | –2.6 | |
Green | 7 | 1 | 0 | 0 | 1 | 2.6 | 4.2 | 2,019 | +2.3 | |
UKIP | 13 | 0 | 0 | 0 | 0.0 | 4.6 | 2,215 | –4.1 |
Party | Candidate | Votes | % | ||
---|---|---|---|---|---|
Labour | Christine Bayliss | 788 | 52.2 | ||
Labour | Paul Courtel | 694 | 45.9 | ||
Conservative | Abul Azad | 555 | 36.7 | ||
Conservative | Joy Hughes | 416 | 27.5 | ||
UKIP | Roger Williams | 226 | 15.0 | ||
Majority | |||||
Turnout | |||||
Labour gain from Conservative | |||||
Labour gain from Conservative |
Party | Candidate | Votes | % | ||
---|---|---|---|---|---|
Independent | Deidre Earl-Williams | 1,287 | 66.2 | ||
Independent | Doug Oliver | 1,234 | 63.5 | ||
Conservative | Patrick Douart | 318 | 16.4 | ||
Conservative | Maurice Watson | 247 | 12.7 | ||
Green | John Gray | 232 | 11.9 | ||
UKIP | Alison Phillips | 134 | 6.9 | ||
Green | Mark Todd | 132 | 6.8 | ||
Labour | Bob Sharkey | 106 | 5.5 | ||
Majority | |||||
Turnout | |||||
Independent hold | |||||
Independent hold |
Party | Candidate | Votes | % | ||
---|---|---|---|---|---|
Independent | Lynn Langlands | 1,181 | 66.2 | ||
Independent | Brian Drayson | 1,071 | 60.1 | ||
Conservative | Brian Kentfield | 553 | 31.0 | ||
Conservative | Martin Kenward | 388 | 21.8 | ||
Labour | John Walker | 167 | 9.4 | ||
UKIP | John Dicker | 151 | 8.5 | ||
Majority | |||||
Turnout | |||||
Independent gain from Conservative | |||||
Independent gain from Conservative |
Party | Candidate | Votes | % | ||
---|---|---|---|---|---|
Green | Polly Gray | 326 | 32.4 | ||
Independent | Chris Madeley | 286 | 28.4 | ||
Independent | Bill Bullin | 254 | 25.2 | ||
Liberal Democrats | Vivienne Bond | 236 | 23.4 | ||
Conservative | Gillian Johnson | 220 | 21.8 | ||
Conservative | Jacqueline Potts | 177 | 17.6 | ||
UKIP | Michael Phillips | 157 | 15.6 | ||
Labour | Richard Sage | 141 | 14.0 | ||
Majority | |||||
Turnout | |||||
Green win (new seat) | |||||
Independent win (new seat) |
Party | Candidate | Votes | % | ||
---|---|---|---|---|---|
Independent | Charles Clark | 1,022 | 69.9 | ||
Independent | Jay Brewerton | 738 | 50.5 | ||
Conservative | Barbara Clark | 309 | 21.1 | ||
UKIP | Michael Graham | 178 | 12.2 | ||
Conservative | Betty Waterhouse | 174 | 11.9 | ||
Majority | |||||
Turnout | |||||
Independent win (new seat) | |||||
Independent win (new seat) |
Party | Candidate | Votes | % | ||
---|---|---|---|---|---|
Independent | Terry Byrne | 718 | 46.1 | ||
Independent | Hazel Timpe | 694 | 44.6 | ||
Conservative | Ian Hollidge | 484 | 31.1 | ||
Conservative | Robert Wheeler | 409 | 26.3 | ||
Labour | Alan Bearne | 290 | 18.6 | ||
UKIP | Sheila Allen-Rodgers | 238 | 15.3 | ||
Majority | |||||
Turnout | |||||
Independent gain from Conservative | |||||
Independent gain from Conservative |
Party | Candidate | Votes | % | ||
---|---|---|---|---|---|
Labour | Sam Coleman | 498 | 43.5 | ||
Conservative | Jim Carroll | 438 | 38.2 | ||
Conservative | Sharon Blagrove | 382 | 33.3 | ||
Labour | Roger McCarthy | 381 | 33.2 | ||
UKIP | John Zisper | 285 | 24.9 | ||
Majority | |||||
Turnout | |||||
Labour hold | |||||
Conservative hold |
Party | Candidate | Votes | % | ||
---|---|---|---|---|---|
Independent | Kathy Harmer | 1,213 | 72.0 | ||
Independent | Sarah Jane Errington | 1,116 | 66.2 | ||
Conservative | Michael Ensor | 318 | 18.9 | ||
Conservative | Kay Maynard | 243 | 14.4 | ||
Liberal Democrats | Wendy Dash | 128 | 7.6 | ||
UKIP | Christine Zisper | 116 | 6.9 | ||
Labour | Jacqueline Walker | 98 | 5.8 | ||
Majority | |||||
Turnout | |||||
Independent hold | |||||
Independent gain from Conservative |
Party | Candidate | Votes | % | ||
---|---|---|---|---|---|
Independent | Ashan Jeeawon | 683 | 48.5 | ||
Liberal Democrats | Richard Thomas | 380 | 27.0 | ||
Green | Dick Kempson | 376 | 26.7 | ||
Conservative | Richard Carroll | 321 | 22.8 | ||
Conservative | Mark Sivyer | 294 | 20.9 | ||
UKIP | Lynn Sharp | 220 | 15.6 | ||
Labour | Alan Watton | 179 | 12.7 | ||
Majority | |||||
Turnout | |||||
Independent gain from Conservative | |||||
Liberal Democrats gain from Conservative |
Party | Candidate | Votes | % | ||
---|---|---|---|---|---|
Conservative | Jonathan Johnson | 303 | 40.0 | ||
Independent | Ian Jenkins | 260 | 34.3 | ||
Labour | James Cakebread | 78 | 10.3 | ||
UKIP | Wayne Andrews | 59 | 7.8 | ||
Liberal Democrats | Derek Greenup | 58 | 7.7 | ||
Majority | |||||
Turnout | |||||
Conservative win (new seat) |
Party | Candidate | Votes | % | ||
---|---|---|---|---|---|
Conservative | John Barnes | 683 | 52.0 | ||
Conservative | Elanor Kirby-Green | 606 | 46.1 | ||
Liberal Democrats | Mary Varrall | 425 | 32.3 | ||
Green | Andrew Wedmore | 369 | 28.1 | ||
Liberal Democrats | Laurel Lindstrom | 360 | 27.4 | ||
Majority | |||||
Turnout | |||||
Conservative win (new seat) | |||||
Conservative win (new seat) |
Party | Candidate | Votes | % | ||
---|---|---|---|---|---|
Conservative | Gray Curtis | 280 | 38.4 | ||
Liberal Democrats | Tracy Dixon | 198 | 27.2 | ||
Green | Nicky Bishop | 172 | 23.6 | ||
UKIP | Tony Smith | 79 | 10.8 | ||
Majority | |||||
Turnout | |||||
Conservative win (new seat) |
Party | Candidate | Votes | % | ||
---|---|---|---|---|---|
Conservative | Sally-Ann Hart | 753 | 59.3 | ||
Conservative | Paul Osbourne | 722 | 56.9 | ||
Liberal Democrats | Sue Schlesinger | 368 | 29.0 | ||
Labour | Bob Ball | 304 | 23.9 | ||
Majority | |||||
Turnout | |||||
Conservative hold | |||||
Conservative hold |
Party | Candidate | Votes | % | ||
---|---|---|---|---|---|
Conservative | Mary Barnes | 704 | 54.3 | ||
Conservative | Graham Browne | 685 | 52.9 | ||
Liberal Democrats | Martin Saunders | 502 | 38.7 | ||
Green | Don Nicholls | 412 | 31.8 | ||
Majority | |||||
Turnout | |||||
Conservative win (new seat) | |||||
Conservative win (new seat) |
Party | Candidate | Votes | % | ||
---|---|---|---|---|---|
Liberal Democrats | Kathryn Field | 1,059 | 65.2 | ||
Liberal Democrats | Vikki Cook | 963 | 59.3 | ||
Conservative | Louise Salter | 389 | 24.0 | ||
Conservative | Paul Redstone | 340 | 20.9 | ||
UKIP | Bernard Mabon | 165 | 10.2 | ||
Labour | Christopher Husbands | 145 | 8.9 | ||
Majority | |||||
Turnout | |||||
Liberal Democrats win (new seat) | |||||
Liberal Democrats win (new seat) |
Party | Candidate | Votes | % | ||
---|---|---|---|---|---|
Conservative | Tony Ganly | 935 | 58.8 | ||
Conservative | Martin Mooney | 877 | 55.2 | ||
Liberal Democrats | Stephen Hardy | 506 | 31.8 | ||
Labour | Jane Emery | 278 | 17.5 | ||
Labour | Larry Hyett | 176 | 11.1 | ||
Majority | |||||
Turnout | |||||
Conservative win (new seat) | |||||
Conservative win (new seat) |
Party | Candidate | Votes | % | ||
---|---|---|---|---|---|
Liberal Democrats | Sue Prochak | 569 | 67.7 | ||
Conservative | Robert Morris | 220 | 26.2 | ||
Labour | Graham Good | 51 | 6.1 | ||
Majority | |||||
Turnout | |||||
Liberal Democrats win (new seat) |
Party | Candidate | Votes | % | ||
---|---|---|---|---|---|
Conservative | Gennette Stevens | 538 | 34.9 | ||
Liberal Democrats | Howard Norton | 453 | 29.4 | ||
Independent | Chris Hoggart | 451 | 29.2 | ||
Conservative | Jayne Stevens | 407 | 26.4 | ||
Labour | Cheryl Creaser | 397 | 25.7 | ||
Labour | Jonathan Lee | 314 | 20.3 | ||
UKIP | Ruth Green | 207 | 13.4 | ||
Majority | |||||
Turnout | |||||
Conservative win (new seat) | |||||
Liberal Democrats win (new seat) |
Party | Candidate | Votes | % | ||
---|---|---|---|---|---|
Independent | Peter Vine-Hall | 866 | 51.9 | ||
Conservative | Carl Maynard | 718 | 43.0 | ||
Conservative | Jim Philcox | 654 | 39.2 | ||
Labour | Beverly Coupar | 391 | 23.4 | ||
Majority | |||||
Turnout | |||||
Independent win (new seat) | |||||
Conservative win (new seat) |
Party | Candidate | Votes | % | ||
---|---|---|---|---|---|
Liberal Democrats | Kevin Dixon | 406 | 63.6 | ||
Conservative | Daniel Coughlan | 164 | 25.7 | ||
Labour | John Gately | 68 | 10.7 | ||
Majority | |||||
Turnout | |||||
Liberal Democrats win (new seat) |
Party | Candidate | Votes | % | ||
---|---|---|---|---|---|
Liberal Democrats | Andrew Mier | 787 | 48.1 | ||
Conservative | Roger Bird | 742 | 45.4 | ||
Conservative | Chris Saint | 664 | 40.6 | ||
Labour | Nick Warren | 314 | 19.2 | ||
Labour | Elaine Lee | 235 | 14.4 | ||
Majority | |||||
Turnout | |||||
Liberal Democrats win (new seat) | |||||
Conservative win (new seat) |
A by-election was held in Eastern Rother on 6 May 2021 after the resignation of Sally-Ann Hart following her election to Parliament in the 2019 general election. [2] The seat was won by Conservative candidate Lizzie Hacking.
Party | Candidate | Votes | % | ±% | |
---|---|---|---|---|---|
Conservative | Lizzie Hacking | 999 | 63.5 | +10.7 | |
Labour | Ash Madden | 300 | 19.1 | −2.2 | |
Liberal Democrats | Kate Lamb | 273 | 17.4 | −8.4 | |
Majority | 699 | 44.5 | |||
Turnout | 1,572 | 40.8 | |||
Conservative hold | Swing |
A by-election was held in Brede and Udimore on 16 June 2022 after the death of Jonathan Johnson. [4] The seat was won by Conservative candidate Neil Gordon.
Party | Candidate | Votes | % | ±% | |
---|---|---|---|---|---|
Conservative | Neil Gordon | 424 | 61.4 | +21.4 | |
Liberal Democrats | Martin Griffiths | 266 | 38.6 | +30.9 | |
Majority | 158 | 22.8 | |||
Turnout | 690 | ||||
Conservative hold | Swing |
Rother is a local government district in East Sussex, England. Its council is based in Bexhill-on-Sea. The district is named after the River Rother which flows within its boundaries.
Bexhill and Battle is a constituency in East Sussex represented in the House of Commons of the UK Parliament since 2024 by Kieran Mullan of the Conservative Party.
Hastings and Rye is a constituency in East Sussex represented in the House of Commons of the UK Parliament since 2024 by Helena Dollimore of the Labour and Co-operative Party.
Rother District Council is the local authority for Rother District in East Sussex, England. The council is elected every four years. Since the last boundary changes in 2019 the council has comprised 38 councillors representing 21 wards, with each ward electing one or two councillors.
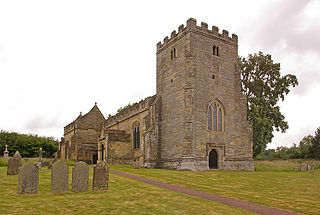
Ashburnham is a civil parish in the Rother district of East Sussex, England, situated to the west of Battle. It includes the settlements of Brownbread Street and Ponts Green; Ashburnham Forge is also within the parish. Ashburnham shares a parish council with the neighbouring small parish of Penhurst.
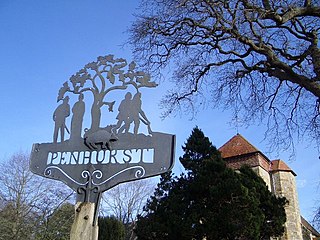
Penhurst is a village and civil parish, sharing a parish council with neighbouring Ashburnham, in the Rother district of East Sussex, England. It is located on the Weald, 4 miles (7km) west of Battle. The parish touches Ashburnham, Battle, Brightling and Catsfield. Penhurst shares a parish council with Ashburnham.
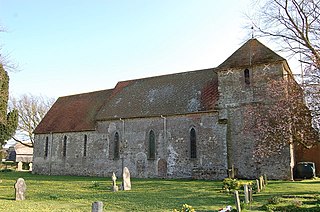
Udimore is a village and civil parish in the Rother district of East Sussex, England. It is located five miles (8 km) west of Rye on the B2089 road to Brede.
The 2011 Wealden District Council election took place on 5 May 2011 to elect members of Wealden District Council in East Sussex, England. The whole council was up for election and the Conservative Party stayed in overall control of the council.
The 1999 Rother District Council election took place on 6 May 1999 to elect members of Rother District Council in East Sussex, England. The whole council was up for election and the Conservative Party gained overall control of the council from no overall control.
The 2003 Rother District Council election took place on 1 May 2003 to elect members of Rother District Council in East Sussex, England. The whole council was up for election after boundary changes reduced the number of seats by 7. The Conservative Party stayed in overall control of the council.
The 2007 Rother District Council election took place on 3 May 2007 to elect members of Rother District Council in East Sussex, England. The whole council was up for election and the Conservative Party stayed in overall control of the council.
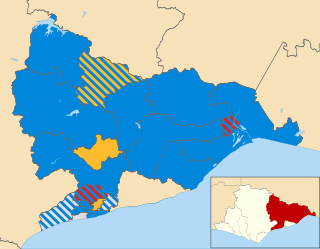
The 2011 Rother District Council election took place on 5 May 2011 to elect members of Rother District Council in East Sussex, England. The whole council was up for election and the Conservative Party stayed in overall control of the council.
The 2015 Wealden District Council election took place on 7 May 2015 to elect members of the Wealden District Council in England. It was held on the same day as other local elections.
The 2015 Rother District Council election took place on 7 May 2015 to elect members of Rother District Council in East Sussex, England. The whole council was up for election and the Conservative Party stayed in overall control of the council.
The 2019 United Kingdom local elections took place on Thursday 2 May 2019, with 248 English local councils, six directly elected mayors in England, and all 11 local councils in Northern Ireland being contested.
The 2019 Craven District Council election took place on 2 May 2019 to elect members of Craven District Council in England.
The 2022 Ealing London Borough Council election took place on 5 May 2022, under new election boundaries, which increased the number of Ealing London Borough Council councillors to 70. The elections took place alongside local elections in the other London boroughs and elections to local authorities across the United Kingdom.
The 2022 Hackney London Borough Council election took place on 5 May 2022. All 57 members of Hackney London Borough Council were up for election. The elections took place alongside the election for the mayor of Hackney, local elections in the other London boroughs, and elections to local authorities across the United Kingdom.
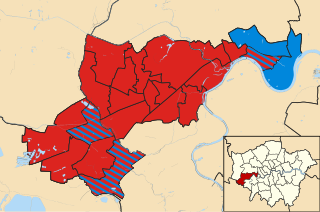
The 2022 Hounslow London Borough Council election took place on 5 May 2022. All 62 members of Hounslow London Borough Council were elected. The elections took place alongside local elections in the other London boroughs and elections to local authorities across the United Kingdom.