57.9%}}"},"leaders_seat1":{"wt":"{{nowrap|West Park}}"},"seats_before1":{"wt":"41"},"seats_needed1":{"wt":""},"seats1":{"wt":"10"},"seats_after1":{"wt":"'''37'''"},"seat_change1":{"wt":"{{nowrap|{{decrease}}4}}"},"popular_vote1":{"wt":"'''14,276'''"},"percentage1":{"wt":""},"swing1":{"wt":"{{nowrap|{{decrease}}}}\n"},"image4":{"wt":"[[File:No image wide.svg|120x160px|Blank]]"},"leader4":{"wt":"{{nowrap|Teresa Sims}}"},"party4":{"wt":"Liberal Democrats (UK)"},"leaders_seat4":{"wt":"{{nowrap|Eccleston}}"},"last_election4":{"wt":"{{nowrap|1 seat,
7.7%}}"},"seats_before4":{"wt":"3"},"seats_needed4":{"wt":""},"seats4":{"wt":"2"},"seats_after4":{"wt":"4"},"seat_change4":{"wt":"{{nowrap|{{Increase}}}}1"},"popular_vote4":{"wt":"5,623"},"percentage4":{"wt":""},"swing4":{"wt":"{{nowrap|{{increase}}}}\n"},"image2":{"wt":"[[File:No image wide.svg|120x160px|Blank]]"},"leader2":{"wt":"{{nowrap|Allan Jones}}"},"party2":{"wt":"Conservative Party (UK)"},"last_election2":{"wt":"{{nowrap|1 seats,
14.9%}}"},"leaders_seat2":{"wt":"{{nowrap|Rainford}}"},"seats_before2":{"wt":"3"},"seats_needed2":{"wt":""},"seats2":{"wt":"1"},"seats_after2":{"wt":"3"},"seat_change2":{"wt":"{{nowrap|{{nochange}}}}"},"popular_vote2":{"wt":"5,552"},"percentage2":{"wt":""},"swing2":{"wt":"{{nowrap|{{increase}}}}\n"},"image5":{"wt":"[[File:No image wide.svg|120x160px|Blank]]"},"leader5":{"wt":""},"party5":{"wt":"Independent (politician)"},"last_election5":{"wt":"{{nowrap|0 seats,
3.3%}}"},"leaders_seat5":{"wt":""},"seats_before5":{"wt":"1"},"seats_needed5":{"wt":""},"seats5":{"wt":"1"},"seats_after5":{"wt":"2"},"seat_change5":{"wt":"{{nowrap|{{increase}}1}}"},"popular_vote5":{"wt":"2,753"},"percentage5":{"wt":""},"swing5":{"wt":"{{nowrap|{{increase}}}}\n\n"}},"i":0}}]}" id="mwBg">.mw-parser-output .infobox-subbox{padding:0;border:none;margin:-3px;width:auto;min-width:100%;font-size:100%;clear:none;float:none;background-color:transparent}.mw-parser-output .infobox-3cols-child{margin:auto}.mw-parser-output .infobox .navbar{font-size:100%}body.skin-minerva .mw-parser-output .infobox-header,body.skin-minerva .mw-parser-output .infobox-subheader,body.skin-minerva .mw-parser-output .infobox-above,body.skin-minerva .mw-parser-output .infobox-title,body.skin-minerva .mw-parser-output .infobox-image,body.skin-minerva .mw-parser-output .infobox-full-data,body.skin-minerva .mw-parser-output .infobox-below{text-align:center}
| |||||||||||||||||||||||||||||||||||||||||||||||||||||||||||||||||||||||
| |||||||||||||||||||||||||||||||||||||||||||||||||||||||||||||||||||||||
16 of 48 seats (One Third) to St Helens Metropolitan Borough Council 25 seats needed for a majority | |||||||||||||||||||||||||||||||||||||||||||||||||||||||||||||||||||||||
---|---|---|---|---|---|---|---|---|---|---|---|---|---|---|---|---|---|---|---|---|---|---|---|---|---|---|---|---|---|---|---|---|---|---|---|---|---|---|---|---|---|---|---|---|---|---|---|---|---|---|---|---|---|---|---|---|---|---|---|---|---|---|---|---|---|---|---|---|---|---|---|
| |||||||||||||||||||||||||||||||||||||||||||||||||||||||||||||||||||||||
Map of results of 2019 election | |||||||||||||||||||||||||||||||||||||||||||||||||||||||||||||||||||||||
|
The 2019 St Helens Metropolitan Borough Council election took place on 2 May 2019 to elect members of St Helens Metropolitan Borough Council in England. [1] This was on the same day as other local elections. With one third of the seats on the council up for election Labour lost control of four seats although Labour retained overall control of the council. The losses were Bold and Haydock to the Green Party, Newton-Le-Willows to the Liberal Democrats and Rainhill to an Independent candidate.
Overall result compared with 2018.
St Helens Metropolitan Borough Council Election Results, 2019 | |||||||||||||||
---|---|---|---|---|---|---|---|---|---|---|---|---|---|---|---|
Party | Candidates | Votes | |||||||||||||
Stood | Elected | Gained | Unseated | Net | % of total | % | No. | Net % | |||||||
Labour | 16 | 10 | 0 | 4 | 4 | 36.4 | 14,276 | ||||||||
Green | 14 | 2 | 2 | 0 | 2 | 24.6 | 9,651 | ||||||||
Liberal Democrats | 6 | 2 | 1 | 0 | 1 | 14.3 | 5,623 | ||||||||
Conservative | 16 | 1 | 0 | 0 | 14.2 | 5,552 | |||||||||
Independent | 1 | 1 | 1 | 0 | 1 | 7.0 | 2,753 | ||||||||
UKIP | 3 | 0 | 0 | 0 | 3.5 | 1,356 |
Party | Candidate | Votes | % | ±% | |
---|---|---|---|---|---|
Labour | Joe Pearson | 1,005 | 36.64 | 13.2 | |
Green | Sue Rahman | 696 | 27.26 | 12.2 | |
UKIP | Peter Peers | 603 | 21.98 | 14.5 | |
Conservative | John Charles Barlow | 439 | 16.0 | 11.8 | |
Party | Candidate | Votes | % | ±% | |
---|---|---|---|---|---|
Labour | Linda Lovina Maloney | 940 | 46.44 | 15 | |
Green | Ellen Finney | 833 | 41.16 | 26.3 | |
Conservative | Melanie Lee | 251 | 12.40 | 3.4 | |
Party | Candidate | Votes | % | ±% | |
---|---|---|---|---|---|
Green | David O'Keefe | 833 | 34.9 | 23.8 | |
Liberal Democrats | Brian Thomas Spencer | 741 | 31.0 | 21.1 | |
Labour | Mark Antony Hattersley | 626 | 26.2 | 33.8 | |
Conservative | Barbara Woodcock | 189 | 7.9 | 11.1 | |
Party | Candidate | Votes | % | ±% | |
---|---|---|---|---|---|
Labour | Pam Howard | 993 | 48.8 | 15.8 | |
Green | Alan Smith | 748 | 36.76 | 19.6 | |
Conservative | Nancy Jane Ashcroft | 294 | 14.45 | 3.9 | |
Party | Candidate | Votes | % | ±% | |
---|---|---|---|---|---|
Liberal Democrats | Michael Haw | 2,694 | 76.47 | 7.8 | |
Labour | Alex Graham | 571 | 16.21 | 4.7 | |
Conservative | Lisa Cunliffe | 258 | 7.32 | 3.2 | |
Party | Candidate | Votes | % | ±% | |
---|---|---|---|---|---|
Green | David Ian Van Der Burg | 1,791 | 65.1 | 26.6 | |
Labour | Jeanette Susan Banks | 788 | 28.64 | 17.8 | |
Conservative | Judith Collins | 172 | 6.25 | 8.9 | |
Party | Candidate | Votes | % | ±% | |
---|---|---|---|---|---|
Labour | John Fulham | 982 | 40.51 | 17.1 | |
UKIP | Anthony James Parr | 401 | 16.54 | NEW | |
Liberal Democrats | David Kent | 335 | 13.82 | NEW | |
Green | Deborah Peck | 294 | 12.13 | 5.2 | |
Conservative | Margaret Harvey | 264 | 10.89 | 14.3 | |
Independent | Paul John Wilcock | 148 | 6.11 | NEW | |
Party | Candidate | Votes | % | ±% | |
---|---|---|---|---|---|
Liberal Democrats | David Smith | 1,173 | 41.89 | 11.6 | |
Labour | Fiona Patricia Ruddy | 890 | 31.79 | 11.4 | |
Green | Piotr Pietrzak | 516 | 18.43 | 8.0 | |
Conservative | Allan Albert Dockerty | 221 | 7.89 | 8.6 | |
Party | Candidate | Votes | % | ±% | |
---|---|---|---|---|---|
Labour | Bisi Osundeko | 919 | 58.95 | 17.2 | |
Green | Tom Armstrong | 483 | 30.98 | NEW | |
Conservative | Madeleine Wilcock | 157 | 10.07 | 0.4 | |
Party | Candidate | Votes | % | ±% | |
---|---|---|---|---|---|
Conservative | James Allan Jones | 1,501 | 59.78 | 0.9 | |
Green | Jo Travis | 573 | 22.82 | 10.7 | |
Labour | Keith Laird | 437 | 17.40 | 8.4 | |
Party | Candidate | Votes | % | ±% | |
---|---|---|---|---|---|
Independent | Donna Marie Greaves | 2,352 | 72.58 | 14.5 | |
Labour | Joe De Asha | 1098 | 23.09 | 10 | |
Conservative | Henry Spriggs | 206 | 4.33 | 4.7 | |
Party | Candidate | Votes | % | ±% | |
---|---|---|---|---|---|
Labour | Janet Elizabeth Johnson | 867 | 39.99 | 15.7 | |
Green | Ian Paul Fraser | 595 | 27.44 | NEW | |
Liberal Democrats | Frederick Barrett | 401 | 18.50 | 3.2 | |
Conservative | Wally Ashcroft | 305 | 14.07 | 1.8 | |
Party | Candidate | Votes | % | ±% | |
---|---|---|---|---|---|
Labour | Robyn Olivia Hattersley | 1,221 | 55.70 | 12.9 | |
Green | Terence Price | 628 | 28.65 | NEW | |
Conservative | Anthony Rigby | 343 | 15.65 | 6.8 | |
Party | Candidate | Votes | % | ±% | |
---|---|---|---|---|---|
Labour | Carole-Ann Gill | 916 | 52.70 | 15.8 | |
Green | William Fitzpatrick | 597 | 34.35 | 23 | |
Conservative | Iris Brown | 225 | 12.95 | 1.1 | |
Party | Candidate | Votes | % | ±% | |
---|---|---|---|---|---|
Labour | Marlene Mary Quinn | 1,189 | 54.05 | 7.8 | |
Green | Jessica Northey | 660 | 30.00 | 16.3 | |
Conservative | Richard William Barton | 351 | 15.95 | 2 | |
Party | Candidate | Votes | % | ±% | |
---|---|---|---|---|---|
Labour | David Edward Baines | 834 | 37.15 | 9.5 | |
Green | Francis Williams | 404 | 18.00 | 8.6 | |
Conservative | John Cunliffe | 376 | 16.75 | 7.8 | |
UKIP | Maria Parr | 352 | 15.68 | 11.2 | |
Liberal Democrats | Carol Pearl | 279 | 12.43 | 2.7 | |
The 1998 St Helens Metropolitan Borough Council election took place on 7 May 1998 to elect members of St Helens Metropolitan Borough Council in Merseyside, England. One third of the council was up for election and the Labour Party stayed in overall control of the council.
The 1999 St Helens Metropolitan Borough Council election took place on 6 May 1999 to elect members of St Helens Metropolitan Borough Council in Merseyside, England. One third of the council was up for election and the Labour Party stayed in overall control of the council.
The 2000 St Helens Metropolitan Borough Council election took place on 4 May 2000 to elect members of St Helens Metropolitan Borough Council in Merseyside, England. One third of the council was up for election and the Labour party stayed in overall control of the council.
The 2002 St Helens Metropolitan Borough Council election took place on 2 May 2002 to elect members of St Helens Metropolitan Borough Council in Merseyside, England. One third of the council was up for election and the Labour Party stayed in overall control of the council.
The 2003 St Helens Metropolitan Borough Council election took place on 1 May 2003 to elect members of St Helens Metropolitan Borough Council in Merseyside, England. One third of the council was up for election and the Labour Party stayed in overall control of the council.
The 2004 St Helens Metropolitan Borough Council election took place on 10 June 2004 to elect members of St Helens Metropolitan Borough Council in Merseyside, England. The whole council was up for election with boundary changes since the last election in 2003 reducing the number of seats by six. The Labour Party lost overall control of the council to no overall control.
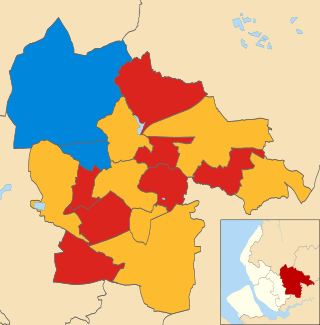
The 2006 St Helens Metropolitan Borough Council election took place on 4 May 2006 to elect members of St Helens Metropolitan Borough Council in Merseyside, England. One third of the council was up for election and the council stayed under no overall control.
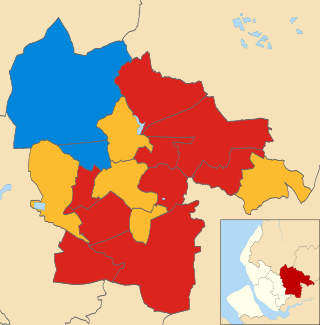
The 2008 St Helens Metropolitan Borough Council election took place on 1 May 2008 to elect members of St Helens Metropolitan Borough Council in Merseyside, England. One third of the council was up for election and the council stayed under no overall control.
The 2007 St Helens Metropolitan Borough Council election took place on 3 May 2007 to elect members of St Helens Metropolitan Borough Council in Merseyside, England. One third of the council was up for election and the council stayed under no overall control.
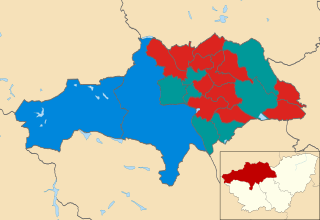
The 2007 Barnsley Metropolitan Borough Council election took place on 3 May 2007 to elect members of Barnsley Metropolitan Borough Council in South Yorkshire, England. One third of the council was up for election and the Labour party stayed in overall control of the council.
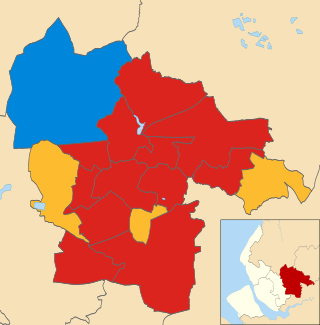
The 2010 St Helens Metropolitan Borough Council election took place on 6 May 2010 to elect members of St Helens Metropolitan Borough Council in Merseyside, England. One third of the council was up for election and the Labour Party gained overall control of the council from no overall control.
The 2011 St Helens Metropolitan Borough Council election took place on 5 May 2011 to elect members of St Helens Metropolitan Borough Council in Merseyside, England. One third of the council was up for election and the Labour Party stayed in overall control of the council.
The 2014 St Helens Metropolitan Borough Council election took place on 22 May 2014 to elect members of St Helens Metropolitan Borough Council in Merseyside, England. One third of the council was up for election and the Labour Party stayed in overall control of the council.
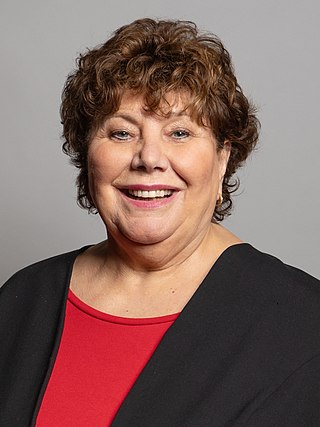
Marie Elizabeth Rimmer, is a British Labour Party politician. She has previously been a local councillor for St Helens Metropolitan Borough Council in Merseyside, England, and has served as Labour leader of the council three times between 1978 and 2014. She has recently been the Member of Parliament (MP) for St Helens South and Whiston since 2015.
The 2018 United Kingdom local elections were held on Thursday 3 May 2018, with local council elections taking place in all 32 London boroughs, 34 metropolitan boroughs, 67 district and borough councils and 17 unitary authorities. There were also direct elections for the mayoralties of Hackney, Lewisham, Newham, Tower Hamlets and Watford.
The 2018 St Helens Metropolitan Borough Council election took place on 3 May 2018 to elect members of St Helens Metropolitan Borough Council in England. This was on the same day as other local elections. It saw the Green Party get the biggest vote growth, However the only seat change was in Rainhill where an Independent beat Labour. Elsewhere UKIP's Vote share collapsed.
The 2019 Wirral Metropolitan Borough Council election took place on 2 May 2019 to elect members of Wirral Metropolitan Borough Council in England. This election was held on the same day as other local elections.
The 2022 St Helens Metropolitan Borough Council election took place on 5 May 2022. Due to boundary changes, all 48 councillors were elected at the same time, with the council moving to a system of all-out elections every four years. The election took place alongside other local elections across the United Kingdom.
The 2022 Dudley Metropolitan Borough Council election took place on 5 May 2022. One third of councillors—24 out of 72—on Dudley Metropolitan Borough Council were elected, with 1 ward electing 2 councillors. The election took place alongside other local elections across the United Kingdom.
The 2022 Kirklees Metropolitan Borough Council election took place on 5 May 2022. One third of councillors—23 out of 69—on Kirklees Metropolitan Borough Council were elected. The election took place alongside other local elections across the United Kingdom.