| |||||||||||||||||||||||||||||||||||||||||||||||||||||
| |||||||||||||||||||||||||||||||||||||||||||||||||||||
23 of 66 seats (One Third and one by-election) to Wirral Metropolitan Borough Council 34 seats needed for a majority | |||||||||||||||||||||||||||||||||||||||||||||||||||||
---|---|---|---|---|---|---|---|---|---|---|---|---|---|---|---|---|---|---|---|---|---|---|---|---|---|---|---|---|---|---|---|---|---|---|---|---|---|---|---|---|---|---|---|---|---|---|---|---|---|---|---|---|---|
Turnout | 35.6% (2.2%) [1] | ||||||||||||||||||||||||||||||||||||||||||||||||||||
| |||||||||||||||||||||||||||||||||||||||||||||||||||||
Map of results of 1978 election | |||||||||||||||||||||||||||||||||||||||||||||||||||||
|
The 1978 Wirral Metropolitan Borough Council election took place on 4 May 1978 to elect members of Wirral Metropolitan Borough Council in England. [2] This election was held on the same day as other local elections.
After the election, the composition of the council was:
Party | Seats | ± | |
---|---|---|---|
Conservative | 45 | 3 | |
Labour | 16 | 2 | |
Liberal | 5 | 1 | |
Overall result compared with 1976.
Wirral Metropolitan Borough Council election results, 1978 | |||||||||||||||
---|---|---|---|---|---|---|---|---|---|---|---|---|---|---|---|
Party | Candidates | Votes | |||||||||||||
Stood | Elected | Gained | Unseated | Net | % of total | % | No. | Net % | |||||||
Conservative | 23 | 14 | 3 | 0 | 3 | 59.1 | 55.7 | 51,523 | 1.4 | ||||||
Labour | 23 | 6 | 0 | 2 | 2 | 27.3 | 28.4 | 26,246 | 1.5 | ||||||
Liberal | 17 | 3 | 1 | 2 | 1 | 13.6 | 15.4 | 14,231 | 3.0 | ||||||
National Front | 2 | 0 | 0 | 0 | 0.0 | 0.2 | 209 | N/A | |||||||
Independent | 1 | 0 | 0 | 0 | 0.0 | 0.2 | 191 | 0.2 | |||||||
Communist | 1 | 0 | 0 | 0 | 0.0 | 0.1 | 59 | 0.1 |
Party | Candidate | Votes | % | ±% | |
---|---|---|---|---|---|
Labour | Richard Kimberly | 1,240 | 52.7 | 5.8 | |
Liberal | Anna Blumenthal | 527 | 22.4 | 16.9 | |
Conservative | B. Jones | 506 | 21.5 | 7.7 | |
National Front | Howard Hawksley | 78 | 3.3 | New | |
Majority | 713 | 30.3 | 22.7 | ||
Registered electors | 7,259 | ||||
Turnout | 32.4 | 1.6 | |||
Labour hold | Swing | 11.4 | |||
Party | Candidate | Votes | % | ±% | |
---|---|---|---|---|---|
Labour | S. Kellett | 1,200 | 48.8 | 7.7 | |
Conservative | M. Riley | 1,116 | 45.4 | 5.5 | |
Liberal | M. McDonnell | 144 | 5.9 | 2.1 | |
Majority | 84 | 3.4 | N/A | ||
Registered electors | 7,556 | ||||
Turnout | 32.6 | 2.0 | |||
Labour hold | Swing | 6.6 | |||
Party | Candidate | Votes | % | ±% | |
---|---|---|---|---|---|
Liberal | Roy Perkins | 1,366 | 38.8 | 4.1 | |
Conservative | D. Stoppard | 1,318 | 37.4 | 5.1 | |
Labour | Walter Smith | 841 | 23.9 | 2.6 | |
Majority | 48 | 1.4 | 9.2 | ||
Registered electors | 8,641 | ||||
Turnout | 40.8 | 0.2 | |||
Liberal hold | Swing | 4.6 | |||
Party | Candidate | Votes | % | ±% | |
---|---|---|---|---|---|
Conservative | Myrra Lea [n 2] | 1,789 | 43.3 | 2.2 | |
Conservative | E. Williams [n 3] | 1,724 | – | – | |
Labour | J. Macdougall | 1,361 | 32.9 | 1.3 | |
Labour | R. Leeper | 1,299 | – | – | |
Liberal | G. Quinn | 982 | 23.8 | 0.9 | |
Liberal | A. Halliday | 944 | – | – | |
Majority | 428 | 10.4 | 3.5 | ||
Registered electors | 11,925 | ||||
Turnout | 34.6 | 0.3 | |||
Conservative gain from Liberal | Swing | 1.8 | |||
Conservative hold | Swing | – | |||
Party | Candidate | Votes | % | ±% | |
---|---|---|---|---|---|
Labour | J. Flynn | 1,927 | 72.2 | 13.5 | |
Conservative | T. Bird | 493 | 18.5 | 2.4 | |
Liberal | D. Murgatroyd | 250 | 9.4 | 11.1 | |
Majority | 1,434 | 53.7 | 15.9 | ||
Registered electors | 8,376 | ||||
Turnout | 31.9 | 0.6 | |||
Labour hold | Swing | 8.0 | |||
Party | Candidate | Votes | % | ±% | |
---|---|---|---|---|---|
Liberal | Gordon Lindsay | 2,564 | 47.7 | 14.7 | |
Conservative | R. Hardy | 1,980 | 36.8 | 11.8 | |
Labour | Andrew Davies | 833 | 15.5 | 2.9 | |
Majority | 584 | 10.9 | N/A | ||
Registered electors | 13,242 | ||||
Turnout | 40.6 | 0.7 | |||
Liberal hold | Swing | 13.3 | |||
Party | Candidate | Votes | % | ±% | |
---|---|---|---|---|---|
Conservative | M. Baker | 2,993 | 65.2 | 0.6 | |
Labour | F. Naylor | 1,597 | 34.8 | 7.8 | |
Majority | 1,396 | 30.4 | 7.2 | ||
Registered electors | 15,422 | ||||
Turnout | 29.7 | 3.3 | |||
Conservative hold | Swing | 3.6 | |||
Party | Candidate | Votes | % | ±% | |
---|---|---|---|---|---|
Conservative | S. Hibbert | 3,256 | 59.9 | 3.0 | |
Labour | J. Seaman | 2,180 | 40.1 | 0.5 | |
Majority | 1,076 | 19.8 | 3.5 | ||
Registered electors | 21,661 | ||||
Turnout | 25.1 | 2.4 | |||
Conservative hold | Swing | 1.8 | |||
Party | Candidate | Votes | % | ±% | |
---|---|---|---|---|---|
Labour | John Clark | 2,004 | 55.4 | 5.2 | |
Conservative | A. Smith | 1,481 | 40.9 | 0.8 | |
Liberal | M. Canning | 133 | 3.7 | 5.1 | |
Majority | 523 | 14.5 | 4.4 | ||
Registered electors | 11,982 | ||||
Turnout | 30.2 | 6.1 | |||
Labour hold | Swing | 2.2 | |||
Party | Candidate | Votes | % | ±% | |
---|---|---|---|---|---|
Conservative | S. Morgan | 2,404 | 59.6 | 4.7 | |
Labour | G. Watkins | 1,379 | 34.2 | 4.8 | |
Liberal | S. Pollit | 253 | 6.3 | 9.4 | |
Majority | 1,025 | 25.4 | 0.1 | ||
Registered electors | 12,770 | ||||
Turnout | 31.6 | 2.9 | |||
Conservative hold | Swing | 0.1 | |||
Party | Candidate | Votes | % | ±% | |
---|---|---|---|---|---|
Conservative | L. Young | 1,596 | 53.3 | 0.5 | |
Labour | Jim Edwards | 1,273 | 42.5 | 5.6 | |
Liberal | J. Jenkins | 124 | 4.1 | 2.0 | |
Majority | 323 | 10.8 | 6.1 | ||
Registered electors | 8,168 | ||||
Turnout | 36.6 | 5.7 | |||
Conservative gain from Labour | Swing | 3.1 | |||
Party | Candidate | Votes | % | ±% | |
---|---|---|---|---|---|
Conservative | D. Moir | 4,176 | 63.7 | 10.6 | |
Liberal | N. Thomas | 1,856 | 28.3 | 9.6 | |
Labour | W. Edwards | 525 | 8.0 | 1.0 | |
Majority | 2,320 | 35.4 | 20.2 | ||
Registered electors | 14,454 | ||||
Turnout | 45.4 | 0.6 | |||
Conservative gain from Liberal | Swing | 10.1 | |||
Party | Candidate | Votes | % | ±% | |
---|---|---|---|---|---|
Conservative | Jack Redhead | 2,651 | 75.5 | 16.8 | |
Labour | B. Lloyd | 591 | 16.8 | 0.6 | |
Liberal | J. Barton | 270 | 7.7 | 17.3 | |
Majority | 2,060 | 58.7 | 25.0 | ||
Registered electors | 11,546 | ||||
Turnout | 30.4 | 3.2 | |||
Conservative hold | Swing | 12.5 | |||
Party | Candidate | Votes | % | ±% | |
---|---|---|---|---|---|
Labour | Phoebe Bentzien | 2,187 | 58.0 | 0.4 | |
Conservative | M. Kemble | 1,248 | 33.1 | 3.1 | |
Liberal | P. Mawdsley | 143 | 3.8 | 1.7 | |
National Front | John Fishwick | 131 | 3.5 | New | |
Communist | R. Harris | 59 | 1.6 | New | |
Majority | 939 | 24.9 | 2.7 | ||
Registered electors | 11,223 | ||||
Turnout | 33.6 | 0.2 | |||
Labour hold | Swing | 1.4 | |||
Party | Candidate | Votes | % | ±% | |
---|---|---|---|---|---|
Conservative | Frank Theaker | 3,285 | 71.2 | 4.7 | |
Labour | Audrey Moore | 921 | 20.0 | 4.1 | |
Liberal | Penelope Globy | 410 | 8.9 | New | |
Majority | 2,364 | 51.2 | 0.6 | ||
Registered electors | 10,181 | ||||
Turnout | 45.3 | 4.2 | |||
Conservative hold | Swing | 0.3 | |||
Party | Candidate | Votes | % | ±% | |
---|---|---|---|---|---|
Labour | S. Price | 2,082 | 52.2 | 4.8 | |
Conservative | T. Stacey | 1,905 | 47.8 | 4.0 | |
Majority | 177 | 4.4 | 0.8 | ||
Registered electors | 9,828 | ||||
Turnout | 40.6 | 2.3 | |||
Labour hold | Swing | 0.4 | |||
Party | Candidate | Votes | % | ±% | |
---|---|---|---|---|---|
Liberal | Phillip Gilchrist | 3,729 | 58.1 | 20.1 | |
Conservative | B. Davies | 1,749 | 27.3 | 8.7 | |
Labour | R. Dunning | 940 | 14.6 | 11.4 | |
Majority | 1,980 | 30.8 | N/A | ||
Registered electors | 13,985 | ||||
Turnout | 45.9 | 2.0 | |||
Liberal gain from Labour | Swing | 14.4 | |||
Party | Candidate | Votes | % | ±% | |
---|---|---|---|---|---|
Conservative | J. Zowe | 3,630 | 65.3 | 5.8 | |
Labour | R. Woods | 1,015 | 18.2 | 0.5 | |
Liberal | Thomas Harney | 918 | 16.5 | 6.3 | |
Majority | 2,615 | 47.1 | 5.3 | ||
Registered electors | 14,163 | ||||
Turnout | 39.3 | 6.5 | |||
Conservative hold | Swing | 2.7 | |||
Party | Candidate | Votes | % | ±% | |
---|---|---|---|---|---|
Conservative | W. Lloyd | 3,523 | 74.5 | 2.2 | |
Liberal | B. Crosby | 562 | 11.9 | 5.0 | |
Labour | John McCabe | 454 | 9.6 | 1.2 | |
Independent | J. Ellison | 191 | 4.0 | New | |
Majority | 2,961 | 62.6 | 7.2 | ||
Registered electors | 13,589 | ||||
Turnout | 34.8 | 3.4 | |||
Conservative hold | Swing | 3.6 | |||
Party | Candidate | Votes | % | ±% | |
---|---|---|---|---|---|
Conservative | William Whitehurst | 4,051 | 86.0 | 16.2 | |
Labour | David Jackson | 660 | 14.0 | 7.2 | |
Majority | 3,391 | 72.0 | 25.6 | ||
Registered electors | 12,150 | ||||
Turnout | 38.8 | 5.5 | |||
Conservative hold | Swing | 12.8 | |||
Party | Candidate | Votes | % | ±% | |
---|---|---|---|---|---|
Conservative | P. Wilson | 3,859 | 91.1 | 5.8 | |
Labour | P. Wallace | 375 | 8.9 | 4.5 | |
Majority | 3,484 | 82.2 | 7.2 | ||
Registered electors | 11,581 | ||||
Turnout | 36.6 | 6.8 | |||
Conservative hold | Swing | 3.6 | |||
Party | Candidate | Votes | % | ±% | |
---|---|---|---|---|---|
Conservative | David Fletcher | 2,514 | 79.2 | 14.1 | |
Labour | H. Ellis-Thomas | 661 | 20.8 | 2.9 | |
Majority | 1,853 | 58.4 | 11.2 | ||
Registered electors | 10,048 | ||||
Turnout | 31.6 | 6.7 | |||
Conservative hold | Swing | 5.6 | |||
• italics denote the sitting councillor • bold denotes the winning candidate
The 1998 Wirral Metropolitan Borough Council election took place on 7 May 1998 to elect members of Wirral Metropolitan Borough Council in England. This election was held on the same day as other local elections.
The 2016 Wirral Metropolitan Borough Council election took place on 5 May 2016 to elect members of Wirral Metropolitan Borough Council in England. This election was held on the same day as other local elections.
Birkenhead and Tranmere is a Wirral Metropolitan Borough Council ward in the Birkenhead Parliamentary constituency.
The 1973 Wirral Metropolitan Borough Council election took place on 10 May 1973 to elect members of Wirral Metropolitan Borough Council in England. This was on the same day as other local elections.
The 1975 Wirral Metropolitan Borough Council election took place on 1 May 1975 to elect members of Wirral Metropolitan Borough Council in England. This election was held on the same day as other local elections.
The 1976 Wirral Metropolitan Borough Council election took place on 6 May 1976 to elect Wirral Metropolitan Borough Council members in England. This election was held on the same day as other local elections.
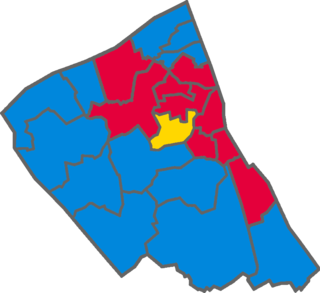
The 1979 Wirral Metropolitan Borough Council election took place on 3 May 1979 to elect members of Wirral Metropolitan Borough Council in England. This election was held on the same day as other local elections.
The 1980 Wirral Metropolitan Borough Council election took place on 1 May 1980 to elect members of Wirral Metropolitan Borough Council in England. This election was held on the same day as other local elections.
The 1982 Wirral Metropolitan Borough Council election took place on 6 May 1982 to elect members of Wirral Metropolitan Borough Council in England. This election was held on the same day as other local elections.
The 1983 Wirral Metropolitan Borough Council election took place on 5 May 1983 to elect members of Wirral Metropolitan Borough Council in England. This election was held on the same day as other local elections.
The 1984 Wirral Metropolitan Borough Council election took place on 3 May 1984 to elect members of Wirral Metropolitan Borough Council in England. This election was held on the same day as other local elections.
The 1986 Wirral Metropolitan Borough Council election took place on 8 May 1986 to elect members of Wirral Metropolitan Borough Council in England. This election was held on the same day as other local elections.
The 1987 Wirral Metropolitan Borough Council election took place on 7 May 1987 to elect members of Wirral Metropolitan Borough Council in England. This election was held on the same day as other local elections.
The 1988 Wirral Metropolitan Borough Council election took place on 5 May 1988 to elect members of Wirral Metropolitan Borough Council in England. This election was held on the same day as other local elections.
The 1990 Wirral Metropolitan Borough Council election took place on 3 May 1990 to elect members of Wirral Metropolitan Borough Council in England. This election was held on the same day as other local elections.
The 1991 Wirral Metropolitan Borough Council election took place on 2 May 1991 to elect members of Wirral Metropolitan Borough Council in England. This election was held on the same day as other local elections.
The 1992 Wirral Metropolitan Borough Council election took place on 7 May 1992 to elect members of Wirral Metropolitan Borough Council in England. This election was held on the same day as other local elections.
The 1994 Wirral Metropolitan Borough Council election took place on 5 May 1994 to elect members of Wirral Metropolitan Borough Council in England. This election was held on the same day as other local elections.
The 1995 Wirral Metropolitan Borough Council election took place on 4 May 1995 to elect members of Wirral Metropolitan Borough Council in England. This election was held on the same day as other local elections.
The 1996 Wirral Metropolitan Borough Council election took place on 2 May 1996 to elect members of Wirral Metropolitan Borough Council in England. This election was held on the same day as other local elections.
Mellows-Facer, Adam (10 May 2006). "Local election 2006". parliament.uk . Retrieved 29 December 2018.
"BBC NEWS VOTE 2003 WIRRAL". BBC News . 1 May 2003. Retrieved 29 December 2018.