| |||||||||||||||||||||||||||||||||||||||||||||||||
| |||||||||||||||||||||||||||||||||||||||||||||||||
22 of 66 seats (One Third) to Wirral Metropolitan Borough Council 34 seats needed for a majority | |||||||||||||||||||||||||||||||||||||||||||||||||
---|---|---|---|---|---|---|---|---|---|---|---|---|---|---|---|---|---|---|---|---|---|---|---|---|---|---|---|---|---|---|---|---|---|---|---|---|---|---|---|---|---|---|---|---|---|---|---|---|---|
Turnout | 35.0% (3.2%) [1] | ||||||||||||||||||||||||||||||||||||||||||||||||
| |||||||||||||||||||||||||||||||||||||||||||||||||
Map of results of 1996 election | |||||||||||||||||||||||||||||||||||||||||||||||||
|
The 1996 Wirral Metropolitan Borough Council election took place on 2 May 1996 to elect members of Wirral Metropolitan Borough Council in England. [2] This election was held on the same day as other local elections.
After the election, the composition of the council was:
Party | Seats | ± | |
---|---|---|---|
Labour | 41 | 5 | |
Conservative | 16 | 6 | |
Liberal Democrats | 9 | 1 | |
Overall result compared with 1995.
Wirral Metropolitan Borough Council election results, 1996 | |||||||||||||||
---|---|---|---|---|---|---|---|---|---|---|---|---|---|---|---|
Party | Candidates | Votes | |||||||||||||
Stood | Elected | Gained | Unseated | Net | % of total | % | No. | Net % | |||||||
Labour | 22 | 13 | 5 | 0 | 5 | 59.1 | 48.9 | 41,521 | 4.6 | ||||||
Conservative | 20 | 6 | 0 | 6 | 6 | 27.3 | 30.2 | 25,611 | 4.4 | ||||||
Liberal Democrats | 22 | 3 | 1 | 0 | 1 | 13.6 | 20.1 | 17,066 | |||||||
Green | 6 | 0 | 0 | 0 | 0.0 | 0.7 | 555 | 0.1 | |||||||
Independent | 1 | 0 | 0 | 0 | 0.0 | 0.2 | 161 | N/A |
Party | Candidate | Votes | % | ±% | |
---|---|---|---|---|---|
Labour | Keith Williams | 2,171 | 47.7 | 4.9 | |
Conservative | Brian Cummings | 1,940 | 42.6 | 2.5 | |
Liberal Democrats | Kevin Turner | 363 | 8.0 | 0.7 | |
Green | Ann Jones | 77 | 1.7 | New | |
Majority | 231 | 5.1 | 7.4 | ||
Registered electors | 10,555 | ||||
Turnout | 43.1 | 4.5 | |||
Labour gain from Conservative | Swing | 3.7 | |||
Party | Candidate | Votes | % | ±% | |
---|---|---|---|---|---|
Labour | J. Williams | 1,713 | 88.4 | 2.2 | |
Liberal Democrats | John Tomlinson | 224 | 11.6 | 6.8 | |
Majority | 1,489 | 76.9 | 8.9 | ||
Registered electors | 8,211 | ||||
Turnout | 23.6 | 7.8 | |||
Labour hold | Swing | 4.5 | |||
Party | Candidate | Votes | % | ±% | |
---|---|---|---|---|---|
Labour | D. Gower | 2,228 | 88.0 | 0.3 | |
Liberal Democrats | Michael Redfern | 303 | 12.0 | 5.9 | |
Majority | 1,925 | 76.1 | 6.1 | ||
Registered electors | 10,211 | ||||
Turnout | 24.8 | 5.9 | |||
Labour hold | Swing | 3.1 | |||
Party | Candidate | Votes | % | ±% | |
---|---|---|---|---|---|
Labour | David Jackson | 2,401 | 65.1 | 8.1 | |
Conservative | K. Roberts | 658 | 17.9 | 1.7 | |
Liberal Democrats | M. Bolton | 384 | 10.4 | 0.2 | |
Independent | J. Rohan | 161 | 4.4 | New | |
Green | J. Jones | 82 | 2.2 | New | |
Majority | 1,743 | 47.3 | 9.7 | ||
Registered electors | 10,752 | ||||
Turnout | 34.3 | 2.0 | |||
Labour hold | Swing | 4.9 | |||
Party | Candidate | Votes | % | ±% | |
---|---|---|---|---|---|
Conservative | Michael Moore | 2,478 | 45.1 | 7.2 | |
Labour | L. Flanagan | 2,066 | 37.6 | 5.2 | |
Liberal Democrats | W. Walsh | 947 | 17.2 | 2.1 | |
Majority | 412 | 7.5 | N/A | ||
Registered electors | 13,713 | ||||
Turnout | 40.0 | 1.5 | |||
Conservative hold | Swing | 6.2 | |||
Party | Candidate | Votes | % | ±% | |
---|---|---|---|---|---|
Labour | George Davies | 2,007 | 51.7 | 1.9 | |
Liberal Democrats | Stuart Kelly | 1,237 | 31.8 | 5.3 | |
Conservative | P. Greening-Jackson | 560 | 14.4 | 2.9 | |
Green | George Bowler | 80 | 2.1 | 0.5 | |
Majority | 770 | 19.8 | 7.1 | ||
Registered electors | 10,359 | ||||
Turnout | 37.5 | 4.3 | |||
Labour hold | Swing | 3.6 | |||
Party | Candidate | Votes | % | ±% | |
---|---|---|---|---|---|
Liberal Democrats | Phillip Gilchrist | 2,805 | 65.1 | 6.3 | |
Labour | A. McGuiness | 1,059 | 24.6 | 5.2 | |
Conservative | S. Hutchence | 444 | 10.3 | 1.1 | |
Majority | 1,746 | 40.5 | 11.4 | ||
Registered electors | 11,170 | ||||
Turnout | 38.6 | 3.1 | |||
Liberal Democrats hold | Swing | 5.8 | |||
Party | Candidate | Votes | % | ±% | |
---|---|---|---|---|---|
Labour | Andrew Dow | 2,290 | 75.3 | 1.5 | |
Conservative | H. Jackson-Payne | 407 | 13.4 | 1.1 | |
Liberal Democrats | Philip Lloyd | 238 | 7.8 | 0.9 | |
Green | Joyce Hogg | 107 | 3.5 | 1.3 | |
Majority | 1,883 | 61.9 | 2.6 | ||
Registered electors | 10,554 | ||||
Turnout | 28.8 | 5.9 | |||
Labour hold | Swing | 1.3 | |||
Party | Candidate | Votes | % | ±% | |
---|---|---|---|---|---|
Conservative | T. Price | 2,820 | 60.3 | 4.3 | |
Liberal Democrats | Edward Norton | 1,040 | 22.2 | 2.5 | |
Labour | C. Murphy | 820 | 17.5 | 6.8 | |
Majority | 1,780 | 38.0 | 6.2 | ||
Registered electors | 13,119 | ||||
Turnout | 35.7 | 2.9 | |||
Conservative hold | Swing | 3.2 | |||
Party | Candidate | Votes | % | ±% | |
---|---|---|---|---|---|
Conservative | Hilary Jones | 2,433 | 55.5 | 2.1 | |
Labour | Alan Milne | 1,218 | 27.8 | 3.5 | |
Liberal Democrats | A. Richards | 733 | 16.7 | 1.4 | |
Majority | 1,215 | 27.7 | 5.6 | ||
Registered electors | 12,232 | ||||
Turnout | 35.8 | 2.2 | |||
Conservative hold | Swing | 2.8 | |||
Party | Candidate | Votes | % | ±% | |
---|---|---|---|---|---|
Labour | Ronald Abbey | 2,169 | 77.1 | 4.8 | |
Conservative | Ian Lewis | 418 | 14.8 | 4.7 | |
Liberal Democrats | C. Robertson | 228 | 8.1 | 0.1 | |
Majority | 1,751 | 62.2 | 9.6 | ||
Registered electors | 9,345 | ||||
Turnout | 30.1 | 3.6 | |||
Labour hold | Swing | 4.8 | |||
Party | Candidate | Votes | % | ±% | |
---|---|---|---|---|---|
Labour | Denis Knowles | 2,421 | 64.6 | 7.3 | |
Conservative | M. Ebbs | 883 | 23.6 | New | |
Liberal Democrats | M. Todd | 444 | 11.8 | 16.3 | |
Majority | 1,538 | 41.0 | 2.7 | ||
Registered electors | 11,087 | ||||
Turnout | 33.8 | 2.9 | |||
Labour gain from Conservative | Swing | 1.4 | |||
Party | Candidate | Votes | % | ±% | |
---|---|---|---|---|---|
Labour | Ann McLachlan | 2,148 | 60.5 | 2.1 | |
Conservative | Vic Borg | 1,177 | 33.1 | 1.6 | |
Liberal Democrats | Susanne Uriel | 228 | 6.4 | 0.5 | |
Majority | 971 | 27.3 | 3.6 | ||
Registered electors | 9,583 | ||||
Turnout | 37.1 | 7.8 | |||
Labour gain from Conservative | Swing | 1.9 | |||
Party | Candidate | Votes | % | ±% | |
---|---|---|---|---|---|
Labour | Vincent McGee | 2,132 | 59.3 | 3.1 | |
Conservative | H. Tooke | 1,038 | 28.9 | 4.0 | |
Liberal Democrats | John Codling | 424 | 11.8 | 0.9 | |
Majority | 1,094 | 30.4 | 7.1 | ||
Registered electors | 11,289 | ||||
Turnout | 31.8 | 4.4 | |||
Labour gain from Conservative | Swing | 3.6 | |||
Party | Candidate | Votes | % | ±% | |
---|---|---|---|---|---|
Liberal Democrats | Alec Dunn | 2,221 | 56.3 | 3.0 | |
Labour | Pauline Cocker | 1,123 | 28.5 | 2.3 | |
Conservative | Cyrus Ferguson | 524 | 13.3 | 0.8 | |
Green | Garnette Bowler | 75 | 1.9 | 0.2 | |
Majority | 1,098 | 27.8 | 5.3 | ||
Registered electors | 11,261 | ||||
Turnout | 35.0 | 4.9 | |||
Liberal Democrats hold | Swing | 2.7 | |||
Party | Candidate | Votes | % | ±% | |
---|---|---|---|---|---|
Liberal Democrats | Margaret Bridson | 2,300 | 47.8 | 1.6 | |
Labour | Ray Pullen | 1,595 | 33.2 | 2.6 | |
Conservative | J. Thomas | 912 | 19.0 | 1.0 | |
Majority | 705 | 14.7 | 4.3 | ||
Registered electors | 11,399 | ||||
Turnout | 42.2 | 1.3 | |||
Liberal Democrats gain from Conservative | Swing | 2.1 | |||
Party | Candidate | Votes | % | ±% | |
---|---|---|---|---|---|
Conservative | Derek Robinson | 2,280 | 50.1 | 4.7 | |
Labour | R. Pennington | 1,307 | 28.7 | 3.6 | |
Liberal Democrats | Peter Reisdorf | 966 | 21.2 | 1.2 | |
Majority | 973 | 21.4 | 8.2 | ||
Registered electors | 10,963 | ||||
Turnout | 41.5 | 3.9 | |||
Conservative hold | Swing | 4.2 | |||
Party | Candidate | Votes | % | ±% | |
---|---|---|---|---|---|
Labour | P. Clee | 2,564 | 82.7 | 0.8 | |
Liberal Democrats | Moira Gallagher | 297 | 9.6 | 3.9 | |
Conservative | Patricia Jones | 240 | 7.7 | 0.5 | |
Majority | 2,267 | 73.1 | 2.2 | ||
Registered electors | 10,963 | ||||
Turnout | 28.3 | 5.6 | |||
Labour hold | Swing | 1.1 | |||
Party | Candidate | Votes | % | ±% | |
---|---|---|---|---|---|
Conservative | Sid Dunn | 2,454 | 51.1 | 4.9 | |
Labour | A. Beer | 1,849 | 38.5 | 1.1 | |
Liberal Democrats | Charles Wall | 495 | 10.3 | 3.9 | |
Majority | 605 | 12.6 | 6.1 | ||
Registered electors | 12,228 | ||||
Turnout | 39.1 | 3.0 | |||
Conservative hold | Swing | 3.0 | |||
Party | Candidate | Votes | % | ±% | |
---|---|---|---|---|---|
Labour | Moira McLaughlin | 1,824 | 79.9 | 3.8 | |
Conservative | C. Bowditch | 174 | 7.6 | 1.3 | |
Liberal Democrats | Stephen Blaylock | 151 | 6.6 | 0.5 | |
Green | Catherine Page | 134 | 5.9 | 2.0 | |
Majority | 1,650 | 72.3 | 5.2 | ||
Registered electors | 9,509 | ||||
Turnout | 24.0 | 6.3 | |||
Labour hold | Swing | 2.6 | |||
Party | Candidate | Votes | % | ±% | |
---|---|---|---|---|---|
Labour | A. Bell | 2,579 | 58.3 | 6.3 | |
Conservative | L. Turnbull | 1,350 | 30.5 | 6.4 | |
Liberal Democrats | N. Sherwen | 492 | 11.1 | 0.2 | |
Majority | 1,229 | 27.8 | 12.8 | ||
Registered electors | 12,466 | ||||
Turnout | 35.5 | 2.0 | |||
Labour gain from Conservative | Swing | 6.4 | |||
Party | Candidate | Votes | % | ±% | |
---|---|---|---|---|---|
Conservative | Kate Wood | 2,421 | 50.4 | 10.6 | |
Labour | Geoffrey Caton | 1,837 | 38.2 | 6.4 | |
Liberal Democrats | John Uriel | 546 | 11.4 | 4.2 | |
Majority | 584 | 12.2 | N/A | ||
Registered electors | 11,690 | ||||
Turnout | 41.1 | 2.4 | |||
Conservative hold | Swing | 8.5 | |||
Party | Candidate | Votes | % | ±% | |
---|---|---|---|---|---|
Conservative | Lesley Rennie | 1,781 | 47.3 | 3.1 | |
Labour | Elizabeth McArdle | 1,490 | 39.5 | 1.3 | |
Liberal Democrats | John Uriel | 443 | 11.8 | 0.4 | |
Green | George Bowler | 54 | 1.4 | New | |
Majority | 291 | 7.7 | 4.5 | ||
Turnout | 32.2 | 8.9 | |||
Conservative hold | Swing | 2.2 | |||
Date | Ward | Name | Previous affiliation | New affiliation | Circumstance | ||
---|---|---|---|---|---|---|---|
? | Prenton | Ed Cunniffe | Liberal Democrats | Ind. Liberal Democrat | Resigned. [19] | ||
• italics denote the sitting councillor • bold denotes the winning candidate
Wirral Metropolitan Borough Council elections are held every four years from 2023 onwards, having previously been held three years out of every four for a third of the council at a time. Wirral Metropolitan Borough Council, generally known as Wirral Council, is the local authority for the metropolitan borough of Wirral in Merseyside, England.
The 1998 Wirral Metropolitan Borough Council election took place on 7 May 1998 to elect members of Wirral Metropolitan Borough Council in England. This election was held on the same day as other local elections.
The 2000 Wirral Metropolitan Borough Council election took place on 4 May 2000 to elect members of Wirral Metropolitan Borough Council in England. This election was held on the same day as other local elections.
The 2004 Wirral Metropolitan Borough Council election took place on 10 June 2004 to elect members of Wirral Metropolitan Borough Council in England. This election was held on the same day as other local elections.
The 1973 Wirral Metropolitan Borough Council election took place on 10 May 1973 to elect members of Wirral Metropolitan Borough Council in England. This was on the same day as other local elections.
The 1976 Wirral Metropolitan Borough Council election took place on 6 May 1976 to elect Wirral Metropolitan Borough Council members in England. This election was held on the same day as other local elections.
The 1978 Wirral Metropolitan Borough Council election took place on 4 May 1978 to elect members of Wirral Metropolitan Borough Council in England. This election was held on the same day as other local elections.
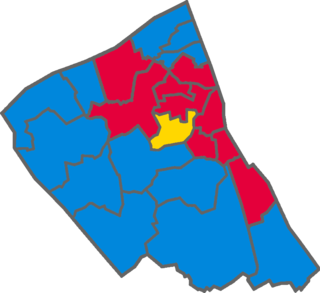
The 1979 Wirral Metropolitan Borough Council election took place on 3 May 1979 to elect members of Wirral Metropolitan Borough Council in England. This election was held on the same day as other local elections.
The 1980 Wirral Metropolitan Borough Council election took place on 1 May 1980 to elect members of Wirral Metropolitan Borough Council in England. This election was held on the same day as other local elections.
The 1982 Wirral Metropolitan Borough Council election took place on 6 May 1982 to elect members of Wirral Metropolitan Borough Council in England. This election was held on the same day as other local elections.
The 1983 Wirral Metropolitan Borough Council election took place on 5 May 1983 to elect members of Wirral Metropolitan Borough Council in England. This election was held on the same day as other local elections.
The 1984 Wirral Metropolitan Borough Council election took place on 3 May 1984 to elect members of Wirral Metropolitan Borough Council in England. This election was held on the same day as other local elections.
The 1986 Wirral Metropolitan Borough Council election took place on 8 May 1986 to elect members of Wirral Metropolitan Borough Council in England. This election was held on the same day as other local elections.
The 1987 Wirral Metropolitan Borough Council election took place on 7 May 1987 to elect members of Wirral Metropolitan Borough Council in England. This election was held on the same day as other local elections.
The 1988 Wirral Metropolitan Borough Council election took place on 5 May 1988 to elect members of Wirral Metropolitan Borough Council in England. This election was held on the same day as other local elections.
The 1990 Wirral Metropolitan Borough Council election took place on 3 May 1990 to elect members of Wirral Metropolitan Borough Council in England. This election was held on the same day as other local elections.
The 1991 Wirral Metropolitan Borough Council election took place on 2 May 1991 to elect members of Wirral Metropolitan Borough Council in England. This election was held on the same day as other local elections.
The 1992 Wirral Metropolitan Borough Council election took place on 7 May 1992 to elect members of Wirral Metropolitan Borough Council in England. This election was held on the same day as other local elections.
The 1994 Wirral Metropolitan Borough Council election took place on 5 May 1994 to elect members of Wirral Metropolitan Borough Council in England. This election was held on the same day as other local elections.
The 1995 Wirral Metropolitan Borough Council election took place on 4 May 1995 to elect members of Wirral Metropolitan Borough Council in England. This election was held on the same day as other local elections.
Mellows-Facer, Adam (10 May 2006). "Local election 2006". parliament.uk . Retrieved 29 December 2018.
"BBC NEWS VOTE 2003 WIRRAL". BBC News . 1 May 2003. Retrieved 29 December 2018.