| |||||||||||||||||||||||||||||||||||||||||||||||||
| |||||||||||||||||||||||||||||||||||||||||||||||||
22 of 66 seats (One Third) to Wirral Metropolitan Borough Council 34 seats needed for a majority | |||||||||||||||||||||||||||||||||||||||||||||||||
---|---|---|---|---|---|---|---|---|---|---|---|---|---|---|---|---|---|---|---|---|---|---|---|---|---|---|---|---|---|---|---|---|---|---|---|---|---|---|---|---|---|---|---|---|---|---|---|---|---|
Turnout | 27.1% (0.7%) [1] | ||||||||||||||||||||||||||||||||||||||||||||||||
| |||||||||||||||||||||||||||||||||||||||||||||||||
Map of results of 2000 election | |||||||||||||||||||||||||||||||||||||||||||||||||
|
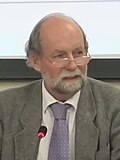
The 2000 Wirral Metropolitan Borough Council election took place on 4 May 2000 to elect members of Wirral Metropolitan Borough Council in England. [2] This election was held on the same day as other local elections.
After the election, the composition of the council was:
Party | Seats | ± | |
---|---|---|---|
Labour | 34 | 5 | |
Conservative | 20 | 3 | |
Liberal Democrats | 12 | 2 | |
Overall result compared with 1999.
Wirral Metropolitan Borough Council election results, 2000 | |||||||||||||||
---|---|---|---|---|---|---|---|---|---|---|---|---|---|---|---|
Party | Candidates | Votes | |||||||||||||
Stood | Elected | Gained | Unseated | Net | % of total | % | No. | Net % | |||||||
Conservative | 22 | 5 | 4 | 1 | 3 | 40.9 | 40.7 | 27,238 | 5.9 | ||||||
Labour | 22 | 8 | 0 | 5 | 5 | 36.4 | 30.7 | 20,542 | 7.7 | ||||||
Liberal Democrats | 22 | 5 | 2 | 0 | 2 | 22.7 | 25.8 | 17,271 | 1.9 | ||||||
Green | 19 | 0 | 0 | 0 | 0.0 | 2.8 | 1,846 | 0.1 |
Party | Candidate | Votes | % | ±% | |
---|---|---|---|---|---|
Conservative | Jacqueline Hall | 1,712 | 45.7 | 6.5 | |
Labour | Keith Williams | 1,550 | 41.4 | 6.4 | |
Liberal Democrats | Nigel Dyer | 374 | 10.0 | 0.4 | |
Green | Ann Jones | 108 | 2.9 | 0.3 | |
Majority | 162 | 4.3 | N/A | ||
Registered electors | 10,923 | ||||
Turnout | 34.3 | 1.6 | |||
Conservative gain from Labour | Swing | 6.5 | |||
Party | Candidate | Votes | % | ±% | |
---|---|---|---|---|---|
Labour | James Crabtree | 788 | 73.3 | 8.2 | |
Conservative | Yvonne Sanne | 142 | 13.2 | 5.0 | |
Liberal Democrats | John Tomlinson | 113 | 10.5 | 3.1 | |
Green | Pamela Holstein | 32 | 3.0 | ||
Majority | 646 | 60.1 | 13.2 | ||
Registered electors | 7,790 | ||||
Turnout | 13.8 | 2.3 | |||
Labour hold | Swing | 6.6 | |||
Party | Candidate | Votes | % | ±% | |
---|---|---|---|---|---|
Labour | Jean Stapleton | 1,107 | 71.3 | 2.8 | |
Conservative | Barbara Poole | 184 | 11.8 | 4.3 | |
Liberal Democrats | Mary Williams | 171 | 11.0 | 1.5 | |
Green | Stuart Harvey | 91 | 5.9 | 2.4 | |
Majority | 923 | 59.4 | 5.2 | ||
Registered electors | 10,099 | ||||
Turnout | 15.4 | 2.3 | |||
Labour hold | Swing | 2.6 | |||
Party | Candidate | Votes | % | ±% | |
---|---|---|---|---|---|
Liberal Democrats | Robert Moon | 1,390 | 46.0 | 25.0 | |
Labour | Robert Buckingham | 1,080 | 35.7 | 19.1 | |
Conservative | Ian Mackenzie | 475 | 15.7 | 4.9 | |
Green | Patricia Farmer | 78 | 2.6 | 1.0 | |
Majority | 310 | 10.3 | N/A | ||
Registered electors | 10,852 | ||||
Turnout | 27.9 | 2.3 | |||
Liberal Democrats gain from Labour | Swing | 22.1 | |||
Party | Candidate | Votes | % | ±% | |
---|---|---|---|---|---|
Conservative | Michael Moore | 2,126 | 41.8 | 8.9 | |
Liberal Democrats | Alan Taylor | 1,880 | 37.0 | 1.1 | |
Labour | Audrey Moore | 974 | 19.2 | 7.6 | |
Green | Michael Harper | 106 | 2.1 | 0.1 | |
Majority | 246 | 4.8 | N/A | ||
Registered electors | 14,044 | ||||
Turnout | 36.2 | 1.7 | |||
Conservative hold | Swing | 5.0 | |||
Party | Candidate | Votes | % | ±% | |
---|---|---|---|---|---|
Labour | George Davies | 1,324 | 53.9 | 0.2 | |
Conservative | Patricia Jones | 627 | 25.5 | 5.8 | |
Liberal Democrats | Stephen Blaycock | 406 | 16.5 | 3.8 | |
Green | Elisabeth Heydon | 99 | 4.0 | 1.9 | |
Majority | 697 | 28.4 | 5.4 | ||
Registered electors | 11,050 | ||||
Turnout | 22.3 | 1.9 | |||
Labour hold | Swing | 2.7 | |||
Party | Candidate | Votes | % | ±% | |
---|---|---|---|---|---|
Liberal Democrats | Phillip Gilchrist | 2,469 | 67.9 | 3.9 | |
Conservative | Barbara Green | 582 | 16.0 | 4.1 | |
Labour | Colin Kirwan | 542 | 14.9 | 7.5 | |
Green | Brian Gibbs | 41 | 1.1 | 0.7 | |
Majority | 1,887 | 51.9 | 10.3 | ||
Registered electors | 11,264 | ||||
Turnout | 32.3 | 0.4 | |||
Liberal Democrats hold | Swing | 5.2 | |||
Party | Candidate | Votes | % | ±% | |
---|---|---|---|---|---|
Labour | Andrew Dow | 1,063 | 55.0 | 10.1 | |
Conservative | Cyrus Ferguson | 455 | 23.6 | 7.0 | |
Liberal Democrats | Philip Lloyd | 283 | 14.6 | 4.0 | |
Green | Catherine Page | 131 | 6.8 | 1.0 | |
Majority | 608 | 31.5 | 16.9 | ||
Registered electors | 10,643 | ||||
Turnout | 18.2 | 3.0 | |||
Labour hold | Swing | 8.6 | |||
Party | Candidate | Votes | % | ±% | |
---|---|---|---|---|---|
Conservative | Stephen Rowlands | 2,985 | 71.8 | 3.9 | |
Labour | Albert McCabe | 576 | 13.9 | 3.5 | |
Liberal Democrats | Edward Norton | 467 | 11.2 | 0.7 | |
Green | Garnette Bowler | 128 | 3.1 | 0.3 | |
Majority | 2,409 | 58.0 | 7.4 | ||
Registered electors | 13,478 | ||||
Turnout | 30.9 | 1.1 | |||
Conservative hold | Swing | 3.7 | |||
Party | Candidate | Votes | % | ±% | |
---|---|---|---|---|---|
Conservative | Hilary Jones | 2,680 | 68.4 | 1.2 | |
Labour | Alan Milne | 570 | 14.5 | 4.1 | |
Liberal Democrats | Alan Richards | 470 | 12.0 | 1.4 | |
Green | Allen Burton | 199 | 5.1 | 1.5 | |
Majority | 2,110 | 53.8 | 5.2 | ||
Registered electors | 12,605 | ||||
Turnout | 31.1 | 2.6 | |||
Conservative hold | Swing | 2.7 | |||
Party | Candidate | Votes | % | ±% | |
---|---|---|---|---|---|
Labour | Ronald Abbey | 936 | 56.6 | 14.8 | |
Conservative | Simon Mountney | 436 | 26.4 | 10.7 | |
Liberal Democrats | Raymond Hayden | 281 | 17.0 | 4.2 | |
Majority | 500 | 30.2 | 25.5 | ||
Registered electors | 9,390 | ||||
Turnout | 17.6 | 2.7 | |||
Labour hold | Swing | 12.8 | |||
Party | Candidate | Votes | % | ±% | |
---|---|---|---|---|---|
Conservative | Alan Robinson | 1,185 | 45.8 | 18.0 | |
Labour | Denis Knowles | 1,005 | 38.8 | 17.3 | |
Liberal Democrats | Richard Ellett | 297 | 11.5 | 4.7 | |
Green | Matthew Adams | 101 | 3.9 | New | |
Majority | 180 | 7.0 | N/A | ||
Registered electors | 11,135 | ||||
Turnout | 23.3 | 1.5 | |||
Conservative gain from Labour | Swing | 17.7 | |||
Party | Candidate | Votes | % | ±% | |
---|---|---|---|---|---|
Conservative | Christopher Blakeley | 1,613 | 55.9 | 11.1 | |
Labour | Ann McLachlan | 1,023 | 35.4 | 11.0 | |
Liberal Democrats | Susanne Uriel | 251 | 8.7 | 0.1 | |
Majority | 590 | 20.4 | N/A | ||
Registered electors | 9,947 | ||||
Turnout | 29.1 | 1.1 | |||
Conservative gain from Labour | Swing | 11.1 | |||
Party | Candidate | Votes | % | ±% | |
---|---|---|---|---|---|
Conservative | Anthony Pritchard | 1,503 | 51.4 | 8.8 | |
Labour | John Salter | 1,049 | 35.9 | 8.8 | |
Liberal Democrats | John Codling | 264 | 9.0 | 0.3 | |
Green | George Bowler | 108 | 3.7 | 0.3 | |
Majority | 454 | 15.5 | N/A | ||
Registered electors | 11,579 | ||||
Turnout | 25.3 | 1.0 | |||
Conservative gain from Labour | Swing | 8.8 | |||
Party | Candidate | Votes | % | ±% | |
---|---|---|---|---|---|
Liberal Democrats | Freda Anderson | 1,683 | 56.8 | 9.2 | |
Conservative | Leonard Moore | 620 | 20.9 | 9.0 | |
Labour | John Mitchell | 540 | 18.2 | 0.8 | |
Green | Pamela Mitchell | 122 | 4.1 | 1.0 | |
Majority | 1,063 | 35.9 | 11.1 | ||
Registered electors | 11,544 | ||||
Turnout | 25.7 | 2.3 | |||
Liberal Democrats hold | Swing | 5.6 | |||
Party | Candidate | Votes | % | ±% | |
---|---|---|---|---|---|
Liberal Democrats | Margaret Bridson | 1,924 | 55.5 | 1.2 | |
Conservative | Ian McKellar | 843 | 24.3 | 4.6 | |
Labour | June Williams | 633 | 18.3 | 5.8 | |
Green | John Wilson | 68 | 2.0 | ||
Majority | 1,081 | 31.2 | 1.0 | ||
Registered electors | 11,659 | ||||
Turnout | 29.8 | 3.5 | |||
Liberal Democrats hold | Swing | 0.5 | |||
Party | Candidate | Votes | % | ±% | |
---|---|---|---|---|---|
Liberal Democrats | Peter Reisdorf | 2,507 | 48.1 | 7.9 | |
Conservative | Derek Robinson | 2,203 | 42.3 | 1.6 | |
Labour | William Ward | 420 | 8.1 | 9.1 | |
Green | Barbara Burton | 77 | 1.5 | 0.4 | |
Majority | 304 | 5.8 | N/A | ||
Registered electors | 12,914 | ||||
Turnout | 40.3 | 3.8 | |||
Liberal Democrats gain from Conservative | Swing | 3.2 | |||
Incumbent councillor for Bromborough and leader of the council Dave Jackson died in April 2000, days before he was due to stand, causing the election to be delayed. [20]
Party | Candidate | Votes | % | ±% | |
---|---|---|---|---|---|
Labour | Denis Knowles | 1,454 | 55.4 | 8.2 | |
Liberal Democrats | James Robinson | 814 | 31.0 | 5.0 | |
Conservative | Patricia Jones | 331 | 12.6 | 2.2 | |
Green | Perle Sheldricks | 26 | 1.0 | New | |
Majority | 640 | 24.4 | 13.2 | ||
Registered electors | 10,728 | ||||
Turnout | 24.7 | 5.0 | |||
Labour hold | Swing | 6.6 | |||
Party | Candidate | Votes | % | ±% | |
---|---|---|---|---|---|
Conservative | David Elderton | 2,508 | 64.0 | 5.3 | |
Labour | David Kean | 856 | 21.9 | 6.5 | |
Liberal Democrats | Charles Wall | 408 | 10.4 | 0.2 | |
Green | Percy Hogg | 145 | 3.7 | 1.0 | |
Majority | 1,652 | 42.2 | 11.9 | ||
Registered electors | 12,605 | ||||
Turnout | 31.1 | 0.8 | |||
Conservative hold | Swing | 5.9 | |||
Party | Candidate | Votes | % | ±% | |
---|---|---|---|---|---|
Labour | Moira McLaughlin | 893 | 68.5 | 7.2 | |
Conservative | Susan Bebell | 204 | 15.6 | 7.3 | |
Liberal Democrats | Christopher Teggin | 127 | 9.7 | 0.4 | |
Green | Angela Upton | 80 | 6.1 | 0.1 | |
Majority | 689 | 52.8 | 12.8 | ||
Registered electors | 9,036 | ||||
Turnout | 14.5 | 2.3 | |||
Labour hold | Swing | 6.4 | |||
Party | Candidate | Votes | % | ±% | |
---|---|---|---|---|---|
Labour | Susan Brown | 1,461 | 49.9 | 5.3 | |
Conservative | Marcus Darby | 1,050 | 35.9 | 6.7 | |
Liberal Democrats | Christopher Beazer | 309 | 10.6 | 2.0 | |
Green | Joyce Hogg | 106 | 3.6 | 0.6 | |
Majority | 411 | 14.0 | 12.0 | ||
Registered electors | 12,336 | ||||
Turnout | 23.7 | 1.5 | |||
Labour hold | Swing | 6.0 | |||
Party | Candidate | Votes | % | ±% | |
---|---|---|---|---|---|
Conservative | Kate Wood | 2,774 | 72.0 | 7.3 | |
Labour | Margaret Allen | 698 | 18.1 | 5.2 | |
Liberal Democrats | John Uriel | 383 | 9.9 | 0.7 | |
Majority | 2,076 | 53.9 | 12.5 | ||
Registered electors | 12,011 | ||||
Turnout | 32.2 | 1.1 | |||
Conservative hold | Swing | 6.3 | |||
Date | Ward | Name | Previous affiliation | New affiliation | Circumstance | ||
---|---|---|---|---|---|---|---|
December 2001 | Egerton | Colin Dow | Labour | Independent | Whip removed. [24] | ||
February 2002 | Bebington | Kath Shaughnessy | Labour | Independent | Resigned. [24] |
• italics denote the sitting councillor • bold denotes the winning candidate
Wirral Metropolitan Borough Council elections are held every four years from 2023 onwards, having previously been held three years out of every four for a third of the council at a time. Wirral Metropolitan Borough Council, generally known as Wirral Council, is the local authority for the metropolitan borough of Wirral in Merseyside, England.
The 1998 Wirral Metropolitan Borough Council election took place on 7 May 1998 to elect members of Wirral Metropolitan Borough Council in England. This election was held on the same day as other local elections.
The 1999 Wirral Metropolitan Borough Council election took place on 6 May 1999 to elect members of Wirral Metropolitan Borough Council in England. This election was held on the same day as other local elections.
The 2002 Wirral Metropolitan Borough Council election took place on 2 May 2002 to elect members of Wirral Metropolitan Borough Council in England. This election was held on the same day as other local elections.
The 2004 Wirral Metropolitan Borough Council election took place on 10 June 2004 to elect members of Wirral Metropolitan Borough Council in England. This election was held on the same day as other local elections.
The 2006 Wirral Metropolitan Borough Council election took place on 4 May 2006 to elect members of Wirral Metropolitan Borough Council in England. This election was held on the same day as other local elections.
The 2008 Wirral Metropolitan Borough Council election took place on 1 May 2008 to elect members of Wirral Metropolitan Borough Council in England. This election was held on the same day as other local elections.
Wirral Council is the local authority of the Metropolitan Borough of Wirral in Merseyside, England. Wirral is a metropolitan borough, one of five in Merseyside, and provides the majority of local government services in Wirral. The council is a constituent member of the Liverpool City Region Combined Authority.
The 2014 Wirral Metropolitan Borough Council election took place on 22 May 2014 to elect members of Wirral Metropolitan Borough Council in England. This election was held on the same day as other local elections.
The 2015 Wirral Metropolitan Borough Council election took place on 7 May 2015 to elect members of Wirral Metropolitan Borough Council in England. This election was held on the same day as other local elections.
The 1975 Wirral Metropolitan Borough Council election took place on 1 May 1975 to elect members of Wirral Metropolitan Borough Council in England. This election was held on the same day as other local elections.
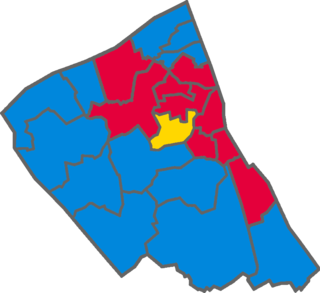
The 1979 Wirral Metropolitan Borough Council election took place on 3 May 1979 to elect members of Wirral Metropolitan Borough Council in England. This election was held on the same day as other local elections.
The 1982 Wirral Metropolitan Borough Council election took place on 6 May 1982 to elect members of Wirral Metropolitan Borough Council in England. This election was held on the same day as other local elections.
The 1983 Wirral Metropolitan Borough Council election took place on 5 May 1983 to elect members of Wirral Metropolitan Borough Council in England. This election was held on the same day as other local elections.
The 1986 Wirral Metropolitan Borough Council election took place on 8 May 1986 to elect members of Wirral Metropolitan Borough Council in England. This election was held on the same day as other local elections.
The 1987 Wirral Metropolitan Borough Council election took place on 7 May 1987 to elect members of Wirral Metropolitan Borough Council in England. This election was held on the same day as other local elections.
The 1991 Wirral Metropolitan Borough Council election took place on 2 May 1991 to elect members of Wirral Metropolitan Borough Council in England. This election was held on the same day as other local elections.
The 1994 Wirral Metropolitan Borough Council election took place on 5 May 1994 to elect members of Wirral Metropolitan Borough Council in England. This election was held on the same day as other local elections.
The 1995 Wirral Metropolitan Borough Council election took place on 4 May 1995 to elect members of Wirral Metropolitan Borough Council in England. This election was held on the same day as other local elections.
The 1996 Wirral Metropolitan Borough Council election took place on 2 May 1996 to elect members of Wirral Metropolitan Borough Council in England. This election was held on the same day as other local elections.
"Everything to play for in local polls". Wirral Globe. 4 May 2000. Retrieved 29 December 2018.