| |||||||||||||||||||||||||||||||||||||||||||||||||||||
All 55 seats to West Dorset District Council 28 seats needed for a majority | |||||||||||||||||||||||||||||||||||||||||||||||||||||
---|---|---|---|---|---|---|---|---|---|---|---|---|---|---|---|---|---|---|---|---|---|---|---|---|---|---|---|---|---|---|---|---|---|---|---|---|---|---|---|---|---|---|---|---|---|---|---|---|---|---|---|---|---|
| |||||||||||||||||||||||||||||||||||||||||||||||||||||
|
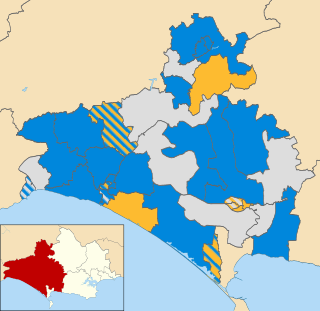
The 1999 West Dorset District Council election was held on Thursday 6 May 1999 to elect councillors to West Dorset District Council in England. It took place on the same day as other district council elections in the United Kingdom. The entire council was up for election.
The 1999 election saw the Conservatives become the largest party on the council but fall short of a majority.
Party | Candidate | Votes | % | ±% | |
---|---|---|---|---|---|
Liberal Democrats | F. Streets * | 795 | 39.1 | +5.5 | |
Conservative | V. Ivory | 768 | 37.8 | +12.7 | |
Independent | D. Wenn | 470 | 23.1 | N/A | |
Turnout | 57.0 | –14.8 | |||
Registered electors | 3,230 | ||||
Liberal Democrats hold | Swing | ||||
Conservative gain from Independent | Swing | ||||
Party | Candidate | Votes | % | ±% | |
---|---|---|---|---|---|
Conservative | G. Pritchard * | 429 | 56.1 | –4.2 | |
Liberal Democrats | D. Tett | 336 | 43.9 | N/A | |
Majority | 93 | 12.2 | –8.3 | ||
Turnout | 43.7 | –7.9 | |||
Registered electors | 1,754 | ||||
Conservative hold | Swing | ||||
Party | Candidate | Votes | % | ±% | |
---|---|---|---|---|---|
Independent | E. Garrett * | 417 | 58.3 | N/A | |
Independent | J. Greene | 160 | 22.4 | N/A | |
Liberal Democrats | S. Hewson | 138 | 19.3 | N/A | |
Majority | 257 | 35.9 | N/A | ||
Turnout | 47.7 | N/A | |||
Registered electors | 1,499 | ||||
Independent hold | |||||
Party | Candidate | Votes | % | ±% | |
---|---|---|---|---|---|
Independent | R. Coatsworth * | unopposed | N/A | N/A | |
Registered electors | 1,869 | ||||
Independent hold | |||||
Party | Candidate | Votes | % | ±% | |
---|---|---|---|---|---|
Labour | L. Dibdin * | 611 | 36.3 | –4.3 | |
Liberal Democrats | R. Draper * | 554 | 32.9 | +1.2 | |
Conservative | B. Rowe * | 520 | 30.9 | +3.2 | |
Liberal Democrats | J. Shaw | 471 | – | ||
Turnout | 33.6 | –9.1 | |||
Registered electors | 3,322 | ||||
Labour hold | Swing | ||||
Liberal Democrats hold | Swing | ||||
Conservative hold | Swing | ||||
Party | Candidate | Votes | % | ±% | |
---|---|---|---|---|---|
Conservative | S. Brown | 392 | 39.0 | +16.6 | |
Labour | C. Wild | 372 | 37.1 | –0.1 | |
Conservative | H. Samuel | 260 | – | ||
Liberal Democrats | B. Wheeler | 240 | 23.9 | +10.3 | |
Liberal Democrats | S. Bagnell | 212 | – | ||
Turnout | 32.6 | –20.9 | |||
Registered electors | 2,625 | ||||
Conservative gain from Independent | Swing | ||||
Labour hold | Swing | ||||
Party | Candidate | Votes | % | ±% | |
---|---|---|---|---|---|
Independent | A. Thacker * | 459 | 84.7 | N/A | |
Labour | C. Austen | 83 | 15.3 | N/A | |
Majority | 376 | 69.4 | N/A | ||
Turnout | 35.1 | N/A | |||
Registered electors | 1,560 | ||||
Independent hold | |||||
Party | Candidate | Votes | % | ±% | |
---|---|---|---|---|---|
Conservative | L. Sewell | 336 | 63.9 | N/A | |
Liberal Democrats | S. Gibbs | 190 | 36.1 | N/A | |
Majority | 146 | 27.8 | N/A | ||
Turnout | 44.0 | N/A | |||
Registered electors | 1,203 | ||||
Conservative gain from Liberal Democrats |
Party | Candidate | Votes | % | ±% | |
---|---|---|---|---|---|
Conservative | M. Pritchard * | 437 | 59.0 | N/A | |
Liberal Democrats | S. Marshall | 304 | 41.0 | N/A | |
Majority | 133 | 17.9 | N/A | ||
Turnout | 56.2 | N/A | |||
Registered electors | 1,325 | ||||
Conservative hold | |||||
Party | Candidate | Votes | % | ±% | |
---|---|---|---|---|---|
Conservative | P. Sargent | 229 | 51.3 | N/A | |
Liberal Democrats | E. Compton | 217 | 48.7 | +1.1 | |
Majority | 12 | 2.7 | N/A | ||
Turnout | 41.6 | –7.3 | |||
Registered electors | 1,075 | ||||
Conservative gain from Independent | Swing | ||||
Party | Candidate | Votes | % | ±% | |
---|---|---|---|---|---|
Independent | R. Stenhouse * | unopposed | N/A | N/A | |
Registered electors | 1,323 | ||||
Independent hold | |||||
Party | Candidate | Votes | % | ±% | |
---|---|---|---|---|---|
Conservative | S. East | 336 | 49.7 | N/A | |
Liberal Democrats | A. Chisholm | 239 | 36.4 | N/A | |
Labour | L. Ahern | 91 | 13.9 | N/A | |
Majority | 97 | 13.3 | N/A | ||
Turnout | 52.5 | N/A | |||
Registered electors | 1,253 | ||||
Conservative hold | |||||
Party | Candidate | Votes | % | ±% | |
---|---|---|---|---|---|
Independent | D. Newson | 286 | 45.4 | N/A | |
Conservative | G. Brierley | 255 | 40.5 | N/A | |
Labour | J. Everington | 89 | 14.1 | N/A | |
Majority | 31 | 4.9 | N/A | ||
Turnout | 42.4 | N/A | |||
Registered electors | 1,493 | ||||
Independent gain from Independent |
Party | Candidate | Votes | % | ±% | |
---|---|---|---|---|---|
Independent | E. Topliss | 361 | 57.9 | N/A | |
Conservative | C. Grove | 262 | 42.1 | N/A | |
Majority | 99 | 15.9 | N/A | ||
Turnout | 44.8 | N/A | |||
Registered electors | 1,397 | ||||
Independent gain from Independent |
Party | Candidate | Votes | % | ±% | |
---|---|---|---|---|---|
Liberal Democrats | S. Sawtell | 844 | 76.7 | N/A | |
Liberal Democrats | I. Gardner * | 676 | – | ||
Labour | R. Hyde | 257 | 23.3 | N/A | |
Labour | R. Kiss | 205 | – | ||
Turnout | 27.6 | N/A | |||
Registered electors | 4,067 | ||||
Liberal Democrats gain from Conservative | |||||
Liberal Democrats gain from Independent |
Party | Candidate | Votes | % | ±% | |
---|---|---|---|---|---|
Liberal Democrats | Enid Stella Jones * | 614 | 52.3 | –23.2 | |
Liberal Democrats | T. Harries * | 470 | – | ||
Conservative | J. Pike | 296 | 25.2 | +0.7 | |
Labour | L. Kiss | 263 | 22.4 | N/A | |
Turnout | 31.9 | –3.8 | |||
Registered electors | 3,100 | ||||
Liberal Democrats hold | Swing | ||||
Party | Candidate | Votes | % | ±% | |
---|---|---|---|---|---|
Liberal Democrats | R. Biggs * | 463 | 34.1 | +5.9 | |
Independent | D. Barrett * | 393 | 29.0 | N/A | |
Conservative | M. Ansell | 265 | 19.5 | N/A | |
Labour | P. Paul | 236 | 17.4 | –3.7 | |
Conservative | A. Richards | 214 | – | ||
Turnout | 39.8 | –7.2 | |||
Registered electors | 2,261 | ||||
Liberal Democrats hold | Swing | ||||
Independent gain from Independent | Swing | ||||
Party | Candidate | Votes | % | ±% | |
---|---|---|---|---|---|
Liberal Democrats | M. Rennie * | 823 | 35.4 | –7.1 | |
Liberal Democrats | H. Dowell * | 786 | – | ||
Liberal Democrats | D. Maggs * | 722 | – | ||
Conservative | C. Grassby | 656 | 28.2 | +5.6 | |
Independent | K. Lambert | 604 | 26.0 | –8.9 | |
Conservative | R. Martindale | 542 | – | ||
Conservative | C. Reed | 437 | – | ||
Labour | R. Brereton | 243 | 10.4 | N/A | |
Turnout | 43.6 | –1.4 | |||
Registered electors | 3,981 | ||||
Liberal Democrats hold | Swing | ||||
Party | Candidate | Votes | % | ±% | |
---|---|---|---|---|---|
Labour | J. Antell * | 851 | 44.9 | –6.4 | |
Labour | W. Gundry * | 673 | – | ||
Liberal Democrats | David Trevor Jones * | 673 | 35.5 | +3.9 | |
Liberal Democrats | Andrew James Canning | 447 | – | ||
Conservative | P. Graham | 370 | 19.5 | +2.4 | |
Liberal Democrats | R. Potter | 369 | – | ||
Conservative | B. Pankhurst | 325 | – | ||
Turnout | 41.6 | –4.7 | |||
Registered electors | 3,381 | ||||
Labour hold | Swing | ||||
Liberal Democrats hold | Swing | ||||
Party | Candidate | Votes | % | ±% | |
---|---|---|---|---|---|
Independent | M. Penfold * | unopposed | N/A | N/A | |
Registered electors | 1,288 | ||||
Independent hold | |||||
Party | Candidate | Votes | % | ±% | |
---|---|---|---|---|---|
Independent | T. Frost * | 397 | 64.8 | N/A | |
Liberal Democrats | B. Dearlove | 216 | 35.2 | N/A | |
Majority | 181 | 29.5 | N/A | ||
Turnout | 45.9 | N/A | |||
Registered electors | 1,339 | ||||
Independent hold | |||||
Party | Candidate | Votes | % | ±% | |
---|---|---|---|---|---|
Liberal Democrats | S. Friar * | 450 | 66.8 | –2.4 | |
Conservative | C. Etherington | 224 | 33.2 | +2.4 | |
Majority | 226 | 33.5 | –4.9 | ||
Turnout | 52.1 | –5.9 | |||
Registered electors | 1,305 | ||||
Liberal Democrats hold | Swing | ||||
Party | Candidate | Votes | % | ±% | |
---|---|---|---|---|---|
Conservative | E. Bryan | unopposed | N/A | N/A | |
Registered electors | 1,142 | ||||
Conservative hold | |||||
Party | Candidate | Votes | % | ±% | |
---|---|---|---|---|---|
Independent | O. Lovell * | 792 | – | ||
Conservative | K. Meech | 602 | 31.1 | –6.4 | |
Liberal Democrats | S. Hicks | 539 | 27.9 | +20.2 | |
Independent | K. Whetlor | 455 | – | ||
Conservative | S. Poupard * | 386 | – | ||
Independent | S. Hogg | 309 | – | N/A | |
Turnout | 40.0 | +1.0 | |||
Registered electors | 3,218 | ||||
Independent hold | Swing | ||||
Conservative hold | Swing | ||||
Liberal Democrats gain from Independent | Swing | ||||
Party | Candidate | Votes | % | ±% | |
---|---|---|---|---|---|
Independent | E. Harris * | 406 | 72.4 | –0.4 | |
Conservative | C. Davies | 155 | 27.6 | +0.4 | |
Majority | 251 | 44.7 | –0.9 | ||
Turnout | 45.5 | –5.5 | |||
Registered electors | 1,246 | ||||
Independent hold | Swing | ||||
Party | Candidate | Votes | % | ±% | |
---|---|---|---|---|---|
Conservative | G. Haynes * | 333 | 52.0 | +1.3 | |
Liberal Democrats | R. Pawley | 307 | 48.0 | N/A | |
Majority | 26 | 4.1 | +2.7 | ||
Turnout | 43.0 | +1.0 | |||
Registered electors | 1,493 | ||||
Conservative hold | Swing | ||||
Party | Candidate | Votes | % | ±% | |
---|---|---|---|---|---|
Conservative | D. Smy | 605 | 46.3 | N/A | |
Conservative | T. Seall | 561 | – | ||
Independent | J. Shuttleworth * | 439 | 33.6 | N/A | |
Labour | E. Austen | 264 | 20.2 | N/A | |
Turnout | 39.9 | N/A | |||
Registered electors | 2,718 | ||||
Conservative hold | |||||
Conservative gain from SDP |
Party | Candidate | Votes | % | ±% | |
---|---|---|---|---|---|
Conservative | J. Boughey * | unopposed | N/A | N/A | |
Registered electors | 1,490 | ||||
Conservative hold | |||||
Party | Candidate | Votes | % | ±% | |
---|---|---|---|---|---|
Conservative | G. Harries * | 206 | 39.5 | N/A | |
Independent | T. Pearce | 186 | 35.7 | N/A | |
Liberal Democrats | M. Lane | 79 | 15.2 | N/A | |
Labour | O. Trevett | 50 | 9.6 | N/A | |
Majority | 20 | 3.8 | N/A | ||
Turnout | 42.7 | N/A | |||
Registered electors | 1,219 | ||||
Conservative hold | |||||
Party | Candidate | Votes | % | ±% | |
---|---|---|---|---|---|
Independent | I. Martin * | 339 | 63.5 | N/A | |
Conservative | W. Coyler | 195 | 36.5 | N/A | |
Majority | 144 | 27.0 | N/A | ||
Turnout | 45.1 | N/A | |||
Registered electors | 1,189 | ||||
Independent hold | |||||
Party | Candidate | Votes | % | ±% | |
---|---|---|---|---|---|
Conservative | T. Farmer * | 445 | 34.6 | –4.7 | |
Independent | M. Hughes | 390 | – | N/A | |
Independent | O. Chisholm | 376 | – | N/A | |
Conservative | M. Snowden | 299 | – | ||
Labour | R. Bygrave * | 258 | 20.1 | –13.3 | |
Liberal Democrats | D. Fisher | 192 | 14.9 | –12.4 | |
Liberal Democrats | M. Rehahn | 134 | – | ||
Turnout | 40.4 | –5.3 | |||
Registered electors | 2,785 | ||||
Conservative hold | Swing | ||||
Independent gain from Independent | Swing | ||||
Party | Candidate | Votes | % | ±% | |
---|---|---|---|---|---|
Conservative | D. Mildenhall * | 922 | 50.7 | +10.4 | |
Conservative | P. Shorland * | 749 | – | ||
Liberal Democrats | Robin Andrew Shane Legg | 648 | 35.6 | +3.2 | |
Conservative | H. Warburton | 625 | – | ||
Liberal Democrats | J. Palmer | 520 | – | ||
Liberal Democrats | E. Gasson | 414 | – | ||
Independent | J. Williams | 249 | 13.7 | N/A | |
Turnout | 40.3 | –6.3 | |||
Registered electors | 3,871 | ||||
Conservative hold | Swing | ||||
Liberal Democrats hold | Swing | ||||
Party | Candidate | Votes | % | ±% | |
---|---|---|---|---|---|
Conservative | G. Summers * | 219 | 51.2 | +0.4 | |
Liberal Democrats | F. McKenzie | 209 | 48.8 | N/A | |
Majority | 10 | 2.3 | +0.7 | ||
Turnout | 32.2 | –0.3 | |||
Registered electors | 1,343 | ||||
Conservative hold | Swing | ||||
Party | Candidate | Votes | % | ±% | |
---|---|---|---|---|---|
Conservative | I. Gillespie | 283 | 56.4 | –2.7 | |
Independent | T. Bennett | 219 | 43.6 | N/A | |
Majority | 64 | 12.7 | –5.4 | ||
Turnout | 47.2 | –0.8 | |||
Registered electors | 1,083 | ||||
Conservative hold | Swing | ||||
Party | Candidate | Votes | % | ±% | |
---|---|---|---|---|---|
Conservative | I. Mayo | 222 | 57.1 | –6.7 | |
Labour | R. Pickering | 88 | 22.6 | –13.6 | |
Liberal Democrats | C. Hebditch | 79 | 20.3 | N/A | |
Majority | 134 | 34.4 | +6.9 | ||
Turnout | 47.9 | +1.1 | |||
Registered electors | 820 | ||||
Conservative hold | Swing | ||||
Party | Candidate | Votes | % | ±% | |
---|---|---|---|---|---|
Liberal Democrats | H. Thomas | 379 | 51.8 | +8.8 | |
Conservative | D. Bushrod * | 353 | 48.2 | –8.8 | |
Majority | 26 | 3.6 | N/A | ||
Turnout | 62.7 | +10.7 | |||
Registered electors | 1,178 | ||||
Liberal Democrats gain from Conservative | Swing | ||||
Party | Candidate | Votes | % | ±% | |
---|---|---|---|---|---|
Independent | S. Slade * | 406 | 46.5 | N/A | |
Liberal Democrats | D. Rickard | 254 | 29.1 | N/A | |
Conservative | J. Holdaway | 213 | 24.4 | N/A | |
Majority | 152 | 17.4 | N/A | ||
Turnout | 43.2 | N/A | |||
Registered electors | 2,031 | ||||
Independent hold | |||||
Party | Candidate | Votes | % | ±% | |
---|---|---|---|---|---|
Conservative | G. House | 435 | 70.5 | +27.9 | |
Liberal Democrats | K. Goulding | 182 | 29.5 | –27.9 | |
Majority | 253 | 41.0 | N/A | ||
Turnout | 43.0 | –6.7 | |||
Registered electors | 1,434 | ||||
Conservative gain from Liberal Democrats | Swing | ||||
East Dorset was a local government district in Dorset, England. Its council met in Wimborne Minster between 2016 and 2019.
North Dorset District Council in Dorset, England existed from 1974 to 2019, when it was abolished and subsumed into Dorset Council.
Kennet was a non-metropolitan district in Wiltshire, England. It was abolished on 1 April 2009 and replaced by Wiltshire Council.
East Dorset District Council in Dorset, England existed from 1973 to 2019, when it was abolished and subsumed into Dorset Council.
The 2011 West Dorset District Council election was held on Thursday 5 May 2011 to elect councillors to West Dorset District Council in England. It took place on the same day as other district council elections in the United Kingdom. The whole of this 48-seat council was up for election.
The 1999 East Dorset District Council election took place on 6 May 1999 to elect members of East Dorset District Council in Dorset, England. The whole council was up for election and the Conservative Party gained overall control of the council from the Liberal Democrats.
The 2015 West Dorset District Council election was held on Thursday 7 May 2015 to elect councillors to West Dorset District Council in England. It took place on the same day as the general election other district council elections in the United Kingdom. A series of boundary changes saw the number of councillors reduced from 48 to 44.
Salisbury District Council was the local authority for the non-metropolitan district of Salisbury, created in 1974 in Wiltshire, England. It was abolished on 1 April 2009 and replaced by Wiltshire Council.
West Dorset District Council in Dorset, England existed from 1974 to 2019. The council was abolished and subsumed into Dorset Council in 2019.
The 2019 Dorset Council election was held on Thursday 2 May 2019 to elect councillors to the new Dorset Council in England. It took place on the same day as other district council elections in the United Kingdom.
The 1973 West Dorset District Council election was held on Thursday 10 May 1973 to elect councillors to the new West Dorset District Council in England. It took place on the same day as other district council elections in the United Kingdom.
The 1979 West Dorset District Council election was held on Thursday 3 May 1979 to elect councillors to West Dorset District Council in England. It took place on the same day as the general election and other district council elections in the United Kingdom. This was the third election to the district council, the election saw terms of councillors extended from three to four years.
The 1983 West Dorset District Council election was held on Thursday 5 May 1983 to elect councillors to West Dorset District Council in England. It took place on the same day as other district council elections in the United Kingdom. The entire council was up for election, following boundary changes that reduced the number of wards by two, but altogether the number of seats remained the same. Subsequent elections for the council would be elected by thirds following the passing a resolution under section 7 (4) (b) of the Local Government Act 1972.
The 1984 West Dorset District Council election was held on Thursday 3 May 1984 to elect councillors to West Dorset District Council in England. It took place on the same day as other district council elections in the United Kingdom. One third of seats were up for election.
The 1986 West Dorset District Council election was held on Thursday 8 May 1986 to elect councillors to West Dorset District Council in England. It took place on the same day as other district council elections in the United Kingdom. One third of seats were up for election.
The 1987 West Dorset District Council election was held on Thursday 7 May 1987 to elect councillors to West Dorset District Council in England. It took place on the same day as other district council elections in the United Kingdom. The entire council was up for election as West Dorset returned to whole councils elections, after previously having been elected in thirds.
The 1991 West Dorset District Council election was held on Thursday 2 May 1991 to elect councillors to West Dorset District Council in England. It took place on the same day as other district council elections in the United Kingdom. The entire council was up for election. District boundary changes took place before the election but the number of seats remained the same.
The 1995 West Dorset District Council election was held on Thursday 4 May 1995 to elect councillors to West Dorset District Council in England. It took place on the same day as other district council elections in the United Kingdom. The entire council was up for election.
The 2003 West Dorset District Council election was held on Thursday 1 May 2003 to elect councillors to West Dorset District Council in England. It took place on the same day as other district council elections in the United Kingdom. The entire council was up for election. Following boundary changes the number of wards were reduced by five, and the number of seats reduced from 55 to 48.
The 2007 West Dorset District Council election was held on Thursday 3 May 2007 to elect councillors to West Dorset District Council in England. It took place on the same day as other district council elections in the United Kingdom. The entire council was up for election.