Borough result maps
 2003 results map
 2007 results map
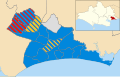 2011 results map
 2015 results map
Bournemouth Borough Council was the local authority for Bournemouth in Dorset, England between 1974 and 2019. Prior to 1974 Bournemouth had been a county borough within Hampshire (being a county borough meant it was self-governing, being independent of Hampshire County Council). Under the Local Government Act 1972 Bournemouth became a non-metropolitan district within Dorset on 1 April 1974, with the same boundaries as the former county borough. On 1 April 1997 it became a unitary authority, taking over the functions previously provided for the area by Dorset County Council. In 2019 the council was abolished, merging with Christchurch and Poole to form Bournemouth, Christchurch and Poole.
The first elections to the reformed council were held in 1973, initially to act as a shadow authority prior to the new arrangements coming into force the following year. From 1973 until the council's abolition in 2019 political control of the council was held by the following parties: [1]
Lower tier non-metropolitan district
| Party in control | Years | |
|---|---|---|
| Conservative | 1973–1991 | |
| No overall control | 1991–1997 | |
Unitary authority
| Party in control | Years | |
|---|---|---|
| No overall control | 1997–2003 | |
| Liberal Democrats | 2003–2007 | |
| Conservative | 2007–2019 | |
The role of mayor was largely ceremonial at Bournemouth Borough Council. Political leadership was instead provided by the leader of the council. The leaders from 2007 until the council's abolition in 2019 were:
| Councillor | Party | From | To | |
|---|---|---|---|---|
| Richard Smith [2] | Liberal Democrats | 2007 | ||
| Stephen MacLoughlin [3] [4] | Conservative | May 2007 | 2010 | |
| Peter Charon [5] | Conservative | 19 Jul 2010 | 21 Feb 2012 | |
| John Beesley [6] [7] [8] | Conservative | 21 Feb 2012 | 31 Mar 2019 | |
The table below illustrates the seats won by the parties at each election and control of the council. [11]
| Year | Conservative | Liberal Democrats [12] | Labour | Green | UKIP | Others | Council control after election | |
|---|---|---|---|---|---|---|---|---|
| Local government reorganisation; interim council created (57 seats) | ||||||||
| 1973 | 40 | 2 | 12 | 0 | 0 | 3 | Conservative | |
| 1976 | 46 | 2 | 3 | 0 | 0 | 6 | Conservative | |
| New ward boundaries | ||||||||
| 1979 | 45 | 2 | 6 | 0 | 0 | 4 | Conservative | |
| 1983 | 39 | 5 | 5 | 0 | 0 | 8 | Conservative | |
| 1987 | 37 | 13 | 4 | 0 | 0 | 3 | Conservative | |
| 1991 | 20 | 28 | 6 | 0 | 0 | 3 | No overall control | |
| 1995 | 21 | 26 | 6 | 0 | 0 | 4 | No overall control | |
| Council becomes a unitary authority | ||||||||
| 1996 | 19 | 28 | 6 | 0 | 0 | 4 | No overall control | |
| 1999 | 25 | 20 | 6 | 0 | 0 | 6 | No overall control | |
| New ward boundaries; seats decreased from 57 to 54 | ||||||||
| 2003 | 16 | 33 | 3 | 0 | 0 | 2 | Liberal Democrats | |
| 2007 | 41 | 7 | 3 | 0 | 0 | 3 | Conservative | |
| 2011 | 45 | 3 | 3 | 0 | 0 | 3 | Conservative | |
| 2015 | 51 | 0 | 0 | 1 | 1 | 1 | Conservative | |
| Council abolished; merged into Bournemouth, Christchurch & Poole Council | ||||||||


| Party | Candidate | Votes | % | ±% | |
|---|---|---|---|---|---|
| Conservative | Howard Henning | 559 | 40.0 | +19.3 | |
| Liberal Democrats | John Hayter | 537 | 38.4 | −1.1 | |
| Labour | Tony Hughes | 301 | 21.5 | +1.2 | |
| Majority | 22 | 1.6 | |||
| Turnout | 1,397 | 23.2 | |||
| Conservative gain from Liberal Democrats | Swing | ||||
| Party | Candidate | Votes | % | ±% | |
|---|---|---|---|---|---|
| Conservative | John Beesley | 1,565 | 75.5 | +13.6 | |
| Liberal Democrats | Neil Russell | 351 | 16.9 | −7.1 | |
| Labour | David Stokes | 156 | 7.5 | −6.6 | |
| Majority | 1,214 | 58.6 | |||
| Turnout | 2,072 | 30.7 | |||
| Conservative hold | Swing | ||||
| Party | Candidate | Votes | % | ±% | |
|---|---|---|---|---|---|
| Liberal Democrats | Jean Littlewood | 1,276 | 54.7 | +11.3 | |
| Conservative | Terry Hellier-Woods | 917 | 39.3 | +1.9 | |
| Labour | Arthur O'Luby | 139 | 6.0 | −13.3 | |
| Majority | 359 | 15.4 | |||
| Turnout | 2,332 | 29.6 | |||
| Liberal Democrats hold | Swing | ||||
| Party | Candidate | Votes | % | ±% | |
|---|---|---|---|---|---|
| Labour | Janice Hurne | 708 | 44.7 | −9.8 | |
| Liberal Democrats | Donald Lazenbury | 532 | 33.6 | +13.1 | |
| Conservative | Michaela Keene | 345 | 21.8 | −3.2 | |
| Majority | 176 | 11.1 | |||
| Turnout | 1,585 | 25.2 | |||
| Labour hold | Swing | ||||
| Party | Candidate | Votes | % | ±% | |
|---|---|---|---|---|---|
| Conservative | Lynda Price | 766 | 52.9 | +1.9 | |
| Liberal Democrats | Lorna McGowan | 484 | 33.4 | +5.4 | |
| UKIP | Graham Evans | 128 | 8.8 | −2.9 | |
| Labour | David Stokes | 70 | 4.8 | −4.5 | |
| Majority | 282 | 19.5 | |||
| Turnout | 1,448 | 21.9 | |||
| Conservative hold | Swing | ||||
| Party | Candidate | Votes | % | ±% | |
|---|---|---|---|---|---|
| Liberal Democrats | Benedict Prescott | 526 | 42.9 | +8.1 | |
| Conservative | Christopher Wakefield | 384 | 31.3 | +5.9 | |
| Labour | David Stokes | 120 | 9.8 | −5.6 | |
| UKIP | Graham Evans | 107 | 8.7 | +8.7 | |
| Green | Roger Eede | 90 | 7.3 | +7.3 | |
| Majority | 142 | 11.6 | |||
| Turnout | 1,227 | 20.9 | |||
| Liberal Democrats hold | Swing | ||||
| Party | Candidate | Votes | % | ±% | |
|---|---|---|---|---|---|
| Liberal Democrats | Patricia Lewis | 720 | 37.0 | −7.8 | |
| Labour | Dennis Gritt | 645 | 33.1 | +4.8 | |
| Conservative | Christopher Pomeroy | 456 | 23.4 | +7.1 | |
| UKIP | Mark Smith | 126 | 6.5 | +6.5 | |
| Majority | 75 | 3.9 | |||
| Turnout | 1,947 | 26.1 | |||
| Liberal Democrats hold | Swing | ||||
| Party | Candidate | Votes | % | ±% | |
|---|---|---|---|---|---|
| Conservative | Nicholas King | 1,318 | 67.8 | +36.9 | |
| Liberal Democrats | Alan Ketchley | 389 | 20.0 | −30.9 | |
| Labour | Debbie Sharman | 162 | 8.3 | +2.1 | |
| BNP | Barry Bennett | 74 | 3.8 | +3.8 | |
| Majority | 929 | 47.8 | |||
| Turnout | 1,943 | 25.9 | |||
| Conservative gain from Liberal Democrats | Swing | ||||
| Party | Candidate | Votes | % | ±% | |
|---|---|---|---|---|---|
| Conservative | Cheryl Anne Johnson | 910 | 47.6 | −7.3 | |
| Liberal Democrats | Mike Carlile | 466 | 24.4 | −10.6 | |
| UKIP | David Norman Hughes | 175 | 9.1 | +9.1 | |
| Labour Co-op | Mike Goff | 149 | 7.8 | −2.3 | |
| Independent | Chris Mayne | 146 | 7.6 | +7.6 | |
| Liberal | Bill Brandwood | 67 | 3.5 | +3.5 | |
| Majority | 444 | 23.2 | |||
| Turnout | 1,913 | 26.3 | |||
| Conservative hold | Swing | ||||
| Party | Candidate | Votes | % | ±% | |
|---|---|---|---|---|---|
| Conservative | Douglas Lloyd Barton Spencer | 590 | 35.6 | −14.9 | |
| Liberal Democrats | Anson Westbrook | 411 | 24.8 | −3.5 | |
| Labour | Mel Semple | 244 | 14.7 | +3.1 | |
| Independent | Malcolm Kenneth Lock | 132 | 8.0 | −1.7 | |
| Green | Roger Eede | 126 | 7.6 | +7.6 | |
| BNP | Barry John Sinclair Bennett | 104 | 6.3 | +6.3 | |
| UKIP | Sam Whitt | 51 | 3.1 | +3.1 | |
| Majority | 179 | 10.8 | |||
| Turnout | 1,658 | 24.6 | |||
| Conservative hold | Swing | ||||
| Party | Candidate | Votes | % | ±% | |
|---|---|---|---|---|---|
| Conservative | Richard Powell | 1,308 | 51.4 | ||
| Liberal Democrats | Noel Davenport | 567 | 22.3 | ||
| UKIP | Rod Trelease | 360 | 14.1 | ||
| Labour | Jack Killingback | 166 | 6.5 | ||
| Independent | Malcolm John Chapman | 146 | 5.7 | ||
| Majority | 741 | 29.1 | |||
| Turnout | 2,547 | 31.76 | |||
| Conservative hold | Swing | ||||
| Party | Candidate | Votes | % | ±% | |
|---|---|---|---|---|---|
| Conservative | David d’Orton-Gibson | 675 | 26.7 | ||
| Labour | Jo Kennedy | 539 | 21.3 | ||
| Liberal Democrats | Pat Lewis | 424 | 16.8 | ||
| Independent | Claire Smith | 398 | 15.8 | ||
| UKIP | Nicholas Atkinson | 327 | 13.0 | ||
| Green | Sandra Hale | 54 | 2.1 | ||
| Independent | Paul Graham | 51 | 2.0 | ||
| BNP | Colin Smith | 42 | 1.7 | ||
| Independent | Peter Woodley | 15 | 0.6 | ||
| Majority | 136 | 5.4 | |||
| Turnout | 2,525 | 32.77 | |||
| Conservative hold | Swing | ||||
| Party | Candidate | Votes | % | ±% | |
|---|---|---|---|---|---|
| Conservative | Gill Seymour | 810 | 54.0 | ||
| Labour | Debbie Lynn Sharman | 247 | 16.5 | ||
| UKIP | David Norman Hughes | 229 | 15.3 | ||
| Liberal Democrats | Peter David Pull | 214 | 14.3 | ||
| Majority | 563 | 37.5 | |||
| Turnout | 1,500 | 19.98 | |||
| Conservative hold | Swing | ||||
| Party | Candidate | Votes | % | ±% | |
|---|---|---|---|---|---|
| Conservative | Pat Oakley | 503 | 41.8 | ||
| Labour | Mike Goff | 215 | 17.9 | ||
| UKIP | Laurence Fear | 212 | 17.6 | ||
| Liberal Democrats | Matthew Stephen Gillett | 191 | 15.9 | ||
| Green | Sandra Hale | 48 | 4.0 | ||
| Independent | Kathleen Mortimer | 34 | 2.8 | ||
| Turnout | 1,203 | 15.44 | |||
| Conservative hold | Swing | ||||
| Party | Candidate | Votes | % | ±% | |
|---|---|---|---|---|---|
| Conservative | Norman Decent | 520 | |||
| Conservative | Roger Marley | 509 | |||
| Labour | Beryl Baxter | 471 | |||
| Labour | Mel Semple | 371 | |||
| UKIP | Duane Farr | 313 | |||
| Bournemouth Independent Alliance | Philip Davenport | 168 | |||
| Bournemouth Independent Alliance | Roger West | 116 | |||
| Green | Carla Gregory-May | 63 | |||
| Liberal Democrats | Gill Pardy | 61 | |||
| Liberal Democrats | Phil Dunn | 60 | |||
| Green | Geoffrey Darnton | 54 | |||
| Patria | Kevin Dixon | 8 | |||
| Conservative hold | Swing | ||||
| Conservative hold | Swing | ||||
| Party | Candidate | Votes | % | ±% | |
|---|---|---|---|---|---|
| Conservative | John Perkins | 556 | 34.7 | +2.2 | |
| Labour | Dennis Gritt | 517 | 32.2 | +11.2 | |
| UKIP | Duane Farr | 313 | 19.5 | −7.5 | |
| Liberal Democrats | Stephen Plant | 116 | 7.2 | −1.8 | |
| Green | Carla Gregory-May | 102 | 6.4 | −4.0 | |
| Majority | 39 | 2.4 | |||
| Turnout | 1,604 | ||||
| Conservative hold | Swing | ||||
| Party | Candidate | Votes | % | ±% | |
|---|---|---|---|---|---|
| Independent | Kieron Wilson | 533 | 31.3 | +31.3 | |
| Conservative | Hazel Allen | 511 | 30.0 | +0.8 | |
| Labour | Rob Bassinder | 402 | 23.6 | +13.1 | |
| Independent | Peter Lucas | 117 | 6.9 | +6.9 | |
| Liberal Democrats | Muriel Turner | 107 | 6.3 | +6.3 | |
| Green | Jane Bull | 33 | 1.9 | −7.4 | |
| Majority | 22 | 1.3 | |||
| Turnout | 1,703 | ||||
| Independent hold | Swing | ||||
