| ||||||||||||||||||||||||||||
44 seats to West Dorset District Council 22 seats needed for a majority | ||||||||||||||||||||||||||||
---|---|---|---|---|---|---|---|---|---|---|---|---|---|---|---|---|---|---|---|---|---|---|---|---|---|---|---|---|
| ||||||||||||||||||||||||||||
![]() Map showing the results of the 2015 West Dorset District Council elections. | ||||||||||||||||||||||||||||
|
The 2015 West Dorset District Council election was held on Thursday 7 May 2015 to elect councillors to West Dorset District Council in England. It took place on the same day as the general election other district council elections in the United Kingdom. A series of boundary changes saw the number of councillors reduced from 48 to 44. [1]
These were the final elections of the district council, before its abolition on 1 April 2019 when it was merged with the other districts of Dorset and Dorset County Council to form a new unitary authority Dorset Council.
The 2015 election saw the Conservatives maintain majority control of the council taking 30 of the 44 seats up for election.
West Dorset District Council | |||||||||||||||
---|---|---|---|---|---|---|---|---|---|---|---|---|---|---|---|
Party | Candidates | Votes | |||||||||||||
Stood | Elected | Gained | Unseated | Net | % of total | % | No. | Net % | |||||||
Conservative | 39 | 30 | ![]() | 68.2% | 44.6% | 43,608 | ![]() | ||||||||
Liberal Democrats | 34 | 12 | ![]() | 27.3% | 30.1% | 29,432 | ![]() | ||||||||
Green | 27 | 0 | ![]() | 0% | 12.8% | 12,474 | ![]() | ||||||||
Labour | 16 | 0 | ![]() | 0% | 7.7% | 7,569 | ![]() | ||||||||
UKIP | 7 | 0 | ![]() | 0% | 2.6% | 2,561 | ![]() | ||||||||
Independent | 4 | 0 | ![]() | 0% | 2.1% | 2,087 | ![]() |
Party | Candidate | Votes | % | ±% | |
---|---|---|---|---|---|
Conservative | Anthony Paul Robin Alford | 1,393 | 44.0 | +1.2 | |
Conservative | Peter Nathaniel David Barrowcliff | 1,364 | – | ||
Liberal Democrats | Jan Page * | 1,254 | 39.6 | –11.4 | |
Liberal Democrats | Chris Turner | 855 | – | ||
Green | Kerry-Anne Gould | 548 | 13.8 | N/A | |
Turnout | 3,207 | 75.00 | +20.55 | ||
Registered electors | 4,276 | ||||
Conservative gain from Liberal Democrats | Swing | ||||
Conservative gain from Liberal Democrats | Swing |
Party | Candidate | Votes | % | ±% | |
---|---|---|---|---|---|
Liberal Democrats | Ros Kayes * | 1,921 | 47.3 | ||
Conservative | Ronald William Coatsworth * | 1,526 | 37.6 | ||
Conservative | Keith Allan Day * | 1,286 | – | ||
Conservative | Jeremy Patrick Brodie | 1,253 | – | ||
Liberal Democrats | Sarah Anne Horniman | 942 | – | ||
Liberal Democrats | Gill Massey | 830 | – | ||
Green | Julian Stephen Langton | 824 | 20.3 | ||
Labour | Nick Boothroyd | 647 | 15.9 | ||
Labour | Karen Ellis | 509 | – | ||
Labour | Ivan Gollop | 465 | – | ||
Turnout | 4,128 | 66.59 | |||
Registered electors | 6,199 | ||||
Liberal Democrats win (new seat) | |||||
Conservative win (new seat) | |||||
Conservative win (new seat) |
Party | Candidate | Votes | % | ±% | |
---|---|---|---|---|---|
Conservative | Sandra Ann Brown * | 1,577 | 42.4 | ||
Liberal Democrats | Dave Rickard | 1,194 | 32.1 | ||
Conservative | Frances Kathleen McKenzie * | 1,173 | – | ||
Liberal Democrats | Clare Jane Winterbottom | 1,064 | – | ||
Independent | David Robert Tett * | 961 | 24.7 | ||
Green | Kevin Charles Clayton | 795 | 21.4 | ||
Green | Christopher Rakoczi | 650 | – | ||
Labour | Debra Bates | 644 | 17.3 | ||
Liberal Democrats | Clare Jane Winterbottom | 610 | – | ||
Labour | Richard Howard Nicholls | 570 | – | ||
Turnout | 3,773 | 68.99 | |||
Registered electors | 5,469 | ||||
Conservative win (new seat) | |||||
Liberal Democrats win (new seat) | |||||
Conservative win (new seat) |
Party | Candidate | Votes | % | ±% | |
---|---|---|---|---|---|
Conservative | Nigel Paul Bundy | 928 | 41.8 | ||
Conservative | Alan John Thacker * | 688 | – | ||
Liberal Democrats | Nick Ireland | 557 | 25.1 | ||
Liberal Democrats | Gillian Peason | 519 | – | ||
Green | Jo Archer | 280 | 12.6 | ||
Labour | Diana Ruth Staines | 274 | 12.3 | ||
Independent | Philip Howard Scull | 168 | 7.6 | ||
Turnout | 2,221 | 76.06 | |||
Registered electors | 4,367 | ||||
Conservative win (new seat) | |||||
Conservative win (new seat) |
Party | Candidate | Votes | % | ±% | |
---|---|---|---|---|---|
Conservative | Jacqui Sewell * | 922 | 55.2 | –17.7 | |
Liberal Democrats | Edward Gerrard | 314 | 18.8 | –8.3 | |
UKIP | Annemieke Blodeel | 227 | 13.6 | N/A | |
Green | Kit Vaughan | 208 | 12.4 | N/A | |
Majority | 608 | 36.4 | –9.3 | ||
Turnout | 1,687 | 76.89 | +20.02 | ||
Registered electors | 2,194 | ||||
Conservative hold | Swing |
Party | Candidate | Votes | % | ±% | |
---|---|---|---|---|---|
Conservative | John Patrick Russell * | 935 | 54.5 | +4.7 | |
Green | Steve Meek | 392 | 22.8 | +2.1 | |
Liberal Democrats | Terry Harrison | 390 | 22.7 | –6.8 | |
Majority | 543 | 31.6 | +11.3 | ||
Turnout | 1,743 | 79.84 | +16.40 | ||
Registered electors | 2,183 | ||||
Conservative hold | Swing |
Party | Candidate | Votes | % | ±% | |
---|---|---|---|---|---|
Conservative | Fred Horsington | 1,502 | 48.9 | ||
Conservative | Timothy John Yarker | 1,398 | – | ||
Liberal Democrats | Iain Douglas Young | 787 | 25.6 | ||
Liberal Democrats | Jillian Annas Mahler | 720 | – | ||
Green | Anne Clements | 643 | 20.9 | ||
Labour | Lynda Ann Kiss | 509 | 16.6 | ||
Turnout | 3,115 | 75.15 | |||
Registered electors | 4,145 | ||||
Conservative win (new seat) | |||||
Conservative win (new seat) |
Party | Candidate | Votes | % | ±% | |
---|---|---|---|---|---|
Conservative | Jean Dunseith * | 1,889 | 48.2 | ||
Conservative | Tom Bartlett * | 1,734 | – | ||
Conservative | Ian Charles Gardner * | 1,711 | – | ||
Liberal Democrats | Ryan Dean Hope | 1,039 | 26.5 | ||
Green | Vaughan Jones | 986 | 25.2 | ||
Labour | Robert William Kiss | 975 | 24.9 | ||
Turnout | 3,977 | 70.15 | |||
Registered electors | 5,669 | ||||
Conservative win (new seat) | |||||
Conservative win (new seat) |
Party | Candidate | Votes | % | ±% | |
---|---|---|---|---|---|
Conservative | Simon John Christopher | 823 | 56.4 | –3.6 | |
Green | Yen C Chong | 349 | 23.9 | N/A | |
Liberal Democrats | Philip Colfox | 318 | 21.8 | –18.2 | |
Majority | 474 | 32.5 | +12.4 | ||
Turnout | 1,483 | 73.42 | +20.84 | ||
Registered electors | 2,020 | ||||
Conservative hold | Swing |
Party | Candidate | Votes | % | ±% | |
---|---|---|---|---|---|
Liberal Democrats | Stella Jones * | 1,223 | 48.8 | –9.6 | |
Liberal Democrats | Timothy Harries * | 971 | – | ||
Conservative | Liz Godolphin | 752 | 30.0 | +3.3 | |
Green | Jenny Shackleford | 511 | 20.4 | N/A | |
Labour | Barry Thompson | 508 | 20.3 | –1.0 | |
Green | Len Herbert | 372 | – | ||
Turnout | 2,549 | 67.42 | +17.74 | ||
Registered electors | 3,781 | ||||
Liberal Democrats hold | Swing | ||||
Liberal Democrats hold | Swing |
Party | Candidate | Votes | % | ±% | |
---|---|---|---|---|---|
Liberal Democrats | Andy Canning * | 1,042 | 35.6 | ||
Liberal Democrats | Susie Hosford * | 868 | – | ||
Liberal Democrats | David Taylor | 806 | |||
Independent | Alistair Fraser Chisholm * | 762 | 26.1 | ||
Conservative | Ian Francois Bernard Gosling | 722 | 24.7 | ||
Conservative | Margaret Morrissey | 718 | – | ||
Conservative | Warwick Harry Taylor | 646 | – | ||
Labour | Claudia Catherine Sorin | 493 | 16.9 | ||
UKIP | Geoffrey Robin Markham | 455 | 15.6 | ||
Green | Vicki Waddington-Black | 422 | 14.4 | ||
Green | Libby Goodchild | 416 | – | ||
Green | Murray David Shackleford | 309 | – | ||
Turnout | 2,941 | 66.63 | |||
Registered electors | 4,414 | ||||
Liberal Democrats win (new seat) | |||||
Liberal Democrats win (new seat) |
Party | Candidate | Votes | % | ±% | |
---|---|---|---|---|---|
Liberal Democrats | Molly Rennie * | 1,302 | 48.2 | –12.4 | |
Liberal Democrats | Robert Potter * | 1,007 | – | ||
Conservative | Antony Gilbert Butler Stanley | 786 | 29.1 | +0.2 | |
Labour | Frances Thorpe Anderson | 454 | 16.8 | –9.1 | |
UKIP | Neale Hallett | 434 | 16.1 | N/A | |
Green | Kate Penelope Forrester | 421 | 15.6 | N/A | |
Green | Mark Stephen Smith | 300 | – | ||
Turnout | 2,726 | 76.08 | +19.53 | ||
Registered electors | 3,853 | ||||
Liberal Democrats hold | Swing | ||||
Liberal Democrats hold | Swing |
Party | Candidate | Votes | % | ±% | |
---|---|---|---|---|---|
Liberal Democrats | David Trevor Jones * | 1,152 | 45.3 | –5.9 | |
Conservative | Gerald Edward Barnaby Duke | 725 | 28.5 | +8.2 | |
Liberal Democrats | Roland Garth Tarr | 702 | – | ||
Conservative | Peter Jonathon Stein | 684 | – | ||
Labour | Lee Rhodes | 676 | 26.6 | +8.3 | |
Green | Judith Caroline Edwards | 577 | 22.7 | N/A | |
Turnout | 2,546 | 67.95 | +17.31 | ||
Registered electors | 3,747 | ||||
Liberal Democrats hold | Swing | ||||
Conservative gain from Independent | Swing |
Party | Candidate | Votes | % | ±% | |
---|---|---|---|---|---|
Conservative | Mary Penfold * | 1,099 | 72.2 | +2.2 | |
Green | Rebekah Webb | 424 | 27.8 | –2.2 | |
Majority | 675 | 44.3 | +4.3 | ||
Turnout | 1,546 | 78.42 | +18.11 | ||
Registered electors | 1,974 | ||||
Conservative hold | Swing |
Party | Candidate | Votes | % | ±% | |
---|---|---|---|---|---|
Conservative | George Jacob Symonds * | 1,470 | 50.3 | ||
Conservative | Daryl Whane Turner * | 1,461 | – | ||
Liberal Democrats | Janice Ruth Gale | 836 | 28.6 | ||
Green | Matthew Daniel Holborow | 606 | 20.7 | ||
Liberal Democrats | Stephen William Trevethan | 551 | – | ||
Independent | Stephen Leonard Miller | 196 | 6.7 | ||
Turnout | 2,968 | 72.34 | |||
Registered electors | 4,103 | ||||
Conservative win (new seat) | |||||
Conservative win (new seat) |
Party | Candidate | Votes | % | ±% | |
---|---|---|---|---|---|
Conservative | Gill Haynes * | 940 | 60.6 | +4.2 | |
Green | Benjamin Tyler | 375 | 24.2 | N/A | |
Labour Co-op | Geoff Freeman | 237 | 15.3 | –5.0 | |
Majority | 565 | 36.4 | +3.4 | ||
Turnout | 1,580 | 75.31 | +18.38 | ||
Registered electors | 2,098 | ||||
Conservative hold | Swing |
Party | Candidate | Votes | % | ±% | |
---|---|---|---|---|---|
Conservative | Mark Brandon Roberts * | 919 | 57.4 | +2.3 | |
Liberal Democrats | Anthea Carol Bay | 406 | 25.4 | –19.5 | |
Green | Richard Edwards | 275 | 17.2 | N/A | |
Majority | 513 | 32.1 | +22.0 | ||
Turnout | 1,618 | 74.84 | +35.14 | ||
Registered electors | 2,162 | ||||
Conservative hold | Swing |
Party | Candidate | Votes | % | ±% | |
---|---|---|---|---|---|
Conservative | Peter John Hiscock | 1,095 | 68.8 | –7.2 | |
Green | Hilary Woodall | 315 | 19.8 | N/A | |
Labour | David John Marriott | 182 | 11.4 | –12.6 | |
Majority | 780 | 49.0 | –3.0 | ||
Turnout | 1,614 | 74.24 | +16.59 | ||
Registered electors | 2,174 | ||||
Conservative hold | Swing |
Party | Candidate | Votes | % | ±% | |
---|---|---|---|---|---|
Conservative | Patrick Cooke * | 893 | 57.1 | +6.0 | |
Liberal Democrats | Mel Lane | 300 | 19.2 | –12.5 | |
Labour | Tony Gould | 220 | 14.1 | –3.1 | |
Green | Caspar Edward Hulacki | 150 | 9.6 | N/A | |
Majority | 593 | 37.9 | +18.5 | ||
Turnout | 1,573 | 83.58 | +27.63 | ||
Registered electors | 2,053 | ||||
Conservative hold | Swing |
Party | Candidate | Votes | % | ±% | |
---|---|---|---|---|---|
Conservative | Robert Andrew Gould * | 1,017 | 67.0 | –8.4 | |
UKIP | Peter Jenkins | 274 | 18.2 | N/A | |
Green | Natalie Jane Miles | 226 | 14.9 | N/A | |
Majority | 743 | 49.0 | –1.8 | ||
Turnout | 1,524 | 75.11 | +17.26 | ||
Registered electors | 2,029 | ||||
Conservative hold | Swing |
Party | Candidate | Votes | % | ±% | |
---|---|---|---|---|---|
Conservative | Dominic Charles Elliott * | 1,214 | 45.0 | –2.7 | |
Conservative | Terence Peter Falmer * | 1,119 | – | ||
Liberal Democrats | Guy Justin Patterson | 871 | 32.3 | +5.2 | |
Green | Susan Greene | 802 | 29.7 | +13.9 | |
UKIP | David Platt | 530 | 19.7 | +6.2 | |
Turnout | 2,722 | 68.78 | +17.81 | ||
Registered electors | 3,959 | ||||
Conservative hold | Swing | ||||
Conservative hold | Swing |
Party | Candidate | Votes | % | ±% | |
---|---|---|---|---|---|
Liberal Democrats | Matthew Nathan William Hall | 927 | 42.4 | +14.0 | |
Conservative | Peter Robert Shorland * | 881 | 40.3 | –10.2 | |
Conservative | Chris Shaw | 831 | – | ||
Liberal Democrats | Jan Palmer | 792 | – | ||
UKIP | Christopher Binding | 410 | 18.8 | +3.4 | |
Turnout | 2,238 | 68.71 | +18.37 | ||
Registered electors | 3,257 | ||||
Liberal Democrats gain from Conservative | Swing | ||||
Conservative hold | Swing |
Party | Candidate | Votes | % | ±% | |
---|---|---|---|---|---|
Conservative | Robert Philip Freeman | 666 | 47.5 | N/A | |
Green | Matthew James McCourtie | 298 | 21.3 | N/A | |
UKIP | Graham Richard Brant | 231 | 16.5 | N/A | |
Labour | Hazel Jean Gant | 206 | 14.7 | –9.0 | |
Majority | 368 | 26.3 | N/A | ||
Turnout | 1,409 | 71.56 | +21.44 | ||
Registered electors | 1,969 | ||||
Conservative gain from Independent | Swing |
Party | Candidate | Votes | % | ±% | |
---|---|---|---|---|---|
Conservative | Margaret Rose Lawrence * | 1,497 | 50.8 | ||
Liberal Democrats | Robin Andrew Shane Legg * | 1,374 | 46.6 | ||
Conservative | Christopher Lionel John Loder * | 1,371 | – | ||
Liberal Democrats | Michael John Sandy | 988 | – | ||
Turnout | 2,987 | 78.11 | |||
Registered electors | 3,824 | ||||
Conservative win (new seat) | |||||
Liberal Democrats win (new seat) |
A by-election was held for the Piddle Valley ward of West Dorset County Council on 13 April 2017 following the resignation of Conservative councillor Peter Hiscock.
Party | Candidate | Votes | % | ±% | |
---|---|---|---|---|---|
Conservative | Brian Haynes | 303 | 60.8 | –8.0 | |
Green | Carol Rosemary Byrom | 195 | 39.2 | +19.4 | |
Majority | 108 | 21.6 | –27.4 | ||
Turnout | 498 | 23.74 | –50.50 | ||
Registered electors | 2,098 | ||||
Conservative hold | Swing |
A by-election was held for one of the two seats in the Lyme Regis & Charmouth ward of West Dorset County Council on 14 September 2017 following the resignation of Conservative councillor George Symonds. [3]
Party | Candidate | Votes | % | ±% | |
---|---|---|---|---|---|
Independent | Cheryl Lesley Reynolds | 622 | 52.3 | N/A | |
Conservative | Paul Ronald Oatway | 396 | 33.3 | –17.0 | |
Labour | Belinda Bawden | 171 | 14.4 | N/A | |
Majority | 226 | 19.0 | N/A | ||
Turnout | 1,189 | 28.9 | |||
Independent gain from Conservative | Swing |
A by-election was held for one of the three seats in the Bridport North ward of West Dorset County Council on 22 February 2018 following the resignation of Liberal Democrat councillor Ros Kayes. [4]
Party | Candidate | Votes | % | ±% | |
---|---|---|---|---|---|
Conservative | Derek Bussell | 600 | 36.0 | +5.0 | |
Liberal Democrats | Sarah Williams | 500 | 30.0 | −9.1 | |
Labour | Phyllida Culpin | 383 | 23.0 | +9.8 | |
Green | Julian Jones | 184 | 11.0 | −5.8 | |
Majority | 100 | 6.0 | |||
Turnout | 1,667 | ||||
Conservative gain from Liberal Democrats | Swing |
Dorset is a ceremonial county in South West England. It is bordered by Somerset to the north-west, Wiltshire to the north and the north-east, Hampshire to the east, the Isle of Wight across the Solent to the south-east, the English Channel to the south, and Devon to the west. The largest settlement is Bournemouth, and the county town is Dorchester.
West Dorset was a local government district in Dorset, England. The district was formed on 1 April 1974 under the Local Government Act 1972, and was a merger of the boroughs of Bridport, Dorchester and Lyme Regis, along with Sherborne urban district and the rural districts of Beaminster, Bridport, Dorchester and Sherborne. Its council was based in Dorchester.
South Dorset is a constituency represented in the House of Commons of the UK Parliament since 2024 by Lloyd Hatton, of the Labour Party.
West Dorset is a constituency represented in the House of Commons of the UK Parliament since 2024 by Edward Morello, a Liberal Democrat.
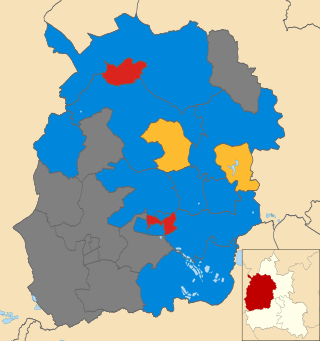
One third of Daventry District Council in Northamptonshire, England was elected each year, followed by one year when there was an election to Northamptonshire County Council instead. Since the last boundary changes in 1999, 38 councillors were elected from 24 wards. In another boundary review in 2012 the councillors were reduced to 36 councillors across 16 wards. The council was abolished in 2021, with the area becoming part of West Northamptonshire.
Weymouth and Portland Borough Council in Dorset, England existed from 1974 to 2019. One-third of the council was elected each year, followed by one year where there was an election to Dorset County Council instead. The council was abolished and subsumed into Dorset Council in 2019.
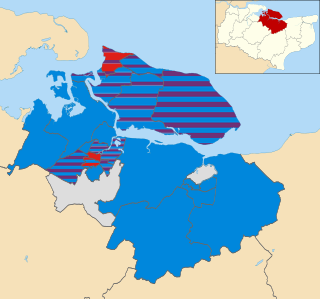
An election to Dorset County Council took place on 2 May 2013 as part of the United Kingdom local elections. 45 councillors were elected from 42 electoral divisions, which returned either one or two county councillors each by first-past-the-post voting for a four-year term of office. The electoral divisions were the same as those used at the previous election in 2009. No elections were held in Bournemouth or Poole, which are unitary authorities outside the area covered by the County Council. The election saw the Conservative Party maintain overall control of the council.
The 2014 Westminster City Council election took place on 22 May 2014 to elect members of Westminster City Council in England. This was on the same day as other local elections.
An election was held to Swale Borough Council in England as part of the United Kingdom local elections on 7 May 2015. All 47 seats were up for election under new ward boundaries.
The 2015 East Dorset District Council election took place on 7 May 2015 in order to elect members of the East Dorset District Council in Dorset, England. The whole council was up for election after boundary changes reduced the number of seats by seven. The Conservative Party stayed in overall control of the council.
The 2003 Christchurch Borough Council election took place on 1 May 2003 to elect members of Christchurch Borough Council in Dorset, England. The whole council was up for election after boundary changes reduced the number of seats by one. The Conservative Party stayed in overall control of the council.
The 2007 Christchurch Borough Council election took place on 3 May 2007 to elect members of Christchurch Borough Council in Dorset, England. The whole council was up for election and the Conservative party stayed in overall control of the council.
The 2012 West Oxfordshire District Council election took place on 3 May 2012 to elect members of West Oxfordshire District Council in Oxfordshire, England. One third of the council was up for election and the Conservative Party stayed in overall control of the council.
The 2015 North Hertfordshire Council election was held on 5 May 2016, at the same time as other local elections across England. Of the 49 seats on North Hertfordshire District Council, 15 were up for election.
The 2017 Dorset County Council election took place on 4 May 2017 as part of the 2017 local elections in the United Kingdom. All 46 councillors were elected from 40 electoral divisions, which returned either one or two county councillors each by first-past-the-post voting for a four-year term of office.
The 2019 United Kingdom local elections took place on Thursday 2 May 2019, with 248 English local councils, six directly elected mayors in England, and all 11 local councils in Northern Ireland being contested.
The 2019 Dorset Council election was held on Thursday 2 May 2019 to elect councillors to the new Dorset Council in England. It took place on the same day as other district council elections in the United Kingdom.
The Alliance for Local Living (ALL) was a minor localist party and political group based in Dorset, with separate branches in the two authorities, ALL for Bournemouth, Christchurch and Poole and ALL for Dorset. The BCP office was based in Poole, whilst the Dorset office was based in Weymouth. The party was deregistered in November 2023, at which point it had four councillors on Dorset Council, who continued to sit together as an informal grouping. The group became Independents for Dorset in 2024.
Lyme and Charmouth is an electoral ward in Dorset. Since 2019, the ward has elected 1 councillor to Dorset Council.