2019 Broadland District Council election

Last updated

2019 Broadland District Council election
Flag of Norfolk.svg
  2015 2 May 2019 (2019-05-02) 2023  

All 47 seats to Broadland District Council
24 seats needed for a majority
 First partySecond partyThird party
  No image wide.svg No image wide.svg No image wide.svg
Party Conservative Liberal Democrats Labour
Last election43 seats, 49.7%4 seats, 19.1%0 seats, 18.9%
Seats won33122
Seat changeDecrease2.svg 10Increase2.svg 8Increase2.svg 2
Popular vote28,12116,90412,592
Percentage45.9%27.6%20.6%
SwingDecrease2.svg 3.8%Increase2.svg 8.5%Increase2.svg 1.7%

Broadland UK ward map 2019.svg
Winner of each seat at the 2019 Broadland District Council election

Council control before election


Conservative

Council control after election


Conservative

The 2019 Broadland District Council election took place on 2 May 2019 to elect members of the Broadland District Council in England. [1] They were held on the same day as other local elections.

Contents

Summary

Election result

2019 Broadland District Council election
PartySeatsGainsLossesNet gain/lossSeats %Votes %Votes+/−
  Conservative 33010Decrease2.svg1070.245.928,121–3.8
  Liberal Democrats 1280Increase2.svg825.527.616,904+8.5
  Labour 220Increase2.svg24.320.612,592+1.7
  Green 000Steady2.svg0.04.42,713+3.5
  Independent 000Steady2.svg0.00.9562+0.2
  UKIP 000Steady2.svg0.00.5323–10.3

Ward results

Acle

Acle
PartyCandidateVotes%±%
Conservative Lana Hampsall 422 53.1 -1.6
Labour Tony Hemmingway24330.6+7.5
Liberal Democrats James Barker13016.4N/A
Turnout 79535.4
Conservative hold Swing

Aylsham

Aylsham
PartyCandidateVotes%±%
Liberal Democrats Sue Catchpole 1,479 61.8
Liberal Democrats David Harrison 1,409 58.9
Liberal Democrats Steve Riley 1,126 47.1
Conservative Jonathan Wilton73830.9
Independent Lloyd Mills42217.6
Labour Peter Harwood26010.9
Labour Philip Williams2329.7
Turnout 2,39235.6
Liberal Democrats gain from Conservative
Liberal Democrats hold
Liberal Democrats gain from Conservative

Blofield with South Walsham

Blofield with South Walsham
PartyCandidateVotes%±%
Conservative Nigel Brennan 788 51.6
Conservative Justine Thomas 747 48.9
Liberal Democrats Malcolm Prior46330.3
Labour Claire Lees39125.6
Labour Glenn Springett28318.5
Turnout 1,52832.1
Conservative hold
Conservative hold

Brundall

Brundall
PartyCandidateVotes%±%
Conservative Michael Snowling 814 45.8
Conservative Rebecca Grattan 720 40.5
Labour Alice Free44124.8
Green Jan Davis42724.0
Labour Marianne Gibbs38521.7
Liberal Democrats Eleanor Mason30417.1
Green Caroline Fernandez29516.6
Turnout 1,77736.9
Conservative hold
Conservative hold

Burlingham

Burlingham
PartyCandidateVotes%±%
Conservative Clare Ryman-Tubb 213 33.8 -12.8
Independent Glenn Tingle14022.2N/A
Labour Christopher Jones11818.7-7.3
Green Lynn Smithdale8112.8N/A
Liberal Democrats Deanne Thomas7912.5+2.9
Turnout 63129.8
Conservative hold Swing

Buxton

Buxton
PartyCandidateVotes%±%
Liberal Democrats Karen Lawrence 305 45.4 +11.7
Conservative Tim Catmull30345.1+13.6
Labour Stephen McNair649.5-0.5
Turnout 67233.1
Liberal Democrats hold Swing

Coltishall

Coltishall
PartyCandidateVotes%±%
Conservative Jo Copplestone 374 56.3 +2.1
Labour Campbell Jones16324.4+2.9
Liberal Democrats Sarah Crane12819.3+7.9
Turnout 66531.9
Conservative hold Swing

Drayton North

Drayton North
PartyCandidateVotes%±%
Conservative Adrian Crotch 301 56.8 +7.2
Liberal Democrats Ian Leach26543.2+13.3
Turnout 61327.8
Conservative hold Swing

Drayton South

Drayton South
PartyCandidateVotes%±%
Conservative Roger Foulger 403 58.9 +2.1
Liberal Democrats Fran Cawdron16524.1-0.4
Labour Christine Hemmingway11617.0N/A
Turnout 68434.6
Conservative hold Swing

Eynesford

Eynesford
PartyCandidateVotes%±%
Conservative Greg Peck 374 47.1 +5.9
Liberal Democrats Dota Williams29637.3-0.8
Labour Jo Emmerson12415.6N/A
Turnout 79431.8
Conservative hold Swing

Great Witchingham

Great Witchingham
PartyCandidateVotes%±%
Conservative Peter Bulman 317 45.7 -4.7
Labour Ruth Goodall21931.6+5.7
Liberal Democrats Cameron Phillips15722.7-1.0
Turnout 69332.8
Conservative hold Swing

Hellesdon North

Hellesdon North
PartyCandidateVotes%±%
Conservative Shelagh Gurney 688 53.8
Conservative David King 536 41.9
Labour Bibin Baby32425.3
Liberal Democrats Peter Balcombe24519.2
Labour Antony Crush23918.7
Green Kenneth Parsons18614.5
Liberal Democrats Jean Markwell1269.9
Turnout 1,27928.1
Conservative hold
Conservative hold

Hellesdon South East

Hellesdon South East
PartyCandidateVotes%±%
Conservative Sue Prutton 474 39.5
Liberal Democrats David Britcher 437 36.4
Conservative Bill Johnson41234.3
Liberal Democrats Victor Scrivens25521.2
Labour Ian Duckett24820.6
Labour Annie Thompson21618.0
Green Gil Murray16113.4
Turnout 1,20129.0
Conservative hold
Liberal Democrats gain from Conservative

Hevingham

Hevingham
PartyCandidateVotes%±%
Liberal Democrats Julie Neesam 382 52.3 +29.8
Conservative Paul Carrick27137.1-14.6
Labour David Heywood7810.7N/A
Turnout 73132.5
Liberal Democrats gain from Conservative Swing

Horsford and Felthorpe

Horsford and Felthorpe
PartyCandidateVotes%±%
Liberal Democrats Lisa Starling 799 67.1
Liberal Democrats Dave Thomas 657 55.2
Conservative Joanne Keeler29724.9
Conservative David Willmott29024.3
Labour Sebastian Loxton1159.7
Turnout 1,19129.9
Liberal Democrats gain from Conservative

Marshes

Marshes
PartyCandidateVotes%±%
Conservative Grant Nurden 426 53.8 +6.1
Labour Julie Williams18623.5+1.5
Liberal Democrats Allison Barker18022.7+11.8
Turnout 79232.6
Conservative hold Swing

Old Catton and Sprowston West

Old Catton and Sprowston West
PartyCandidateVotes%±%
Conservative Karen Vincent 1,024 49.7
Conservative Ken Leggett 985 47.8
Conservative Samuel Walker 962 46.7
Liberal Democrats Bob Fowkes43321.0
Liberal Democrats Martin Callam42520.6
Labour Jan Hooks40119.5
Labour Sarah Taylor39819.3
Labour Barrie Osborne35117.0
Green Kahn Johnson34416.7
Liberal Democrats Thomas Maxwell23611.5
Turnout 2,06131.2
Conservative hold
Conservative hold
Conservative hold

Plumstead

Plumstead
PartyCandidateVotes%±%
Conservative Shaun Vincent 435 51.3 +0.5
Green Andrew Cawdron41348.7+27.6
Turnout 84833.4
Conservative hold Swing

Reepham

Reepham
PartyCandidateVotes%±%
Liberal Democrats Stuart Beadle 386 42.8 +2.9
Conservative Graham Everett30533.9-11.5
Green Sarah Morgan15517.2N/A
Labour Jonathan Rackham556.1N/A
Turnout 90142.7
Liberal Democrats gain from Conservative Swing

Spixworth with St. Faiths

Spixworth with St. Faiths
PartyCandidateVotes%±%
Liberal Democrats Dan Roper 849 64.1
Liberal Democrats Susan Holland 679 51.3
Conservative Lawrence Hill33525.3
Conservative Stuart Dunn33325.2
Labour Bill Couzens1269.5
Labour Brenda Jones1098.2
Turnout 1,32430.1
Liberal Democrats hold

Sprowston Central

Sprowston Central
PartyCandidateVotes%±%
Labour Breanne Cook 713 48.1
Labour Natasha Harpley 615 41.5
Conservative Robin Knowles55237.3
Conservative Peter Berry48732.9
UKIP John Gilson18912.8
Liberal Democrats Bali Kular1349.0
Turnout 1,48135.0
Labour gain from Conservative

Sprowston East

Sprowston East
PartyCandidateVotes%±%
Conservative Ian Moncur 1,131 56.3
Conservative Judy Leggett 996 49.6
Conservative John Ward 943 47.0
Labour Chrissie Rumsby56728.2
Labour Harvey Tarlton49724.8
Labour Alan Pawsey45922.9
Liberal Democrats Sam Sirdar36418.1
Liberal Democrats Audrey Elliott27113.5
Liberal Democrats Jane Wright26012.9
Turnout 2,00830.5
Conservative hold
Conservative hold
Conservative hold

Taverham North

Taverham North
PartyCandidateVotes%±%
Conservative Tony Adams 469 43.9
Liberal Democrats Caroline Karimi-Ghovanlou 405 37.9
Conservative Richard Gill37535.1
Liberal Democrats Veronica Beadle32830.7
Labour Louise Baldry23021.5
Labour Trevor Turk19218.0
Turnout 1,06827.3
Conservative hold
Liberal Democrats gain from Conservative

Taverham South

Taverham South
PartyCandidateVotes%±%
Conservative Stuart Clancy 851 67.4
Conservative Ken Kelly 658 52.1
Liberal Democrats Shirley Clayton20716.4
Liberal Democrats Malcolm Clayton19115.1
Labour Neil Brummage18114.3
Labour Mo Steel16112.8
Turnout 1,26235.2
Conservative hold
Conservative hold

Thorpe St. Andrew North West

Thorpe St. Andrew North West
PartyCandidateVotes%±%
Conservative John Fisher 1,184 55.5
Conservative Ian Mackie 1,068 50.1
Conservative Nigel Shaw 1,042 48.9
Labour Sue Wright61228.7
Labour Anne Roderick60128.2
Labour Alan Wright60128.2
Liberal Democrats Brian Howe31314.7
Liberal Democrats Jon Goodwin30914.5
Liberal Democrats Amy Jenkins30214.2
Turnout 2,13236.0
Conservative hold
Conservative hold
Conservative hold

Thorpe St. Andrew South East

Thorpe St. Andrew South East
PartyCandidateVotes%±%
Conservative Jonathan Emsell 1,019 54.7
Conservative Susan Lawn 1,008 54.1
Conservative Trudy Mancini-Boyle 873 46.9
Labour Terry Phillips38020.4
Labour Nick Williams36019.3
Labour Gary Tibbitts35819.2
Green Spencer Groombridge29715.9
Liberal Democrats Phyllida Scrivens29315.7
Green Kate Rhind28515.3
Liberal Democrats Malcolm Martins28215.1
Liberal Democrats Grant Turner24213.0
Turnout 1,86334.3
Conservative hold
Conservative hold
Conservative hold

Wroxham

Wroxham
PartyCandidateVotes%±%
Conservative Fran Whymark 585 46.3
Conservative Martin Murrell 546 43.2
Liberal Democrats Stephen Heard32725.9
Liberal Democrats Linda Aspland28122.2
Green Nick Ball16012.7
UKIP Craig Dimbleby13410.6
Labour Malcolm Kemp1018.0
Green Delyth Crook957.5
Labour Julia Wheeler796.3
Turnout 1,26430.2
Conservative hold
Conservative hold

By-elections

Brundall

Brundall: 28 September 2021
PartyCandidateVotes%±%
Green Jan Davis 594 37.7 +13.7
Green Eleanor Laming 530 33.6 +17.0
Conservative Tim Catmull48030.4-15.4
Conservative Michael Phelps45328.7-11.8
Liberal Democrats Eleanor Mason42526.9+9.8
Liberal Democrats Victor Scrivens30319.2N/A
Labour Alice Free16110.2-14.6
Labour Glenn Springett1378.7-13.0
Turnout 1,57932.2-4.7
Green gain from Conservative

Old Catton & Sprowston West

Old Catton & Sprowston West: 28 September 2021
PartyCandidateVotes%±%
Conservative Richard Potter 721 50.0 +3.3
Labour Martin Booth33223.0+3.5
Liberal Democrats John Chettleburgh27819.3-1.7
Green Ian Chapman1107.6-9.1
Majority38927.0
Turnout 1,44921.9-9.3
Conservative hold Swing

Thorpe St. Andrew North West

Thorpe St. Andrew North West: 20 October 2022
PartyCandidateVotes%±%
Labour Calix Eden 860 51.8 +22.8
Conservative Peter Berry63538.3-17.9
Liberal Democrats Brian Howe1659.9-4.9
Majority22513.5
Turnout 1,66027.9
Labour gain from Conservative Swing Increase2.svg20.4

Related Research Articles

<span class="mw-page-title-main">South Norfolk</span> District in England

South Norfolk is a local government district in Norfolk, England. Its council is based in the Horizon Building at Broadland Business Park near Norwich, in the Broadland district area, following a move in early 2023 from the previous headquarters in Long Stratton. The population of the Local Authority District was 124,012 as taken at the 2011 Census.

<span class="mw-page-title-main">Broadland</span> Non-metropolitan district in England

Broadland is a local government district in Norfolk, England, named after the Norfolk Broads. The population of the local authority district taken at the 2011 Census was 124,646. Its council is based in Thorpe St Andrew.

<span class="mw-page-title-main">Norwich North (UK Parliament constituency)</span> Parliamentary constituency in the United Kingdom, 1950 onwards

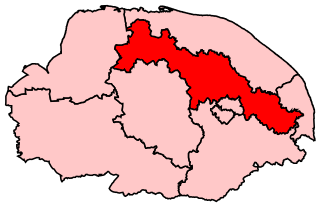
Norwich North is a constituency represented in the House of Commons of the UK Parliament since 2009 by Conservative Chloe Smith.

<span class="mw-page-title-main">Mid Norfolk (UK Parliament constituency)</span> Parliamentary constituency in the United Kingdom, 1983 onwards

Mid Norfolk is a constituency represented in the House of Commons of the UK Parliament since 2010 by George Freeman, a Conservative.

Broadland District Council in Norfolk, England is elected every four years. Up until 2004 one third of the Council was elected each year, followed by one year without election. Since the last boundary changes in 2004, 47 councillors have been elected from 27 wards.

<span class="mw-page-title-main">Broadland (UK Parliament constituency)</span> UK Parliament constituency in England since 2010

Broadland is a Norfolk constituency, which has been represented in parliament since the 2019 general election by Jerome Mayhew, a Conservative.

The 2015 Broadland District Council election took place on 7 May 2015 to elect members of the Broadland District Council in England. They were held on the same day as other local elections.

<span class="mw-page-title-main">Norfolk Police and Crime Commissioner</span>

The Norfolk Police and Crime Commissioner is the police and crime commissioner, an elected official tasked with setting out the way crime is tackled by Norfolk Police in the English County of Norfolk. The post was created in November 2012, following an election held on 15 November 2012, and replaced the Norfolk Police Authority. The current incumbent is Giles Orpen-Smellie, who represents the Conservative Party.

The 1991 Broadland District Council election took place on 2 May 1991 to elect members of Broadland District Council in England. This was on the same day as other local elections.

The 1992 Broadland District Council election took place on 7 May 1992 to elect members of Broadland District Council in England. This was on the same day as other local elections.

The 1994 Broadland District Council election took place on 5 May 1994 to elect members of Broadland District Council in England. This was on the same day as other local elections.

The 1995 Broadland District Council election took place on 4 May 1995 to elect members of Broadland District Council in England. This was on the same day as other local elections.

The 1996 Broadland District Council election took place on 2 May 1996 to elect members of Broadland District Council in England. This was on the same day as other local elections.

The 1998 Broadland District Council election took place on 7 May 1998 to elect members of Broadland District Council in England. This was on the same day as other local elections.

The 1999 Broadland District Council election took place on 6 May 1999 to elect members of Broadland District Council in England. This was on the same day as other local elections.

The 2000 Broadland District Council election took place on 4 May 2000 to elect members of Broadland District Council in England. This was on the same day as other local elections.

The 2002 Broadland District Council election took place on 2 May 2002 to elect members of Broadland District Council in England. This was on the same day as other local elections.

The 2003 Broadland District Council election took place on 1 May 2003 to elect members of Broadland District Council in England. This was on the same day as other local elections.

The 2004 Broadland District Council election took place on 10 June 2004 to elect members of Broadland District Council in England. This was on the same day as other local elections.

The 2007 Broadland District Council election took place on 3 May 2007 to elect members of Broadland District Council in England. This was on the same day as other local elections.

References

  1. Broadland District Council. "District Election Results by Ward May 2019". Archived from the original on 6 June 2020.