This article needs additional citations for verification .(July 2021) |
The 2000 Norwich City Council election took place on 4 May 2000 to elect members of Norwich City Council in England. This was on the same day as other local elections. 16 of 48 seats (one-third) were up for election.
2000 Norwich City Council election [1] | ||||||||||
---|---|---|---|---|---|---|---|---|---|---|
Party | This election | Full council | This election | |||||||
Seats | Net | Seats % | Other | Total | Total % | Votes | Votes % | +/− | ||
Labour | 5 | 7 | 31.3 | 21 | 26 | 54.2 | 8,322 | 30.2 | -9.1 | |
Liberal Democrats | 10 | 6 | 62.5 | 11 | 21 | 43.8 | 11,638 | 42.3 | +4.9 | |
Conservative | 1 | 1 | 6.3 | 0 | 1 | 2.1 | 5,787 | 21.0 | +1.7 | |
Green | 0 | 0.0 | 0 | 0 | 0.0 | 1,472 | 5.3 | +2.6 | ||
Independent | 0 | 0.0 | 0 | 0 | 0.0 | 290 | 1.1 | -0.1 | ||
Natural Law | 0 | 0.0 | 0 | 0 | 0.0 | 9 | <0.1 | -0.1 |
Party | Candidate | Votes | % | ±% | |
---|---|---|---|---|---|
Labour | B. Ferris | 1,009 | 38.3 | -19.5 | |
Liberal Democrats | A. Barber | 867 | 32.9 | +8.5 | |
Conservative | K. Howlett | 539 | 20.5 | +2.7 | |
Green | S. Ronneke | 119 | 4.5 | N/A | |
Independent | H. Robertson | 100 | 3.8 | N/A | |
Majority | 142 | 5.4 | -28.1 | ||
Turnout | 2,634 | 31.0 | +12.7 | ||
Labour hold | Swing | 14.0 | |||
Party | Candidate | Votes | % | ±% | |
---|---|---|---|---|---|
Labour | B. Morrey | 643 | 37.7 | -12.7 | |
Conservative | P. Kearney | 524 | 30.7 | +6.1 | |
Liberal Democrats | P. Kendrick | 383 | 22.5 | +4.7 | |
Green | B. Matthews | 78 | 4.6 | +0.9 | |
Independent | T. Smith | 78 | 4.6 | N/A | |
Majority | 119 | 7.0 | -18.8 | ||
Turnout | 1,706 | 31.8 | +10.7 | ||
Labour hold | Swing | 9.4 | |||
Party | Candidate | Votes | % | ±% | |
---|---|---|---|---|---|
Labour | R. Britt | 606 | 43.0 | -3.0 | |
Conservative | E. Collishaw | 447 | 31.7 | +7.6 | |
Liberal Democrats | C. Risebrook | 260 | 18.4 | +3.5 | |
Green | Rupert Read | 97 | 6.9 | -3.2 | |
Majority | 159 | 11.3 | — | ||
Turnout | 1,410 | 24.2 | -4.6 | ||
Labour hold | Swing | 5.3 | |||
Party | Candidate | Votes | % | ±% | |
---|---|---|---|---|---|
Conservative | I. Lovewell | 592 | 39.7 | +8.8 | |
Labour | A. Waters | 588 | 39.5 | -9.6 | |
Liberal Democrats | I. Kendrick | 281 | 18.9 | -1.1 | |
Green | R. Boyd | 29 | 1.9 | N/A | |
Majority | 4 | 0.2 | -18.0 | ||
Turnout | 1,490 | 27.8 | -1.3 | ||
Conservative gain from Labour | Swing | 9.2 | |||
Party | Candidate | Votes | % | ±% | |
---|---|---|---|---|---|
Liberal Democrats | Brian Watkins | 1,861 | 58.0 | +2.6 | |
Conservative | Antony Little | 1,032 | 32.2 | -1.8 | |
Labour | C. Slorach | 258 | 8.0 | -2.5 | |
Green | John Peacock | 57 | 1.8 | N/A | |
Majority | 829 | 25.8 | +4.4 | ||
Turnout | 3,208 | 49.9 | -3.8 | ||
Liberal Democrats hold | Swing | 2.2 | |||
Party | Candidate | Votes | % | ±% | |
---|---|---|---|---|---|
Liberal Democrats | A. Aalders-Dunthorne | 904 | 55.0 | +6.4 | |
Labour | C. Morrey | 503 | 30.6 | -8.2 | |
Conservative | R. Wells | 151 | 9.2 | +1.6 | |
Green | I. Harris | 86 | 5.2 | +0.3 | |
Majority | 401 | 24.4 | +14.6 | ||
Turnout | 1,644 | 29.4 | -1.3 | ||
Liberal Democrats gain from Labour | Swing | 7.3 | |||
Party | Candidate | Votes | % | ±% | |
---|---|---|---|---|---|
Labour | D. Roper | 456 | 41.5 | -12.5 | |
Liberal Democrats | G. Dean | 250 | 22.7 | +3.5 | |
Conservative | C. Page | 224 | 20.4 | +7.3 | |
Green | M. Valentine | 170 | 15.5 | +1.7 | |
Majority | 206 | 18.7 | -16.0 | ||
Turnout | 1,100 | 19.7 | -0.7 | ||
Labour hold | Swing | 8.0 | |||
Party | Candidate | Votes | % | ±% | |
---|---|---|---|---|---|
Liberal Democrats | H. Cooke | 796 | 48.1 | +21.6 | |
Labour | K. Brown | 619 | 37.4 | -11.6 | |
Conservative | S. Daryanani | 202 | 12.2 | -7.9 | |
Green | Z. Zelter | 39 | 2.4 | N/A | |
Majority | 177 | 10.7 | — | ||
Turnout | 1,656 | 29.9 | +2.0 | ||
Liberal Democrats gain from Labour | Swing | 16.6 | |||
Party | Candidate | Votes | % | ±% | |
---|---|---|---|---|---|
Liberal Democrats | N. Ali | 716 | 39.0 | +18.7 | |
Labour | J. Lay | 588 | 32.1 | -11.8 | |
Conservative | J. Knight | 425 | 23.2 | -4.1 | |
Green | T. Tigger | 75 | 4.1 | -0.6 | |
Independent | M. Pryce | 30 | 1.6 | N/A | |
Majority | 128 | 7.0 | — | ||
Turnout | 1,834 | 27.9 | +2.3 | ||
Liberal Democrats gain from Labour | Swing | 15.3 | |||
Party | Candidate | Votes | % | ±% | |
---|---|---|---|---|---|
Labour | S. Morphew | 385 | 44.7 | -14.3 | |
Liberal Democrats | N. Langham | 280 | 32.5 | +11.1 | |
Conservative | G. Smith | 168 | 19.5 | -0.1 | |
Green | S. Land | 28 | 3.3 | N/A | |
Majority | 105 | 12.2 | -25.4 | ||
Turnout | 861 | 16.1 | -1.6 | ||
Labour hold | Swing | 12.7 | |||
Party | Candidate | Votes | % | ±% | |
---|---|---|---|---|---|
Liberal Democrats | S. Richardson | 630 | 47.1 | +12.9 | |
Labour | C. Sanderson | 401 | 30.0 | -15.6 | |
Conservative | J. Fisher | 204 | 15.2 | +0.6 | |
Green | Adrian Holmes | 64 | 4.8 | -0.7 | |
Independent | T. Smith | 39 | 2.9 | N/A | |
Majority | 229 | 17.1 | — | ||
Turnout | 1,338 | 22.8 | +0.2 | ||
Liberal Democrats gain from Labour | Swing | 14.3 | |||
Party | Candidate | Votes | % | ±% | |
---|---|---|---|---|---|
Liberal Democrats | S. Mitchell | 892 | 48.4 | -7.5 | |
Labour | B. Nierop-Reading | 601 | 32.6 | -6.2 | |
Green | D. Williams | 189 | 10.2 | N/A | |
Conservative | N. Horwood | 162 | 8.8 | +3.5 | |
Majority | 291 | 15.8 | -1.2 | ||
Turnout | 1,844 | 33.4 | -6.1 | ||
Liberal Democrats gain from Labour | Swing | 0.7 | |||
Party | Candidate | Votes | % | ±% | |
---|---|---|---|---|---|
Liberal Democrats | C. Southgate | 861 | 41.4 | +21.9 | |
Labour | S. Gale | 650 | 31.3 | -14.9 | |
Conservative | G. Williams | 448 | 21.5 | -4.1 | |
Green | N. Bartlett | 78 | 3.8 | -1.1 | |
Independent | S. Homes | 43 | 2.1 | N/A | |
Majority | 211 | 10.1 | — | ||
Turnout | 2,080 | 38.1 | +5.4 | ||
Liberal Democrats gain from Labour | Swing | 18.4 | |||
Party | Candidate | Votes | % | ±% | |
---|---|---|---|---|---|
Liberal Democrats | S. Allison | 684 | 53.0 | -5.6 | |
Labour | R. Taylor | 293 | 22.7 | -8.2 | |
Conservative | V. Hopes | 194 | 15.0 | +4.5 | |
Green | I. Wagenknecht | 119 | 9.2 | N/A | |
Majority | 391 | 30.3 | +2.6 | ||
Turnout | 1,290 | 21.8 | -4.6 | ||
Liberal Democrats hold | Swing | 1.3 | |||
Party | Candidate | Votes | % | ±% | |
---|---|---|---|---|---|
Liberal Democrats | A. Thomas | 965 | 55.9 | -6.5 | |
Labour | G. Colk | 383 | 22.2 | -2.4 | |
Conservative | I. Mackie | 292 | 16.9 | +6.3 | |
Green | M. Charnley | 78 | 4.5 | N/A | |
Natural Law | D. Mills | 9 | 0.5 | -0.5 | |
Majority | 582 | 33.7 | -4.1 | ||
Turnout | 1,727 | 31.6 | -5.2 | ||
Liberal Democrats hold | Swing | 2.1 | |||
Party | Candidate | Votes | % | ±% | |
---|---|---|---|---|---|
Liberal Democrats | D. Hume | 1,008 | 59.4 | -1.3 | |
Labour | K. Lay | 339 | 20.0 | -9.0 | |
Conservative | G. Nicholson | 183 | 10.8 | +3.9 | |
Green | R. Tinch | 166 | 9.8 | +6.7 | |
Majority | 669 | 39.4 | +7.4 | ||
Turnout | 1,696 | 30.6 | -6.2 | ||
Liberal Democrats hold | Swing | 3.9 | |||
Norfolk is a rural and non-metropolitan county in East Anglia in England. Norfolk is the fifth largest ceremonial county in England, with an area of 5,371 km². It borders Lincolnshire to the northwest, Cambridgeshire to the west and southwest, and Suffolk to the south. Its northern and eastern boundaries are the North Sea and to the northwest, The Wash. It also has a maritime border with the Netherlands. The county town is the city of Norwich. With an area of 2,074 square miles (5,370 km2) and a population of 859,400, Norfolk is a largely rural county with a population density of 401 per square mile. Of the county's population, 40% live in four major built up areas: Norwich (213,000), Great Yarmouth (63,000), King's Lynn (46,000), and Thetford (25,000).
One third of the Norwich District City Council in Norfolk, England is elected each year, followed by one year without election. Since the last boundary changes in 2004, 39 councillors have been elected from 13 wards.
The 2010 United Kingdom local elections were held on Thursday 6 May 2010, when the 2010 general election also took place. Direct elections were held to all 32 London boroughs, all 36 metropolitan boroughs, 76 second-tier district authorities, 20 unitary authorities and various Mayoral posts, all in England. For those authorities elected "all out" these were the first elections since 2006. The results provided some comfort to the Labour Party, losing the general election on the same day, as it was the first time Conservative councillor numbers declined since 1996.
The 2008 Norwich City Council election took place on 1 May 2008 to elect members of Norwich City Council in England. One third of seats were up for election. This was on the same day as other local elections.
The 2007 Norwich City Council election took place on 3 May 2007 to elect members of Norwich City Council in England. One third of seats (13) were up for election. This was on the same day as other local elections.
Norwich City Council is the city council for the city of Norwich, Norfolk, England. It consists of 39 councillors, elected to represent 13 wards, each with three councillors. It is currently under Labour control and led by Alan Waters. It forms the lower tier of local government in Norwich, responsible for local services such as housing, planning, leisure and tourism.
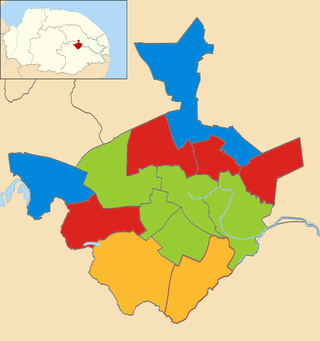
The 2015 Norwich City Council election took place on 7 May 2015 to elect approximately one third of the members of Norwich City Council in England. This was on the same day as other local elections and the UK general election. Thirteen seats were due to be contested, with a further two seats up for election where casual vacancies had arisen. Labour won ten of the available seats, the Green Party won four, and the Liberal Democrats one. The Conservatives gained their highest ever vote in many city wards including Town Close and Thorpe Hamlet, and across Norwich came within almost 2000 votes of the Green Party, however failed to gain any seats. Just one seat changed hands - Wensum - which Labour gained from the Greens. Labour retained overall control of the council with 22 seats out of 39, the Greens continue to form the main opposition with 14 seats, and the Liberal Democrats have 3.
The 2018 Norwich City Council election took on 3 May 2018 to elect members of Norwich City Council in England. This was on the same day as other local elections. 13 of 39 seats (one-third) were up for election.
The 1973 Norwich City Council election took place on 7 June 1973 to elect members of Norwich City Council in England. This was on the same day as other local elections. Voting took place across 16 wards, each electing 3 Councillors. Following the Local Government Act 1972, this was the first election to the new non-metropolitan district council for Norfolk, which came into being on 1 April the following year. Labour took control of the Council after winning a comfortable majority of seats.
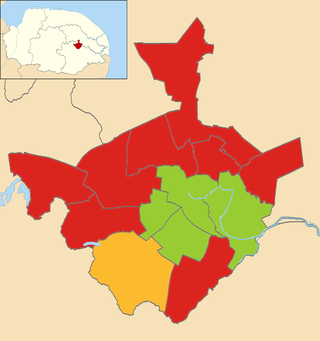
Elections to Norwich City Council were held on 2 May 2019. Following boundary changes, all 39 seats were put up for election, with three councillors being elected per ward using the block vote system. The election saw the Green Party reclaim five seats from the Labour Party, while the Labour Party retained its majority on the council.
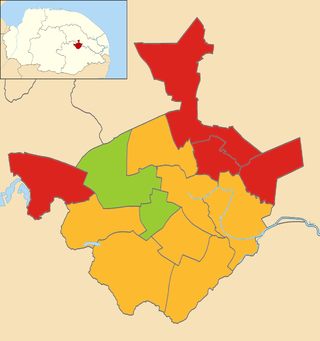
The 2021 Norwich City Council election took place on 6 May 2021 to elect members of Norwich City Council in England. This was on the same day as other local elections. 13 of 39 seats (one-third) were up for election.
The 1991 Norwich City Council election took on 2 May 1991 to elect members of Norwich City Council in England. This was on the same day as other local elections. 16 of 48 seats (one-third) were up for election, with one additional seat up due to a by-election in Catton Grove ward.
The 1992 Norwich City Council election took place on 7 May 1992 to elect members of Norwich City Council in England. This was on the same day as other local elections. 16 of 48 seats (one-third) were up for election, with one additional seat up due to the UK Parliamentary by-elections in Henderson ward.
The 1994 Norwich City Council election took on 5 May 1994 to elect members of Norwich City Council in England. This was on the same day as other local elections. 16 of 48 seats (one-third) were up for election, with one additional seat up due to a by-election in Lakenham ward.
The 1995 Norwich City Council election took on 4 May 1995 to elect members of Norwich City Council in England. This was on the same day as other local elections. 16 of 48 seats (one-third) were up for election.
The 1996 Norwich City Council election took on 2 May 1995 to elect members of Norwich City Council in England. This was on the same day as other local elections. 16 of 48 seats (one-third) were up for election, with three additional seats up due to by-elections in Coslany, St. Stephen and Thorpe Hamlet wards.
The 1998 Norwich City Council election took on 7 May 1998 to elect members of Norwich City Council in England. This was on the same day as other local elections. 16 of 48 seats (one-third) were up for election, with two additional seats up in Catton Grove and University wards due to by-elections.
The 1999 Norwich City Council election took on 6 May 1999 to elect members of Norwich City Council in England. This was on the same day as other local elections. 16 of 48 seats (one-third) were up for election, with an additional seat up in Coslany ward due to a by-election.
The 2002 Norwich City Council election took place on 2 May 2002 to elect members of Norwich City Council in England. This was on the same day as other local elections. 16 of 48 seats (one-third) were up for election, with an additional seat up in Henderson ward due to a by-election.
The 2003 Norwich City Council election took place on 1 May 2003 to elect members of Norwich City Council in England. This was on the same day as other local elections. 16 of 48 seats (one-third) were up for election, with an additional seat up in Henderson ward due to a by-election.