District result maps
 2003 results map
 2007 results map
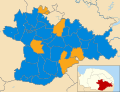 2011 results map
 2015 results map
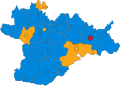 2019 results map
 2023 results map
South Norfolk District Council in Norfolk, England is elected once every four years. Since the last boundary changes in 2007, 46 councillors have been elected from 36 wards. [1]
The below table outlines the composition of South Norfolk Council from 1973 to 2023. [2]
| Year | Conservative | Liberal Democrats [a] | Labour | Green | Independents & Others | Council control after election | ||
|---|---|---|---|---|---|---|---|---|
| Local government reorganisation; council established (47 seats) | ||||||||
| 1973 | 6 | 1 | 7 | – | 33 | Independent | ||
| 1976 | 23 | 2 | 0 | 0 | 22 | No overall control | ||
| New ward boundaries (55 seats) | ||||||||
| 1979 | 31 | 2 | 0 | 0 | 22 | Conservative | ||
| New ward boundaries (47 seats) | ||||||||
| 1983 | 34 | 5 | 1 | 0 | 7 | Conservative | ||
| 1987 | 23 | 16 | 0 | 0 | 8 | No overall control | ||
| 1991 | 22 | 21 | 0 | 0 | 4 | No overall control | ||
| 1995 | 12 | 30 | 3 | 0 | 2 | Liberal Democrats | ||
| 1999 | 16 | 27 | 2 | 0 | 2 | Liberal Democrats | ||
| New ward boundaries (46 seats) | ||||||||
| 2003 | 18 | 28 | 0 | 0 | 0 | Liberal Democrats | ||
| 2007 | 39 | 7 | 0 | 0 | 0 | Conservative | ||
| 2011 | 38 | 8 | 0 | 0 | 0 | Conservative | ||
| 2015 | 40 | 6 | 0 | 0 | 0 | Conservative | ||
| 2019 | 35 | 10 | 1 | 0 | 0 | Conservative | ||
| 2023 | 25 | 11 | 9 | 0 | 2 | Conservative | ||


| Party | Candidate | Votes | % | ±% | |
|---|---|---|---|---|---|
| Liberal Democrats | 731 | 48.5 | −4.9 | ||
| Conservative | 271 | 18.0 | +5.2 | ||
| Labour | 257 | 17.0 | +0.9 | ||
| Independent | 249 | 16.5 | −1.1 | ||
| Majority | 474 | 30.5 | |||
| Turnout | 1,508 | 27.5 | |||
| Liberal Democrats hold | Swing | ||||
| Party | Candidate | Votes | % | ±% | |
|---|---|---|---|---|---|
| Conservative | Margaret Dewsbury | 500 | 57.1 | +3.7 | |
| Liberal Democrats | Paul Blathwayt | 336 | 38.4 | +10.2 | |
| Green | Andrew Brockbank | 40 | 4.6 | −2.6 | |
| Majority | 164 | 18.7 | |||
| Turnout | 876 | 45.9 | |||
| Conservative hold | Swing | ||||
| Party | Candidate | Votes | % | ±% | |
|---|---|---|---|---|---|
| Conservative | Anthony Palmer | 845 | 50.9 | +25.5 | |
| Liberal Democrats | Susan Ayres | 714 | 43.0 | +2.9 | |
| Green | Graham Sessions | 102 | 6.1 | +6.1 | |
| Majority | 131 | 7.9 | |||
| Turnout | 1,661 | 29.6 | |||
| Liberal Democrats hold | Swing | ||||
| Party | Candidate | Votes | % | ±% | |
|---|---|---|---|---|---|
| Liberal Democrats | Katy Smith | 659 | 52.8 | ||
| Labour | Cyril Gibbs | 312 | 25 | ||
| Green | Ian Boreham | 277 | 22.2 | ||
| Majority | 347 | ||||
| Turnout | |||||
| Liberal Democrats hold | Swing | ||||
| Party | Candidate | Votes | % | ±% | |
|---|---|---|---|---|---|
| Conservative | Jaan Larner | 260 | 53.5 | ||
| Labour | Sarah Langton | 93 | 19.1 | ||
| Liberal Democrats | Ernest Green | 69 | 14.2 | ||
| UKIP | Ron Murphy | 64 | 13.2 | ||
| Majority | 167 | ||||
| Turnout | |||||
| Conservative hold | Swing | ||||
| Party | Candidate | Votes | % | ±% | |
|---|---|---|---|---|---|
| Liberal Democrats | Ian Spratt | 1,202 | 42.0 | +6.0 | |
| Conservative | Silvia Schmidtova | 969 | 33.8 | −13.0 | |
| Labour | John Martin | 402 | 14.0 | −3.2 | |
| Green | Tom Williamson | 183 | 6.4 | +6.4 | |
| Reform UK | Andrew Pond | 107 | 3.7 | +3.7 | |
| Majority | 233 | 8.1 | |||
| Turnout | 2,863 | ||||
| Liberal Democrats hold | Swing | ||||
| Party | Candidate | Votes | % | ±% | |
|---|---|---|---|---|---|
| Liberal Democrats | Robert McClenning | 667 | 37.1 | ||
| Conservative | Tony Holden | 434 | 24.2 | ||
| Independent | Nigel Legg | 404 | 22.5 | ||
| Labour | Geraldine Smith-Cullen | 164 | 9.1 | ||
| Green | Claire Sparkes | 128 | 7.1 | ||
| Majority | 233 | 13.0 | |||
| Turnout | 1,797 | ||||
| Liberal Democrats hold | Swing | ||||
| Party | Candidate | Votes | % | ±% | |
|---|---|---|---|---|---|
| Liberal Democrats | Carmina McConnell | 286 | 35.0 | ||
| Conservative | Martyn Lemon | 268 | 32.8 | ||
| Labour | Lowell Doheny | 173 | 21.2 | ||
| Green | Victoria Walters | 89 | 10.9 | ||
| Majority | 18 | 2.2 | |||
| Turnout | 816 | ||||
| Liberal Democrats hold | Swing | ||||
| Party | Candidate | Votes | % | ±% | |
|---|---|---|---|---|---|
| Green | Suzanne Wateridge | 404 | 40.5 | +29.1 | |
| Conservative | Charles Easton | 394 | 39.5 | −9.5 | |
| Labour | Michael Crouch | 131 | 13.1 | −9.5 | |
| Liberal Democrats | Trevor Wenman | 68 | 6.8 | −11.2 | |
| Majority | 10 | 1.0 | |||
| Turnout | 997 | 39.8 | |||
| Registered electors | 2,521 | ||||
| Green gain from Conservative | Swing | ||||