| |||||||||||||||||||||||||||||||||||||||||||||||||||||
All 36 seats to Stratford-on-Avon District Council 19 seats needed for a majority | |||||||||||||||||||||||||||||||||||||||||||||||||||||
---|---|---|---|---|---|---|---|---|---|---|---|---|---|---|---|---|---|---|---|---|---|---|---|---|---|---|---|---|---|---|---|---|---|---|---|---|---|---|---|---|---|---|---|---|---|---|---|---|---|---|---|---|---|
| |||||||||||||||||||||||||||||||||||||||||||||||||||||
Winner of each seat at the 2019 Stratford-on-Avon District Council election | |||||||||||||||||||||||||||||||||||||||||||||||||||||
Composition of the council after the election | |||||||||||||||||||||||||||||||||||||||||||||||||||||
|
The 2019 Stratford-on-Avon District Council election took place on 2 May 2019 to elect members of the Stratford-on-Avon District Council in England. [1] It was held on the same day as other local elections.
2019 Stratford-on-Avon District Council election | ||||||||||
---|---|---|---|---|---|---|---|---|---|---|
Party | Candidates | Seats | Gains | Losses | Net gain/loss | Seats % | Votes % | Votes | +/− | |
Conservative | 35 | 20 | 0 | 11 | 11 | 55.6 | 45.8 | 17,047 | –8.1 | |
Liberal Democrats | 35 | 11 | 8 | 0 | 8 | 30.6 | 28.7 | 10,669 | +9.3 | |
Independent | 4 | 4 | 3 | 0 | 3 | 11.1 | 6.0 | 2,232 | +4.4 | |
Green | 36 | 1 | 1 | 0 | 1 | 2.8 | 12.0 | 4,446 | +7.5 | |
Labour | 31 | 0 | 0 | 1 | 1 | 0.0 | 7.3 | 2,725 | –5.7 | |
UKIP | 1 | 0 | 0 | 0 | 0.0 | 0.2 | 70 | –5.7 |
Party | Candidate | Votes | % | ±% | |
---|---|---|---|---|---|
Conservative | Mark Cargill | 712 | 58.0 | -12.6 | |
Labour | Andrew Foster | 211 | 17.2 | +7.2 | |
Liberal Democrats | Carolyn Evans | 197 | 16.1 | -3.2 | |
Green | Michael Mordue | 107 | 8.7 | New | |
Majority | |||||
Turnout | 1,251 | 42.7 | |||
Conservative hold | Swing | ||||
Party | Candidate | Votes | % | ±% | |
---|---|---|---|---|---|
Liberal Democrats | Susan Juned | 482 | 47.6 | +18.2 | |
Conservative | Susan Adams | 404 | 39.9 | -14.5 | |
Labour | Emma Randle | 70 | 6.9 | -4.5 | |
Green | Jacob Hotson | 57 | 5.6 | +0.8 | |
Majority | |||||
Turnout | 1,030 | 34.7 | |||
Liberal Democrats gain from Conservative | Swing | ||||
Party | Candidate | Votes | % | ±% | |
---|---|---|---|---|---|
Green | Jon Riley | 279 | 41.4 | +32.8 | |
Liberal Democrats | Cohl Warren-Howles | 170 | 25.2 | +10.2 | |
Conservative | Juliet Short | 166 | 24.6 | -18.3 | |
Labour | Karen Brown | 59 | 8.8 | -7.7 | |
Majority | |||||
Turnout | 680 | 27.8 | |||
Green gain from Conservative | Swing | ||||
Party | Candidate | Votes | % | ±% | |
---|---|---|---|---|---|
Conservative | Darren Pemberton | 516 | 51.4 | -2.9 | |
Labour | Anthony Kent | 212 | 21.1 | +1.1 | |
Liberal Democrats | Manuela Perteghella | 170 | 16.9 | +8.2 | |
Green | Thomas Venus | 106 | 10.6 | New | |
Majority | |||||
Turnout | 1,024 | 33.3 | |||
Conservative hold | Swing | ||||
Party | Candidate | Votes | % | ±% | |
---|---|---|---|---|---|
Conservative | William Fleming | 529 | 57.1 | -2.7 | |
Green | Thomas Genders | 167 | 18.0 | New | |
Liberal Democrats | William Horton | 140 | 15.1 | New | |
Labour | Christopher Jury | 90 | 9.7 | -11.7 | |
Majority | |||||
Turnout | 940 | 32.2 | |||
Conservative hold | Swing | ||||
Party | Candidate | Votes | % | ±% | |
---|---|---|---|---|---|
Conservative | Christopher Kettle | 644 | 63.5 | -3.6 | |
Liberal Democrats | Fiona Larner Onslow-Free | 214 | 21.1 | +12.3 | |
Green | Matthew North | 156 | 15.4 | +5.6 | |
Majority | |||||
Turnout | 1,033 | 33.7 | |||
Conservative hold | Swing | ||||
Party | Candidate | Votes | % | ±% | |
---|---|---|---|---|---|
Liberal Democrats | Victoria Alcock | 443 | 56.8 | +16.6 | |
Conservative | Roger Brian | 209 | 26.8 | -15.3 | |
Green | Bruno Mason | 70 | 9.0 | +0.9 | |
Labour | Aaron Marshall | 58 | 7.4 | -0.7 | |
Majority | |||||
Turnout | 796 | 31.5 | |||
Liberal Democrats gain from Conservative | Swing | ||||
Party | Candidate | Votes | % | ±% | |
---|---|---|---|---|---|
Conservative | Sarah Whalley-Hoggins | 691 | 60.3 | -11.6 | |
Liberal Democrats | Sara Billins | 251 | 21.9 | +7.9 | |
Green | Anne Waldon | 135 | 11.8 | New | |
Labour | Ronan Woods | 69 | 6.0 | -8.1 | |
Majority | |||||
Turnout | 1,172 | 42.5 | |||
Conservative hold | Swing | ||||
Party | Candidate | Votes | % | ±% | |
---|---|---|---|---|---|
Liberal Democrats | Ian Fradgley | 596 | 47.2 | +9.5 | |
Conservative | Lynda Organ | 464 | 36.7 | -9.4 | |
Green | Stephen Ward | 115 | 9.1 | +2.0 | |
Labour | Robin Malloy | 89 | 7.0 | -2.1 | |
Majority | |||||
Turnout | 1,283 | 40.7 | |||
Liberal Democrats gain from Conservative | Swing | ||||
Party | Candidate | Votes | % | ±% | |
---|---|---|---|---|---|
Independent | Jason Fojtik | 404 | 56.5 | New | |
Liberal Democrats | Philip How | 180 | 25.2 | +4.3 | |
Conservative | Ryan Podmore | 92 | 12.9 | -13.5 | |
Green | Elliot Wassell | 39 | 5.5 | +0.2 | |
Majority | |||||
Turnout | 727 | 39.0 | |||
Independent gain from Labour | Swing | ||||
Party | Candidate | Votes | % | ±% | |
---|---|---|---|---|---|
Conservative | Penny-Anne O'Donnell | 782 | 67.0 | +1.7 | |
Liberal Democrats | Nina Knapman | 171 | 14.6 | +3.2 | |
Green | Angela Webb | 158 | 13.5 | +8.2 | |
Labour | Alexander Monk | 57 | 4.9 | -3.5 | |
Majority | |||||
Turnout | 1,185 | 42.7 | |||
Conservative hold | Swing | ||||
Party | Candidate | Votes | % | ±% | |
---|---|---|---|---|---|
Liberal Democrats | Jennifer Fradgley | 710 | 63.9 | +25.5 | |
Conservative | Karen Parnell | 225 | 20.3 | -13.2 | |
Green | Stephen Micaux | 105 | 9.5 | +1.6 | |
Labour | Neil Annat | 71 | 6.4 | -3.6 | |
Majority | |||||
Turnout | 1,132 | 44.2 | |||
Liberal Democrats hold | Swing | ||||
Party | Candidate | Votes | % | ±% | |
---|---|---|---|---|---|
Independent | Jacqueline Harris | 451 | 40.7 | New | |
Liberal Democrats | Suzannah Bushill | 418 | 37.7 | +2.6 | |
Green | David Watkin | 133 | 12.0 | +4.6 | |
Labour | Thomas Greenway | 107 | 9.6 | -0.8 | |
Majority | |||||
Turnout | 1,132 | 39.7 | |||
Independent gain from Conservative | Swing | ||||
Party | Candidate | Votes | % | ±% | |
---|---|---|---|---|---|
Liberal Democrats | Gillian Cleeve | 304 | 46.3 | +9.7 | |
Conservative | Timothy Sinclair | 146 | 22.2 | -13.9 | |
Labour | Kieran Kelly | 111 | 16.9 | +1.0 | |
Green | Peter Pettifor | 96 | 14.6 | +3.3 | |
Majority | |||||
Turnout | 668 | 29.6 | |||
Liberal Democrats hold | Swing | ||||
Party | Candidate | Votes | % | ±% | |
---|---|---|---|---|---|
Conservative | Matthew Jennings | 805 | 65.2 | -5.1 | |
Green | Penelope Stott | 241 | 19.5 | +10.3 | |
Liberal Democrats | Karyl Rees | 107 | 8.7 | +0.2 | |
Labour | Christopher Jones | 81 | 6.6 | -5.3 | |
Majority | |||||
Turnout | 1,257 | 40.2 | |||
Conservative hold | Swing | ||||
Party | Candidate | Votes | % | ±% | |
---|---|---|---|---|---|
Conservative | Christopher Mills | 824 | 66.8 | +5.0 | |
Liberal Democrats | Nicholas Solman | 210 | 17.0 | +8.1 | |
Green | Robert Ballantyne | 199 | 16.1 | +9.3 | |
Majority | |||||
Turnout | 1,249 | 42.7 | |||
Conservative hold | Swing | ||||
Party | Candidate | Votes | % | ±% | |
---|---|---|---|---|---|
Conservative | Gillian Forman | 520 | 54.1 | -13.5 | |
Liberal Democrats | Lynn Bowring | 302 | 31.4 | +7.5 | |
Green | Therese Venus | 82 | 8.5 | New | |
Labour | Kathrin Foster | 57 | 5.9 | -2.6 | |
Majority | |||||
Turnout | 972 | 42.2 | |||
Conservative hold | Swing | ||||
Party | Candidate | Votes | % | ±% | |
---|---|---|---|---|---|
Liberal Democrats | Louis Adam | 491 | 46.2 | +33.2 | |
Conservative | Ben Dalton | 355 | 33.4 | -34.3 | |
Labour | James Briggs | 123 | 11.6 | -7.7 | |
Green | Elizabeth Donovan | 93 | 8.8 | New | |
Majority | |||||
Turnout | 1,090 | 32.7 | |||
Liberal Democrats gain from Conservative | Swing | ||||
Party | Candidate | Votes | % | ±% | |
---|---|---|---|---|---|
Liberal Democrats | Nigel Rock | 539 | 50.8 | +36.6 | |
Conservative | Emilia Fletcher | 394 | 37.2 | -19.7 | |
Green | Zoe James | 127 | 12.0 | New | |
Majority | |||||
Turnout | 1,079 | 40.9 | |||
Liberal Democrats gain from Conservative | Swing | ||||
Party | Candidate | Votes | % | ±% | |
---|---|---|---|---|---|
Conservative | Edward Fitter | 515 | 59.1 | -7.8 | |
Green | Olivia Hatch | 180 | 20.6 | New | |
Liberal Democrats | Diane Walden | 107 | 12.3 | +2.0 | |
Labour | Nicholas Partington | 70 | 8.0 | -1.4 | |
Majority | |||||
Turnout | 891 | 33.0 | |||
Conservative hold | Swing | ||||
Party | Candidate | Votes | % | ±% | |
---|---|---|---|---|---|
Conservative | John Feilding | 698 | 61.6 | -0.8 | |
Green | Allison Aves | 226 | 19.9 | New | |
Liberal Democrats | John Insoll | 135 | 11.9 | +1.6 | |
Labour | Janice Sewell | 75 | 6.6 | -2.8 | |
Majority | |||||
Turnout | 1,153 | 42.6 | |||
Conservative hold | Swing | ||||
Party | Candidate | Votes | % | ±% | |
---|---|---|---|---|---|
Conservative | Trevor Harvey | 545 | 54.6 | +1.1 | |
Liberal Democrats | Roger Billins | 238 | 23.8 | New | |
Green | Peter Landsman | 133 | 13.3 | +5.7 | |
Labour | Jan Ozimkowski | 82 | 8.2 | -17.2 | |
Majority | |||||
Turnout | 1,017 | 33.9 | |||
Conservative hold | Swing | ||||
Party | Candidate | Votes | % | ±% | |
---|---|---|---|---|---|
Conservative | Joanna Barker | 546 | 50.9 | +14.6 | |
Liberal Democrats | John Dinnie | 316 | 29.5 | -6.0 | |
Green | Dvaid Passingham | 119 | 11.1 | +6.8 | |
Labour | Frances Lee | 92 | 8.6 | -5.5 | |
Majority | |||||
Turnout | 1,091 | 38.7 | |||
Conservative hold | Swing | ||||
Party | Candidate | Votes | % | ±% | |
---|---|---|---|---|---|
Liberal Democrats | David Curtis | 527 | 53.8 | +23.8 | |
Conservative | Jake Findlater | 316 | 32.2 | -11.5 | |
Green | Jenny Harding | 98 | 10.0 | +1.5 | |
Labour | Robert Williams | 39 | 4.0 | -4.4 | |
Majority | |||||
Turnout | 993 | 41.3 | |||
Liberal Democrats gain from Conservative | Swing | ||||
Party | Candidate | Votes | % | ±% | |
---|---|---|---|---|---|
Conservative | Peter Richards | 694 | 62.3 | -7.0 | |
Green | Rosie Parker | 198 | 17.8 | +8.0 | |
Liberal Democrats | Roger Harding | 162 | 14.5 | +3.8 | |
Labour | Liam Bridge | 60 | 5.4 | -3.7 | |
Majority | |||||
Turnout | 1,151 | 39.8 | |||
Conservative hold | Swing | ||||
Party | Candidate | Votes | % | ±% | |
---|---|---|---|---|---|
Independent | Tony Bromwich | 480 | 56.9 | New | |
Conservative | Richard Hobbs | 167 | 19.8 | -31.3 | |
Liberal Democrats | David Booth | 115 | 13.6 | +4.0 | |
Green | Patricia Hotson | 82 | 9.7 | New | |
Majority | |||||
Turnout | 851 | 31.1 | |||
Independent gain from Conservative | Swing | ||||
Party | Candidate | Votes | % | ±% | |
---|---|---|---|---|---|
Conservative | Andrew Crump | 652 | 67.8 | +10.4 | |
Labour | Helen Wilson | 148 | 15.4 | -2.7 | |
Green | Derek Price | 83 | 8.6 | +1.9 | |
Liberal Democrats | Susan Roderick | 79 | 8.2 | +3.8 | |
Majority | |||||
Turnout | 970 | 34.6 | |||
Conservative hold | Swing | ||||
Party | Candidate | Votes | % | ±% | |
---|---|---|---|---|---|
Liberal Democrats | Peter Hencher-Serafin | 447 | 43.7 | +4.7 | |
Conservative | Justin Kerridge | 395 | 38.6 | -4.2 | |
Green | Victoria Widdowson | 92 | 9.0 | +3.4 | |
Labour | Watne Bates | 89 | 8.7 | -4.8 | |
Majority | |||||
Turnout | 1,035 | 34.7 | |||
Liberal Democrats gain from Conservative | Swing | ||||
Party | Candidate | Votes | % | ±% | |
---|---|---|---|---|---|
Liberal Democrats | Neil Edden | 424 | 42.4 | +11.1 | |
Conservative | Paul Beaman | 367 | 36.7 | +4.1 | |
Green | Valerie Gaize | 105 | 10.5 | +8.3 | |
Labour | Christopher Pilkington | 103 | 10.3 | -7.8 | |
Majority | |||||
Turnout | 1,009 | 34.4 | |||
Liberal Democrats gain from Conservative | Swing | ||||
Party | Candidate | Votes | % | ±% | |
---|---|---|---|---|---|
Conservative | Anthony Dixon | 650 | 78.8 | +9.4 | |
Liberal Democrats | Joseph Benjamin | 76 | 9.2 | +2.4 | |
Green | John Stott | 72 | 8.7 | New | |
Labour | Anthony O'Hagan | 27 | 3.3 | -15.5 | |
Majority | |||||
Turnout | 839 | 31.9 | |||
Conservative hold | Swing | ||||
Party | Candidate | Votes | % | ±% | |
---|---|---|---|---|---|
Liberal Democrats | Catherine Rolfe | 873 | 66.8 | +18.7 | |
Conservative | Philip Applin | 316 | 24.2 | -15.5 | |
Green | Jack Fildew | 62 | 4.7 | ±0.0 | |
Labour | Helen Cooper | 56 | 4.3 | -3.1 | |
Majority | |||||
Turnout | 1,323 | 44.1 | |||
Liberal Democrats hold | Swing | ||||
Party | Candidate | Votes | % | ±% | |
---|---|---|---|---|---|
Conservative | Anthony Jefferson | 433 | 44.0 | +7.1 | |
Liberal Democrats | Elizabeth Coles | 379 | 38.6 | +22.8 | |
Green | Duncan Parker | 108 | 11.0 | +5.2 | |
Labour | Sally Bigwood | 63 | 6.4 | -2.8 | |
Majority | |||||
Turnout | 1,004 | 40.6 | |||
Conservative hold | Swing | ||||
Party | Candidate | Votes | % | ±% | |
---|---|---|---|---|---|
Independent | Frederick Barnes | 897 | 65.1 | +17.7 | |
Conservative | Richard Cox | 291 | 21.1 | -25.8 | |
Green | Ian Cuthbertson | 117 | 8.5 | New | |
Labour | George Spicer | 73 | 5.3 | -0.3 | |
Majority | |||||
Turnout | 1,384 | 44.7 | |||
Independent hold | Swing | ||||
Party | Candidate | Votes | % | ±% | |
---|---|---|---|---|---|
Conservative | Anne Parry | 590 | 48.5 | -0.7 | |
Liberal Democrats | David Johnston | 391 | 32.2 | +4.5 | |
Labour | Hazel Haywood | 105 | 8.6 | +0.9 | |
UKIP | Frank Rietz | 70 | 5.8 | -4.1 | |
Green | Roger Fisher | 60 | 4.9 | -0.6 | |
Majority | |||||
Turnout | 1,228 | 41.5 | |||
Conservative hold | Swing | ||||
Party | Candidate | Votes | % | ±% | |
---|---|---|---|---|---|
Conservative | Daniel Kendall | 653 | 64.5 | +4.9 | |
Liberal Democrats | Deborah Chowdhury | 151 | 14.9 | -9.4 | |
Labour | Carol Canty | 112 | 11.1 | +1.3 | |
Green | Victoria Parker | 97 | 9.6 | +3.4 | |
Majority | |||||
Turnout | 1,028 | 34.3 | |||
Conservative hold | Swing | ||||
Party | Candidate | Votes | % | ±% | |
---|---|---|---|---|---|
Conservative | Ian Shenton | 741 | 66.8 | +11.9 | |
Liberal Democrats | John Bicknell | 154 | 13.9 | +3.0 | |
Green | Charlotte McClymont | 149 | 13.4 | +6.2 | |
Labour | Philip Heath | 66 | 5.9 | -3.2 | |
Majority | |||||
Turnout | 1,126 | 38.6 | |||
Conservative hold | Swing | ||||
Party | Candidate | Votes | % | ±% | |
---|---|---|---|---|---|
Liberal Democrats | Manuella Perteghella | 472 | 43.6 | New | |
Conservative | Richard Cox | 323 | 29.9 | +8.8 | |
Independent | Neal Appleton | 231 | 21.3 | -43.8 | |
Labour | Anthony Kent | 41 | 3.8 | -1.5 | |
Green | John Stott | 15 | 1.4 | -7.1 | |
Majority | 149 | 13.7 | |||
Turnout | 1,082 | 32.1 | -12.6 | ||
Liberal Democrats gain from Independent | Swing | ||||
John Feilding, elected as a Conservative, resigned from the party in January 2023 to sit as an independent. [2]
Jason Fojtik, elected as an independent in May 2019, rejoined the Labour party (which he had left shortly before the 2019 election) in March 2023. [3]
Stratford-on-Avon is a local government district in Warwickshire, England. The district is named after its largest town of Stratford-upon-Avon, but with a change of preposition; the town uses "upon" and the district uses "on". The council is based in Stratford-upon-Avon and the district, which is predominantly rural, also includes the towns of Alcester, Shipston-on-Stour and Southam, and the large villages of Bidford-on-Avon, Studley and Wellesbourne, plus numerous other smaller villages and hamlets and surrounding rural areas. The district covers the more sparsely populated southern part of Warwickshire, and contains nearly half the county's area. The district includes part of the Cotswolds, a designated Area of Outstanding Natural Beauty.
Stratford-on-Avon District Council elections are held every four years. Stratford-on-Avon District Council is the local authority for the non-metropolitan district of Stratford-on-Avon in Warwickshire, England. Since the last boundary changes in 2023, 41 councillors have been elected from 39 wards. Prior to 2015 elections were held three years out of every four, with a third of the council elected each time.
Warwickshire County Council is the county council that governs the non-metropolitan county of Warwickshire in England. Its headquarters are at Shire Hall in the centre of Warwick, the county town. The council's principal functions are county roads and rights of way, social services, education and libraries, but it also provides numerous other local government services in its area.
The 2006 Stratford-on-Avon District Council election took place on 4 May 2006 to elect members of Stratford-on-Avon District Council in Warwickshire, England. One third of the council was up for election and the Conservative Party stayed in overall control of the council.
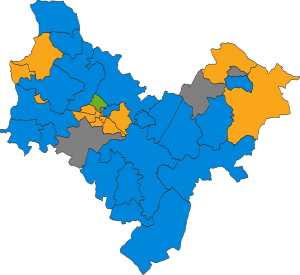
The 2007 Stratford-on-Avon District Council election took place on 3 May 2007 to elect members of Stratford-on-Avon District Council in Warwickshire, England. One third of the council was up for election and the Conservative Party stayed in overall control of the council.
The 2018 Newcastle-under-Lyme Borough Council election took place on 3 May 2018 to elect members of Newcastle-under-Lyme Borough Council in England. It was held on the same day as other local elections.
The 2019 Uttlesford District Council election took place on 2 May 2019 to elect members of Uttlesford District Council in England. This was on the same day as other local elections.
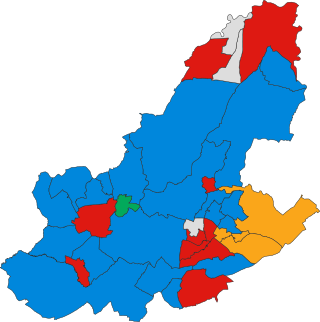
The 2019 Staffordshire Moorlands District Council election took place on 2 May 2019 to elect members of Staffordshire Moorlands District Council in England. This was on the same day as other local elections.
Elections to elect all members of the North West Leicestershire District Council took place on 2 May 2019, held as one of the English local elections of that year.
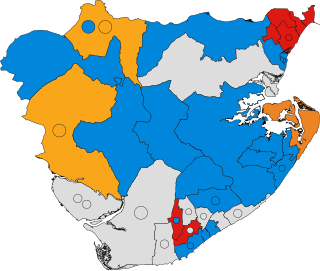
The 2019 East Lindsey District Council election took place on 2 May 2019 to elect all members of East Lindsey District Council in England. The Conservatives retained overall control of the council.
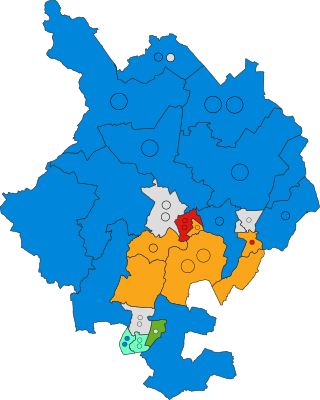
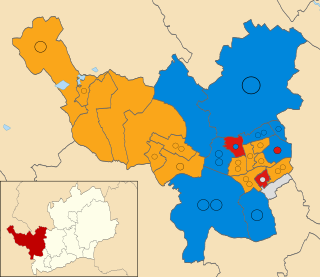
The 2022 Newcastle-under-Lyme Borough Council election took place on 5 May 2022 to elect members of Newcastle-under-Lyme Borough Council in England. It was held on the same day as other local elections.
The 2022 Flintshire County Council election took place on 5 May 2022 to elect all 67 councillors on Flintshire County Council in Wales, as part of the 2022 Welsh local elections.
The 2023 Uttlesford District Council election took place on 4 May 2023 to elect members of Uttlesford District Council in Essex, England. This was on the same day as other local elections across England.
The 2023 Epping Forest District Council election took place on 4 May 2023 to elect members of Epping Forest District Council in Essex, England. There were 18 of the 58 seats up for election, being the usual approximate third of the council. This was on the same day as other local elections across England.
The 2023 East Lindsey District Council election took place on 4 May 2023, to elect all 55 members of East Lindsey District Council in Lincolnshire, England. This was on the same day as other local elections across England.
The 2023 Melton Borough Council election took place on 4 May 2023, to elect all 28 members of Melton Borough Council in Leicestershire, England.
The 2023 North East Derbyshire District Council election took place on 4 May 2023 to elect all 53 members of North East Derbyshire District Council in Derbyshire, England. This was on the same day as other local elections across England.
The 2023 North Warwickshire Borough Council election took place on 4 May 2023, to elect all 35 members of North Warwickshire Borough Council in Warwickshire, England.
The 2023 Cannock Chase District election took place on 4 May 2023 to elect 17 of the 41 councillors on Cannock Chase District Council in Staffordshire, England. on the same day as other local elections in England, including to eight parish councils in the district. The usual nominal third of the council was up for election, plus there were two vacancies to be filled, meaning a total of 17 councillors were elected.
The 2023 Tandridge District Council election took place on 4 May 2023 to elect 14 members (one-third) of Tandridge District Council in Surrey, England. This was on the same day as other local elections across England.