Results maps
 2005 results map
 2009 results map
 2013 results map
 2017 results map
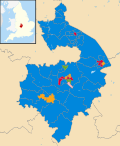 2021 results map
 2025 results map
Warwickshire County Council elections are held every four years. Warwickshire County Council is the upper-tier authority for the non-metropolitan county of Warwickshire in England. Since the last boundary changes in 2017, 57 councillors have been elected from 57 electoral divisions. [1]
Summary of the council composition after each election; click on the year for full details of each election. [2]
| Year | Conservative | Labour | Liberal Democrats [a] | Green Party | Independent [b] | Reform UK | Control | Notes | |
|---|---|---|---|---|---|---|---|---|---|
| 1973 | 27 | 21 | 5 | 2 | No overall control | ||||
| 1977 | 43 | 10 | 2 | Conservative | |||||
| 1981 | 30 | 27 | 3 | 2 | No overall control | New division boundaries [3] | |||
| 1985 | 26 | 24 | 10 | 2 | No overall control | ||||
| 1989 | 32 | 24 | 4 | 2 | Conservative | ||||
| 1993 | 19 | 30 | 10 | 3 | No overall control | ||||
| 1997 | 22 | 31 | 8 | 1 | No overall control | ||||
| 2001 | 20 | 28 | 13 | 1 | No overall control | ||||
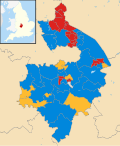
| 2005 | 27 | 23 | 11 | 1 | No overall control | New division boundaries [4] | |||
| 2009 | 39 | 10 | 12 | 1 | Conservative | ||||
| 2013 | 26 | 22 | 9 | 2 | 3 | No overall control | |||
| 2017 | 36 | 10 | 7 | 2 | 2 | Conservative | New division boundaries [1] | ||
| 2021 | 42 | 6 | 5 | 3 | 1 | Conservative | |||
| 2025 | 9 | 3 | 14 | 7 | 1 | 23 | No overall control | ||


| Party | Candidate | Votes | % | ±% | |
|---|---|---|---|---|---|
| Labour | 1,011 | 43.1 | −6.9 | ||
| Conservative | 741 | 33.1 | +6.0 | ||
| Liberal Democrats | 489 | 21.8 | +0.9 | ||
| Majority | 270 | 10.0 | |||
| Turnout | 2,241 | ||||
| Labour hold | Swing | ||||
| Party | Candidate | Votes | % | ±% | |
|---|---|---|---|---|---|
| Conservative | Laura Main | 1,112 | 52.6 | +3.0 | |
| Liberal Democrats | David Johnston | 776 | 36.7 | −6.0 | |
| Labour | John Ritchie | 227 | 10.7 | +10.7 | |
| Majority | 336 | 15.9 | |||
| Turnout | 2,115 | 35.6 | |||
| Conservative hold | Swing | ||||
| Party | Candidate | Votes | % | ±% | |
|---|---|---|---|---|---|
| Labour | Douglas Hodkinson | 724 | 33.8 | −7.9 | |
| Conservative | Jane Watson | 723 | 33.7 | +4.7 | |
| BNP | George Jones | 313 | 14.6 | +14.6 | |
| Liberal Democrats | Diane Pask | 235 | 11.0 | −3.3 | |
| Green | Philip Godden | 148 | 6.9 | +6.9 | |
| Majority | 1 | 0.1 | |||
| Turnout | 2,143 | 28.9 | |||
| Labour hold | Swing | ||||
| Party | Candidate | Votes | % | ±% | |
|---|---|---|---|---|---|
| Labour | Barry Longden | 1,331 | 41.7 | +13.5 | |
| Conservative | Tom Wilson | 1,079 | 33.8 | +2.6 | |
| BNP | Martyn Findley | 449 | 14.1 | −10.4 | |
| Green | Michael Wright | 170 | 5.3 | −10.8 | |
| Liberal Democrats | Alice Field | 118 | 3.7 | +3.7 | |
| Socialist Alternative | Steven Gee | 43 | 1.3 | +1.3 | |
| Majority | 252 | 7.9 | |||
| Turnout | 3,190 | 21.4 | |||
| Labour gain from Conservative | Swing | ||||
| Party | Candidate | Votes | % | ±% | |
|---|---|---|---|---|---|
| Conservative | Jeffrey Clarke | 3,195 | 56.3 | −8.5 | |
| Labour | Paul Hickling | 1,616 | 28.5 | +9.0 | |
| Green | Keith Kondakor | 589 | 10.4 | −5.4 | |
| Independent | Thomas Wilson | 280 | 4.9 | +4.9 | |
| Majority | 1,579 | 27.8 | |||
| Turnout | 5,680 | ||||
| Conservative hold | Swing | ||||
| Party | Candidate | Votes | % | ±% | |
|---|---|---|---|---|---|
| Liberal Democrats | Clive Rickhards | 1,906 | 44.6 | −1.2 | |
| Conservative | Justin Kerridge | 1,755 | 41.1 | −1.5 | |
| Labour | Jacqueline Abbott | 480 | 11.2 | +6.4 | |
| Green | Karen Varga | 128 | 3.0 | −3.7 | |
| Majority | 151 | 3.5 | |||
| Turnout | 4,269 | 70.3 | |||
| Liberal Democrats hold | Swing | ||||
| Party | Candidate | Votes | % | ±% | |
|---|---|---|---|---|---|
| Labour | Brian Hawkes | 904 | 62.56 | ||
| Conservative | Janet Batterbee | 353 | 24.42 | ||
| UKIP | Andrew Hutchings | 142 | 9.82 | ||
| TUSC | Natara Hunter | 46 | 3.18 | ||
| Majority | 551 | 38.13 | |||
| Turnout | 1,445 | 16.94 | |||
| Party | Candidate | Votes | % | ±% | |
|---|---|---|---|---|---|
| Labour | Chris Clark | 738 | 32.9 | −2.0 | |
| UKIP | Bella Wayte | 699 | 31.2 | −2.3 | |
| Conservative | David Wright | 616 | 27.5 | −1.2 | |
| Independent | Carol Fox | 190 | 8.5 | +8.5 | |
| Majority | 39 | 1.7 | |||
| Turnout | 2,243 | ||||
| Labour hold | Swing | ||||
| Party | Candidate | Votes | % | ±% | |
|---|---|---|---|---|---|
| Conservative | Jeff Morgan | 1,281 | 58.4 | +5.5 | |
| Labour | Andrew Crichton | 503 | 22.9 | −8.5 | |
| UKIP | Alwyn Waine | 292 | 13.3 | +13.3 | |
| Green | Mick Ludford | 119 | 5.4 | −10.3 | |
| Majority | 778 | 35.4 | |||
| Turnout | 2,195 | ||||
| Conservative hold | Swing | ||||
| Party | Candidate | Votes | % | ±% | |
|---|---|---|---|---|---|
| Labour | Helen Adkins | 1,164 | 44.7 | −1.2 | |
| Green | Martin Luckhurst | 1139 | 43.7 | +9.0 | |
| Conservative | Stacey Calder | 266 | 10.2 | −5.7 | |
| Liberal Democrats | George Begg | 36 | 1.4 | −2.1 | |
| Majority | 25 | 1.0 | |||
| Turnout | 2,605 | ||||
| Labour hold | Swing | ||||
| Party | Candidate | Votes | % | ±% | |
|---|---|---|---|---|---|
| Liberal Democrats | Dominic Skinner | 877 | 40.7 | +16.3 | |
| Conservative | Lynda Organ | 610 | 28.3 | −0.1 | |
| Stratford First Independent | Juliet Short | 345 | 16.0 | −17.1 | |
| Labour | Joshua Payne | 180 | 8.3 | −0.9 | |
| Green | John Riley | 144 | 6.7 | +1.5 | |
| Majority | 267 | 12.4 | |||
| Turnout | 2,156 | ||||
| Liberal Democrats gain from Stratford First Independent | Swing | ||||
| Party | Candidate | Votes | % | ±% | |
|---|---|---|---|---|---|
| Conservative | Ian Shenton | 1,609 | 59.3 | −14.7 | |
| Liberal Democrats | Thom Holmes | 854 | 31.5 | +24.3 | |
| Labour | Bryn Turner | 251 | 9.2 | −0.8 | |
| Majority | 755 | 27.7 | |||
| Turnout | 2,712 | ||||
| Conservative hold | Swing | ||||
| Party | Candidate | Votes | % | ±% | |
|---|---|---|---|---|---|
| Conservative | Dale Keeling | 911 | 42.8 | −23.0 | |
| Liberal Democrats | Stephen Pimm | 649 | 30.5 | +23.6 | |
| Labour | Alison Livesey | 350 | 16.4 | −2.5 | |
| Green | Helen Ford | 219 | 10.3 | +1.9 | |
| Majority | 262 | 12.3 | |||
| Turnout | 2,129 | ||||
| Conservative hold | Swing | ||||
| Current | |
|---|---|
| Former | |
aUnitary authorities referred to as county councils | |